Scottish Household Survey 2024 findings: neighbourhoods and communities report
This report provides insights into neighbourhoods and communities in Scotland. It draws on key data from the Scottish Household Survey (2024) to explore neighbourhoods and communities both at a national level in Scotland and for different subgroups and different places.
Neighbourhoods
In 2024, over nine in 10 adults (94%) rated their neighbourhood as a ‘very’ or ‘fairly’ good place to live, a slight fall from 95% in 2023. Over half of adults in Scotland (54%) rated their neighbourhood as a ‘very good’ place to live (Table 2.1 in the supporting Excel workbook). This is stable, from 55% in 2023. The proportion of people who rate their neighbourhood as a ‘very good’ place to live has historically (since 1999) been between 50% and 57%, so this is a relatively stable measure.
There are differences by Local Authority. Eighty-seven percent of adults in North Ayrshire rate their neighbourhood as a ‘very good’ or ‘fairly good’ place to live, compared to 100% in Orkney Islands (Figure 1, Table 2.1 in the supporting Excel workbook).
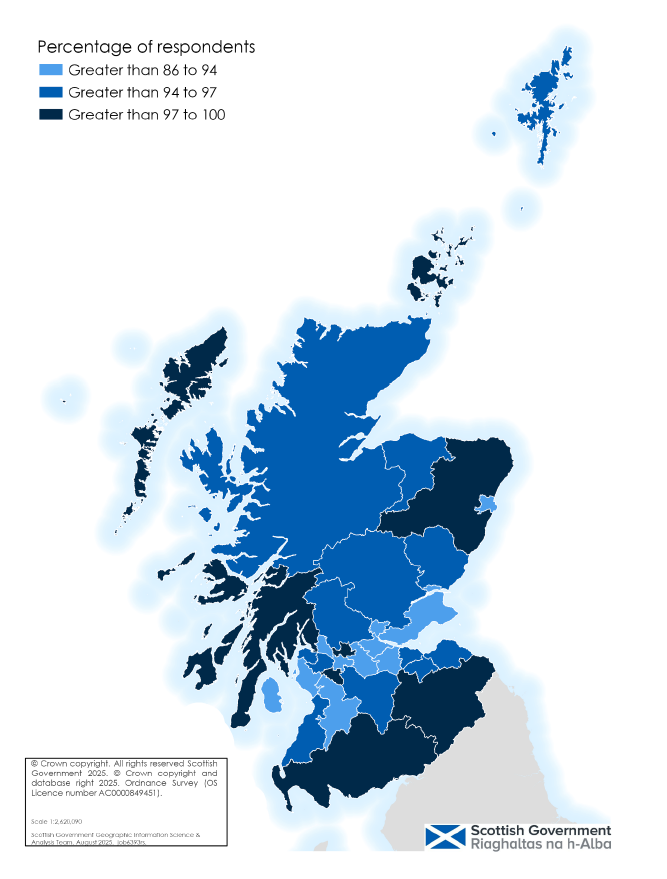
Percentage of adults who rate their neighbourhood as a 'very good' and 'fairly good' place to live by Local Authority, 2024, Scotland[3]
Neighbourhood ratings vary by area deprivation. Adults in the 20% least deprived areas were more likely to rate their neighbourhood as a ‘very good’ place to live than those in the 20% most deprived areas (73% in the least deprived areas, compared to 26% in the most deprived areas) (Table 2.5 in the supporting Excel workbook and Figure 2).
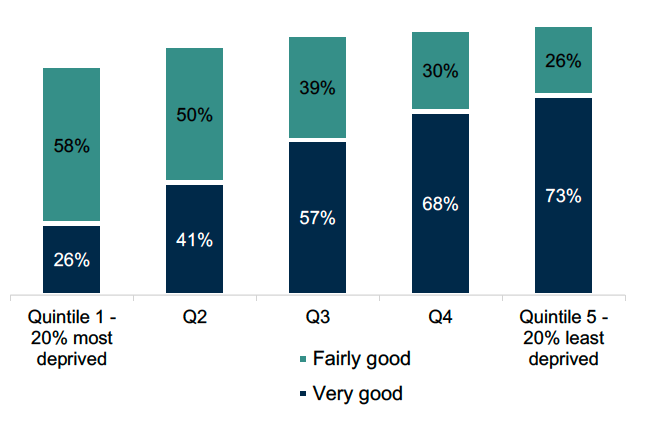
Percentage of adults who rate their neighbourhood as a 'very good' and 'fairly good' place to live by SIMD, 2024, Scotland[4]
Neighbourhood ratings also vary by whether people live in urban or rural settings, and by age, disability and ethnicity (Tables 2.2, 2.7 to 2.10 in the supporting Excel workbook).
Neighbourhood ratings increase with age. In 2024, 44% of 16 to 24 year olds rated their neighbourhood as a ‘very good’ place to live, this rises to almost two thirds (65%) of those aged 75 and over (Tables 2.7 and 2.8 in the supporting Excel workbook).
Those in remote rural areas or accessible rural areas (74% and 65%, respectively) were more likely to describe their neighbourhood as a ‘very good’ place to live, compared to 49% in both large urban areas and other urban areas (Table 2.2 in the supporting Excel workbook).[5]
There are differences by ethnicity. Fifty-four percent of ‘White’ people rate their neighbourhood as a ‘very good’ place to live, compared with 48% of those from ‘Other Ethnic’ backgrounds (Table 2.10 in the supporting Excel workbook).
Disabled people are also less likely to rate their neighbourhoods positively. Forty-seven percent of disabled people rate their neighbourhoods as a ‘very good’ place to live, compared to 56% of non-disabled people (Table 2.9 in the supporting Excel workbook).
Contact
Email: socialresearch@gov.scot