Good Food Nation plan: initial monitoring framework
The first monitoring framework for the national Good Food Nation Plan establishes a baseline for evaluating Scotland’s food system. It sets out 51 high-level indicators used to monitor progress towards the six overarching outcomes outlined in the national Good Food Nation Plan.
6. Outcome 4: A strong food and drink sector
Outcome 4: Our food and drink sector is prosperous, diverse, innovative, and vital to national and local economic and social well-being. It is key to making Scotland food secure and food resilient, and creates and sustains jobs and businesses underpinned by fair work standards throughout food supply chains.
Summary of Outcome 4 Indicators
The food and drink sector consists of agricultural businesses, fishing and aquaculture businesses and food and drink manufacturing businesses. The sector is a major contributor to Scotland’s economy - with an annual turnover of £18.9 billion and a GVA of £7.0 billion in 2023. The sector also consists of 17,345 businesses (of which around 80% are agricultural businesses) - approximately 10% of all registered business in Scotland.
The indicators for this sub-outcome are drawn from a range of economic statistics compiled by Scottish Government in the Industry Statistics database which measures the economic output of a range of sectors (note that exports of food and drink products is covered in Outcome 6). Innovation within the sector is also captured though the UK Innovation Survey. Finally, as agricultural businesses make up most of the sector (in terms of number of businesses), the economic performance of farming businesses is also captured under this outcome.[132]
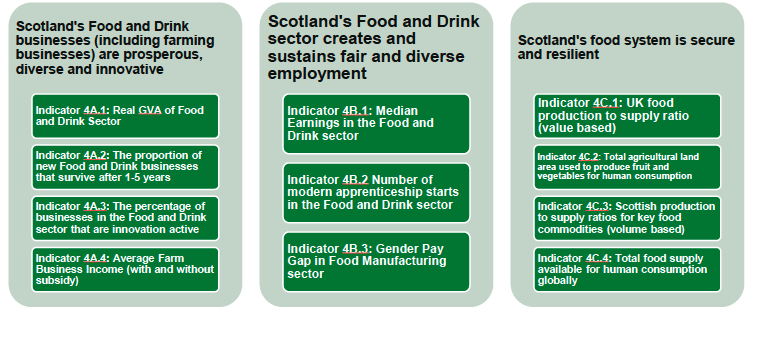
Scotland's Food and Drink businesses (including farming businesses) are prosperous, diverse and innovative
- Indicator 4A.1: Real GVA of Food and Drink Sector
- Indicator 4A.2: The proportion of new Food and Drink businesses that survive after 1-5 years
- Indicator 4A.3: The percentage of businesses in the Food and Drink sector that are innovation active
- Indicator 4A.4: Average Farm Business Income (with and without subsidy)
Scotland's Food and Drink sector creates and sustains fair and diverse employment
- Indicator 4B.1: Median Earnings in the Food and Drink sector
- Indicator 4B.2 Number of modern apprenticeship starts in the Food and Drink sector
- Indicator 4B.3: Gender Pay Gap in Food Manufacturing sector
Scotland's food system is secure and resilient
- Indicator 4C.1: UK food production to supply ratio (value based)
- Indicator 4C.2: Total agricultural land area used to produce fruit and vegetables for human consumption
- Indicator 4C.3: Scottish production to supply ratios for key food commodities (volume based)
- Indicator 4C.4: Total food supply available for human consumption globally
Sub-outcome 4A: Scotland's food and drink businesses (including farming businesses) are prosperous, diverse and innovative
Scotland’s food and drink businesses[133] have faced a challenging economic climate in recent years. A series of economic shocks — notably Brexit-related trade barriers, pandemic-related supply chain disruptions, and the surge in energy and input costs following Russia’s invasion of Ukraine — have not only constrained business resilience but also contributed to the wider Cost of Living Crisis, which in turn has suppressed domestic demand for premium food and drink products. Consequently, there has been a marked deterioration in some of the headline indicators under this sub-outcome as a result.
The sector has faced rising production costs (such as energy, raw materials, and packaging costs) which have put pressure on profit margins.[134] Headline inflation has also been consistently above the Bank of England’s target since mid-2021, impacting on consumer confidence and spending and business investment. The Bank of England’s latest monetary report[135] highlights that both international factors - such as higher global agricultural prices[136] - and domestic factors are driving inflation. Domestic factors include higher wage growth (linked to higher proportions of the workforce being paid the National Living Wage) and the UK Government’s increase to Employer National Insurance Contributions in autumn last year which has added additional financial burden on businesses[137] and, in part, has been passed onto consumers in higher prices. Scottish Government analysis of the impact of this change showed that the Food and Accommodation sector would see a disproportionate rise in total costs as a result of this measure, with total costs rising by 1.7% on average (£15,500 per business).[138]
Recent data suggest a decline in UK food retail sales volume, with retail sales of food across the UK, in volume terms down 2.0% in October 2025 compared to the same month last year and 9.9% below 2019 levels.[139] Rising food prices in recent years have reduced purchasing volumes even as total spending has increased, suggesting households may be changing their behaviour when it comes to food purchases. Many Scottish food industries have also seen lower volumes of exports to the EU - including a 68% fall in fruit and vegetable exports and 34% fall in meat exports in 2024, compared to 2020.[140] This is reflected in the additional complexity associated with exports to the EU since Brexit. In March 2022, approximately 17% of businesses in the food and beverage sector reported changes to supply chains due to the end of the EU transition period, compared with 7% across all sectors.[141]
Whilst the sector has faced challenges in recent years and is likely to continue to experience headwinds, there are more positive developments which could ease pressures. For example, the UK and EU agreed in a Common Understanding Document[142] to work towards a Sanitary and Phytosanitary Veterinary Agreement. If agreed this could result in the vast majority of movements of animals, animal products, plants, and plant products between Great Britain and the European Union being undertaken without many of the certificates or controls that are currently required post-Brexit.
Indicator 4A.1: Real Gross Value Added (GVA) of the food and drink Sector
Headline 4A.1: Following the Covid-19 pandemic, real economic output from the food and drink sector (as measured by Real GVA) contracted sharply in 2023. Although 2024 showed some recovery, recent data indicates the s ector is contracting again in 2025.
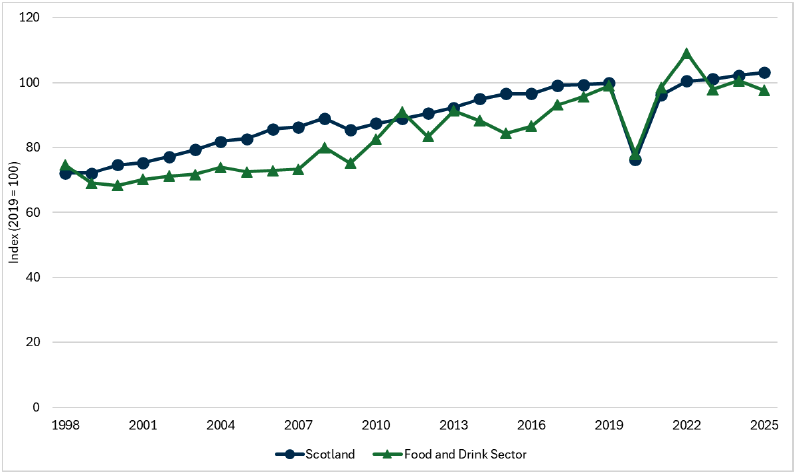
Source: Scottish Government, Industry Statistics Database
Baseline 4A.1: The latest GDP data (Q2 2025) shows that output in the food and drink sector decreased by 2.9% compared with the same quarter in the previous year (Q2 2024). This compared to overall GDP growth of 0.9% over the same period. A baseline for indicator 4A.1 will be set when all 2025 data is available.
Change in real gross domestic product (real GDP) is the main indicator of economic growth in Scotland, and Gross Value Added (GVA) at constant prices is therefore a key indicator of real economic growth in the food and drink sector within Scotland. In 2020, GVA in the sector fell sharply - in line with the whole economy - during the Covid-19 pandemic. After a strong re-bound in 2022, GVA in the sector has shown signs of contraction in recent years. The latest GVA data show that output in the food and drink sector decreased by 1.7% in the most recent quarter (Q2 2025), compared with output across the economy estimated to have grown by 0.2%.
As at Q2 2025, the food and drink sector was 2.4% smaller than it was in 2019. Declines were seen in the Manufacturing sector overall (-1.4%), and in Wholesale and retail trade sector (-5.9%). Generally, economic growth has been driven in Scotland by the Services sector.
Total turnover - a measure not adjusted for inflation - in the sector has increased from £14.7 million in 2020 to £18.9 million in 2023. The Scotland Food and Drink Industry Strategy set an ambition to grow turnover in the sector to £20 million by 2028.[144] The Scotland Food and Drink Partnership brings together industry, government and key agencies to support Scotland’s food and drink sector by coordinating strategy, helping businesses open up new markets, improving supply-chain resilience and championing sustainable growth.
Indicator 4A.2: The proportion of new food and drink businesses that survive after 1-5 years
Headline 4A.2: Recent data suggests a lower proportion of new businesses registered in 2022 in the food and drink sector continued to trade after one year compared to previous years; but the longer term picture is less clear.
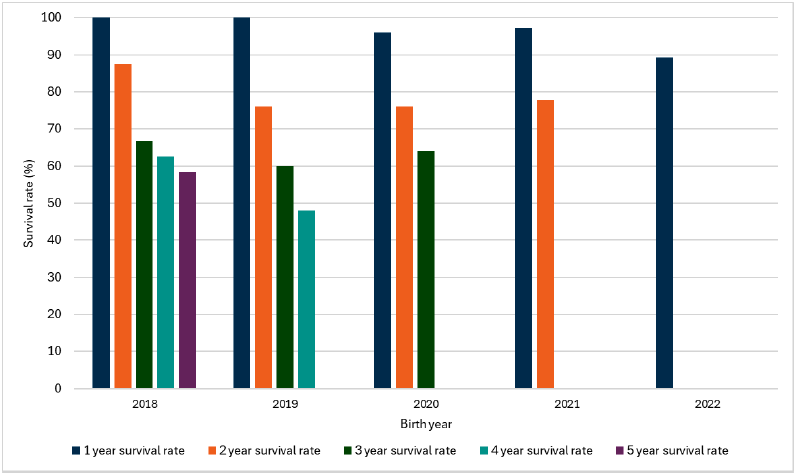
Source: Scottish Government, Industry Statistics Database
Baseline 4A.2: In the latest estimates for indicator 4A.2, 89.3% of businesses births in 2022 survived after 1 year, whilst the 5 year survival rate for business births in 2018 was 58.3%. A baseline for indicator 4A.2 will be set when 2025 data is available.
New business registrations (births) in the food and drink sector[145] can be viewed as providing a useful snapshot of resilience of the sector.[146] The data is based on businesses registered for VAT/PAYE. The survival rate(s) is calculated based on the number of new businesses registrations and the percentage of those that have survived into the current year. For example, for businesses that were registered in 2018, by the following year (2019) 100% remained active, but this falls to 58.3% in 2023.
An alternative measure of business resilience in the food and drink sector can be sourced from Insolvency Statistics.[147] The number of company insolvencies in the food and drink manufacturing, agriculture and fishing industries in Scotland stood at around 11 per year between 2015 and 2020. This has increased to an average of 29 between 2021 and 2024.
Indicator 4A.3: The percentage of businesses in the food and drink sector that are innovation active
Headline 4A.3: Food and drink businesses are more ‘innovation-active’ than businesses generally, but their innovation activity declined in 2020-22.
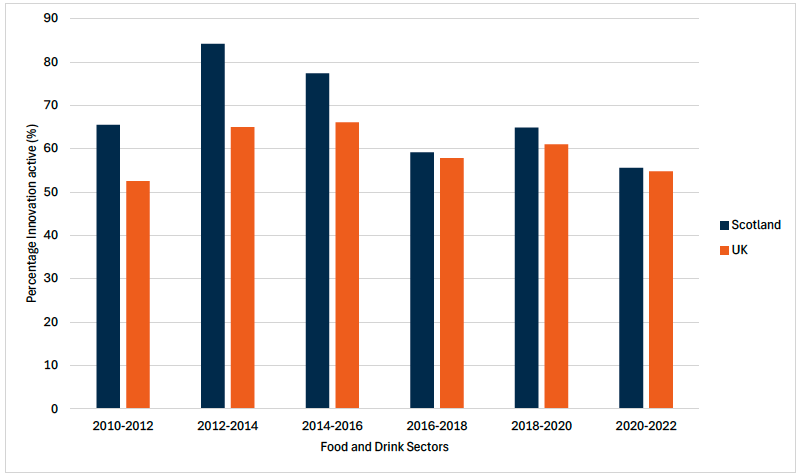
Source: Scottish Government, UK Innovation Survey 2023
Baseline 4A.3: The latest data available for indicator 4A.3 finds that 55.6% of businesses were innovation active within the food and drink sector in Scotland in 2020-22. A baseline for indicator 4A.3 will be set when 2022-24 data is available.
Innovation active businesses, defined in the UK Innovation Survey, are those that are engaged in any of the following activities: the introduction of a new or improved product (goods or services); business processes used to produce or supply all goods or services that the business has introduced, regardless of their origin (these innovations may be new to business or new to the market); and/or innovation projects not yet complete or abandoned.
Food and drink businesses (excludes agriculture and fishing) were found to be more ‘innovation-active’ than businesses generally, but their innovation activity declined in 2020-22. Innovation rates declined for most sectors in 2020-22, primarily due to COVID-19 challenges and rising energy costs. A higher proportion of businesses in the sector reported being innovation active in 2012-2014 and 2016-2018, with higher rates compared to the sector across the UK as a whole.
Indicator 4A.4: Average Farm Business Income (with and without subsidy)
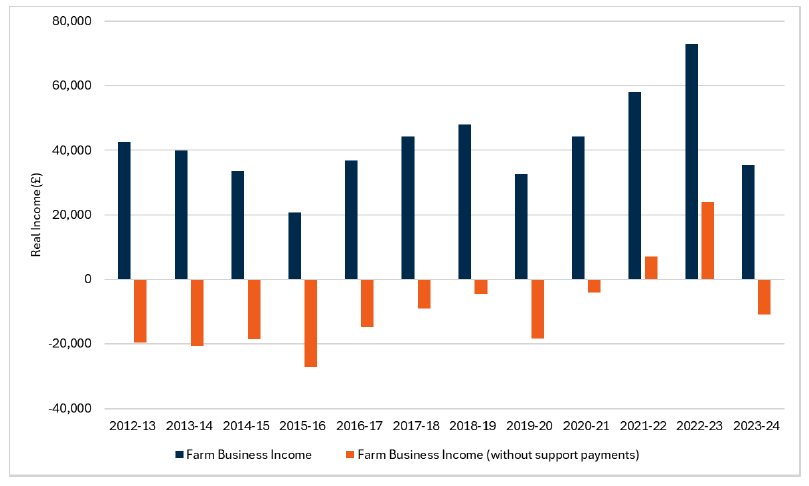
Headline 4A.4: After record high values in 2022-23, average farm income in 2023-24 was the lowest estimated since 2019-20 (after adjusting for inflation).
Source: Scottish Government, Scottish Farm Business Income
Baseline 4A.4: The latest data for indicator 4A.4 reports that average farm income in 2023-24 was around £35,500, whilst average farm income without support was -£11,000. A baseline for indicator 4A.4 will be set when 2024-25 data is available.
After record high values in 2022-23, average farm income in 2023-24 was the lowest estimated since 2019-20 (after adjusting for inflation). Over the past decade, average farm income has fluctuated between £20,800 in 2015-16, where low milk prices and fall in support payments resulted in record lowest profits, to £72,900 in 2022-23.
Average farm income varies by farm type. For example, the average income of dairy farms, cereal farms and lowland cattle and sheep farms in 2022-23 was £116,300, £38,900 and £2,600 respectively. Business performance varies within farm types as well. There are loss-making and high income farms in most farm types. In 2022-23, 27% of farms were loss-making and 13% made more than £100,000. Further information on farm profitability and the methodology used to produce these estimates is published.[148]
Sub-outcome 4B. Scotland's food and drink sector creates and sustains fair and diverse employment
The food and drink sector employs around 123,000 people accounting for 4.6% of employment in Scotland. It is a significant employer in many remote and economically fragile rural and island communities. The majority of this workforce is in the agricultural sector 65,000 (53%), with 32,000 (26%) in food manufacturing, 15,000 (12%) in beverage manufacturing and 11,000 (9%) in fishing and aquaculture. The proportion of the workforce in food and drink manufacturing was high in Moray (7.8%) and Aberdeenshire (4.9%) compared to the national average (1.7%). The proportion of the workforce in agriculture and fishing and aquaculture, was highest in the Shetland Islands (9.6%), Orkney (9.3%), Angus (9.2%) and Na h-Eileanan Siar (7.6%).
Median pay in the food and drink sector has been historically below the median across all sectors of the economy, and below the median for general manufacturing. The Food and Drink Manufacturing and Primary Production workforce was also estimated to have a lower proportion of the workforce educated to Higher Education levels (SCQF[149] Level 7 and above), and a higher proportion educated to SCQF Levels 5 and 6 compared to Scotland overall[150]. There is more limited evidence and data on the characteristics of the workforce generally in the food and drink sector in terms of equality and diversity.[151] There are particular issues in some parts of the sector - particularly agriculture - where the average-age of working occupiers of farms were 45 years and over.[152]
The indicators under this sub-outcome measure the average earnings of those employed in the sector (and how this compares to the overall average earnings across all sectors), apprenticeship starts in the sector and estimates of fairness in the sector - as measured by the Gender Pay Gap. There was limited data available to monitor other aspects of employment within the sector (for example diversity).
Indicator 4B.1: Median Earnings in the food and drink sector
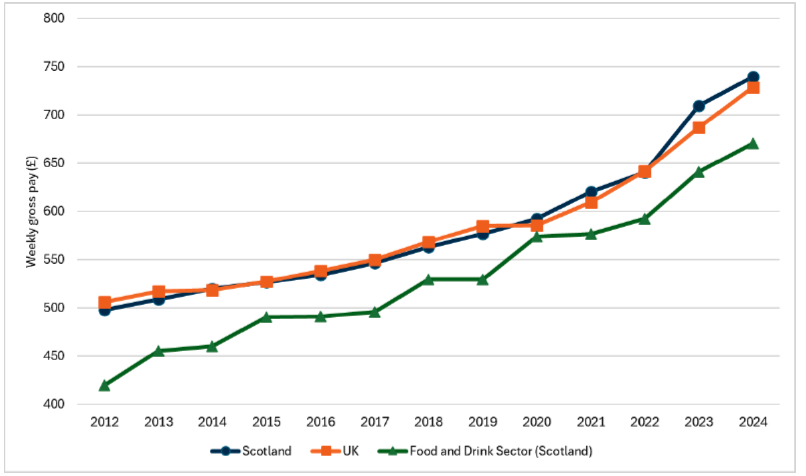
Headline 4B.1: Median pay in the food and drink sector has increased at a similar rate to the average across all sectors in recent years. However, overall pay levels in the sector remain below the all-sector median.
Source: Scottish Government, Industry Statistics Database
Baseline 4B.1: The latest data for indicator 4B.1 reports that median weekly gross pay in 2024 for full-time employees in the food and drink sector was £670.70 per week. This was equivalent to 91% of the median across all sectors. A baseline for indicator 4B.1 will be set when 2025 data is available.
As reported in the Annual Survey of Hours and Earnings, median pay in the food and drink sector has grown broadly in line with pay across all sectors in recent years. It is 9% lower than the median weekly pay across all sectors. The narrowing of the difference in median pay in 2020 (where pay in the food and drinks sector was 3% below the median) should be treated with caution due to short-term changes in the composition of employment and hours and pay in this period as well as reduced sample quality and therefore should be treated with caution.
Indicator 4B.2 Number of Modern Apprenticeship starts in the food and drink sector
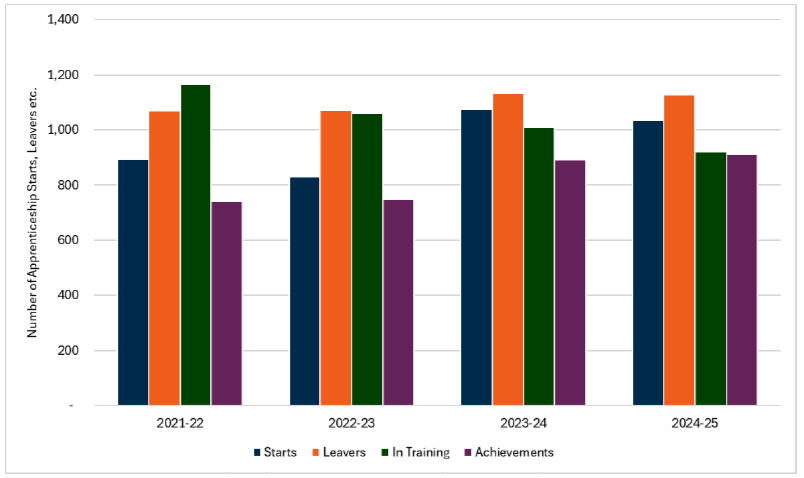
Headline 4B.2: The number of Modern Apprenticeship starts and ‘achievements’ in the food and drink sector has increased over time from 2021-22 to 2024-25.
Source: Skills Development Scotland, Modern Apprenticeship Data
Baseline 4B.2: The latest data for indicator 4B.2 finds that in the food and drink sector in 2024/25 there were 1,036 Modern Apprenticeship starts made, 921 in training and an achievement rate of 80.8%. This forms the baseline for indicator 4B.2.
Modern Apprenticeships in the food and drink sector in Scotland helps support employed individuals (either new or existing) to secure industry-recognised qualifications. In 2024/25, there were 1,036 Modern Apprenticeship starts made (down 3.6% from 2023/24) in the food and drink sector and 921 Modern Apprentices in training (down 8.8% from 2023/24). For apprenticeships completed in 2024/25 in food and drink, there was an achievement rate of 80.8% (up from 78.9% in 2023/24).
Skills Development Scotland also publish ‘sectoral skills assessments’ for the food and drink sector[153],[154] which includes some further data on Modern Apprenticeships and other characteristics of the workforce.
Indicator 4B.3: Gender Pay Gap for full-time employees in the food manufacturing sector
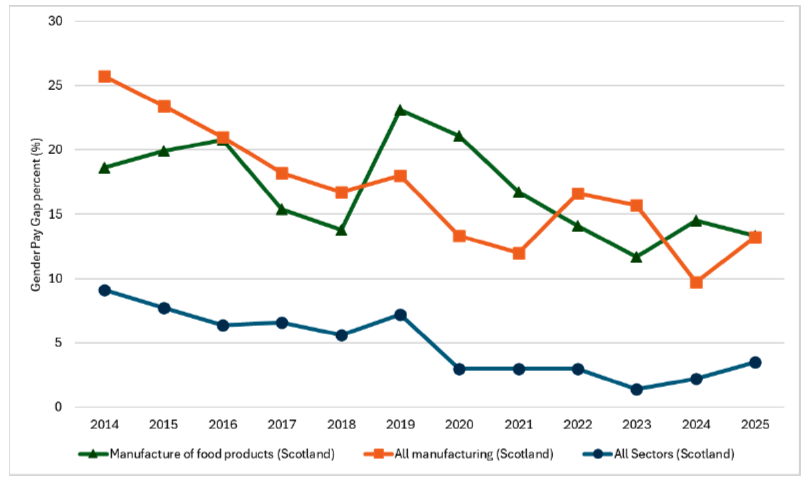
Headline 4B.3: The Gender Pay Gap for Median Gross Hourly earnings (excluding overtime) in the Food Manufacturing sector has narrowed over time, but remains consistently higher than the Gender Pay Gap across all industries and services.
Source: Office for National Statistics, Gender pay gap
Baseline 4B.3: The Gender Pay Gap for Median Gross Hourly earnings (excluding overtime) for full-time employees in the manufacture of food products sector was 13.3% in 2025. This compared to a gender pay gap of 13.2% in all manufacturing overall and 3.5% in all industries and services in Scotland.
The Gender Pay Gap[155] in the Food Manufacturing sector has been consistently higher than for all industries and services overall in Scotland. To note, reliable data for other parts of the food and drink sector were not available.
There is limited evidence available on inclusion and diversity within employers in the food and drink sector in the UK. A recent report by the Food and Drink Federation - based on data collected from 200 companies - found the sector is marginally behind the UK economy average in key inclusion and diversity metrics, including female representation at board and executive committee level, and LGBTQ+ representation.[156] The report also found a significant number of companies did not have a coordinated inclusion and diversity strategy; and among those that did, most focused on gender rather than other dimensions such as ethnicity, disability or sexuality
Sub-outcome 4C: Scotland's food system remains secure and resilient
Scotland’s resilience to acute food security challenges depends on maintaining a diverse and balanced supply base, avoiding single points of failure across domestic and international supply chains. The domestic food and drink sector plays a central role—producing food for consumption in Scotland and contributing to economic resilience through exports. At the same time, Scotland’s strong trade relationships are important: imports ensure year-round availability and diversity of food, including products such as citrus, and help prevent over-reliance on any single country of origin.
Assessing the resilience of Scotland’s food system is inherently complex. It reflects Scotland’s participation in the wider UK internal market for food, variations between product types, and the complexity and large number of actors involved in the supply chain - 98.7 % of registered food and drink enterprises in Scotland are small businesses (0-49 employees). It also depends on external factors including energy costs, input availability, and global transport and logistics.
The UK Food Security Report 2024[157] provides a UK-wide evidence base for understanding the drivers and current status of food security. For the national Good Food Nation Plan, we draw upon several of its high-level indicators, supplemented with Scotland-specific measures to reflect our distinct production patterns, trade profile, and resilience considerations.
While the four indicators under this outcome focus primarily on the balance between domestic production and imports, broader dimensions are also important for understanding food system resilience. These include the stability of supply, cost and availability of critical inputs (such as energy, feed, and fertiliser), nutritional adequacy, and the robustness of logistics and infrastructure. This is list is not exhaustive but factors like these also influence Scotland’s overall ability to maintain a secure, sustainable, and resilient food system.
Indicator 4C.1: UK food production to supply ratio (value based)
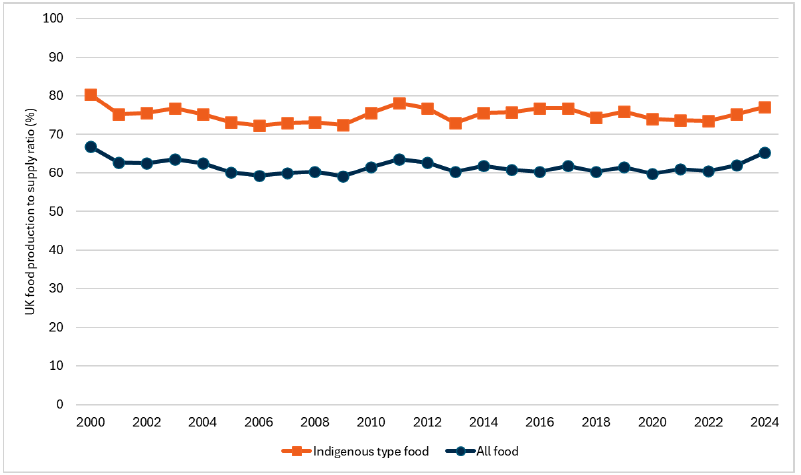
Headline 4C.1: The UK’s overall balance of international trade and domestic production of food remains broadly stable. The UK continues to source food from domestic production and trade at around an overall 65:35 ratio.
Source: Department for Environment, Food and Rural Affairs, Agriculture in the United Kingdom
Baseline 4C.1: The production-to-supply ratio was at 65% for all food and 77% for indigenous foods (meaning those that can be grown in the UK) in 2024. This is the latest data for indicator 4C.1. A baseline for indicator 4C.1 will be set when 2025 data is available.
The UK’s balance of trade and domestic food production has remained broadly stable in recent years, with roughly 65% of food (by value) supplied from domestic production and 35% from trade. This ratio - calculated as the farm-gate value of all food produced in the UK divided by the value of total food available for consumption - has levelled off at around 60% in recent decades, following a decline from over 80% in the 1980s. The equivalent ratio for indigenous food types follows a similar pattern but remains consistently a few percentage points higher.
As Scotland operates within the UK’s internal food market, this ratio offers a useful high-level indicator of the UK’s exposure to international market volatility and the balance between home-grown and imported food. However, it should not be interpreted as a direct measure of food security. Because it is value-based, the ratio is sensitive to price movements rather than physical quantities of food. For example, if domestic food prices rise faster than import prices, the ratio may increase—even if the UK is importing a larger share of food in volume terms. Similarly, high-value but low-volume exports such as Scottish salmon and whisky can inflate the value of domestic production, masking the relative importance of lower-value but nutritionally essential foods like cereals (wheat for breadmaking), vegetables (tomatoes and leafy greens) and pulses. It is also important to note the sectoral variation concealed by the average.
Indicator 4C.2: Total agricultural land area used to produce fruit and vegetables for human consumption
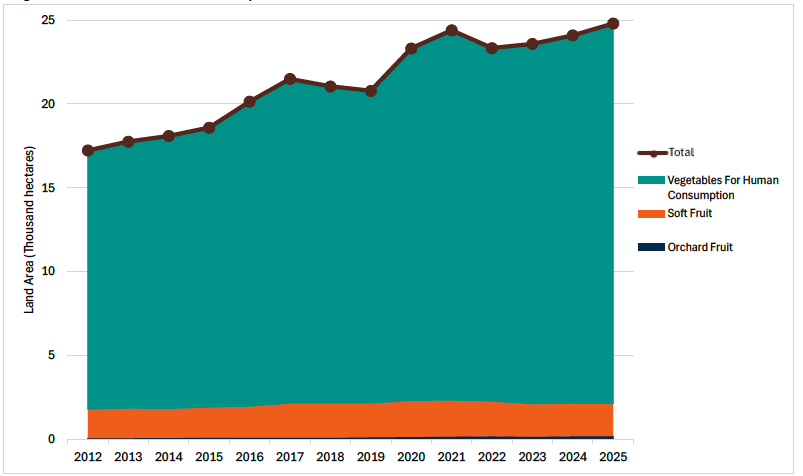
Headline 4C.2: The area of land in Scotland that is cultivated for fruit and vegetable production has increased by around one third (+33.4%) in the past 10 years, but represents only 0.5% of total agricultural land.
Figure 44: Indicator 4C.2 Total agricultural land area used to produce fruit and vegetables for human consumption
Source: Scottish Government, Scottish Agricultural Census: results
Baseline 4C.2: The latest data for indicator 4C.2 is that 24,799 hectares is the total land area used for growing soft fruits, orchard fruits and vegetables for human consumption in 2025.
Scotland (and the UK) continue to be highly dependent on imports to meet consumer demand for fruit and vegetables, which are significant sources of micronutrients for consumers. Scotland has relatively little prime agricultural land which would be suitable for growing fruit and vegetable crops. The Macaulay Land Capability for Agriculture classification system classifies only around 7% of Scotland with land in class 1-3.1[158], would be potentially suitable for fruit and vegetable production. Research funded by Scottish Government is looking at understanding the means, barriers and drivers for increasing the production and use of Scotland’s fruit and vegetables.[159] The Fruit and Vegetable Aid Scheme (FVAS)[160] also provides aid to groups of fruit and vegetable growers, recognised as Producer Organisations (POs), to encourage them to work collaboratively and increase the quality and quantity of the produce they grow.
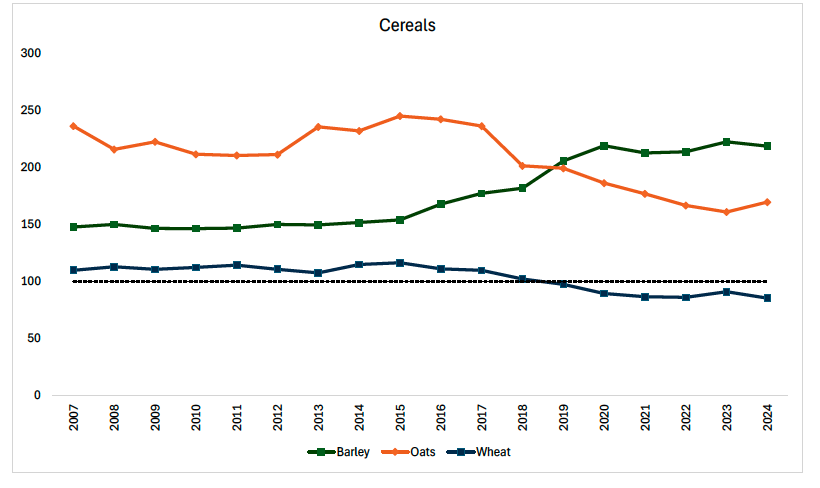
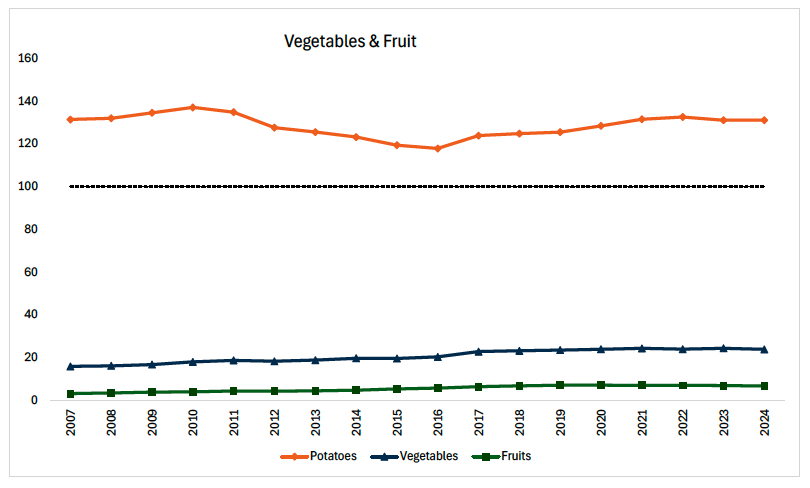
Indicator 4C.3: Scottish production to supply ratios for key food commodities (volume based)
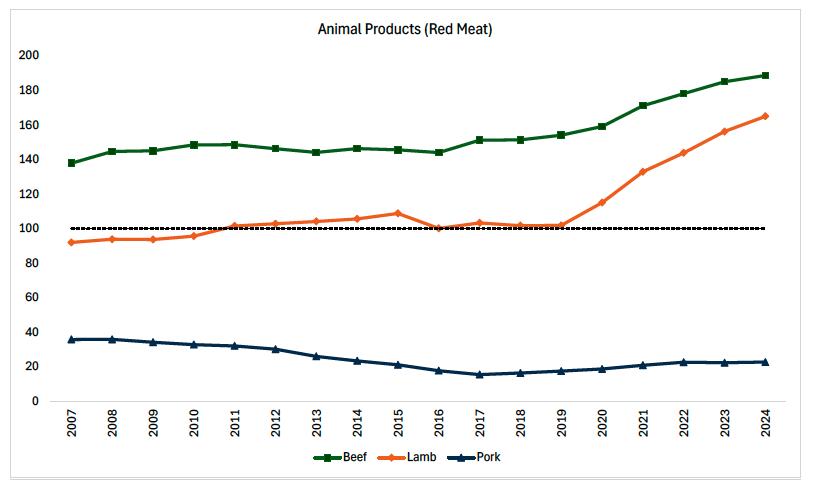
Headline 4C.3: After accounting for annual variations, Scotland produces more than it consumes across a range of agricultural commodities. Scotland is a net exporter of fish, cereals (barley and oats), potatoes, beef, dairy and eggs. Scotland is a net importer of pork, fruits and vegetables.
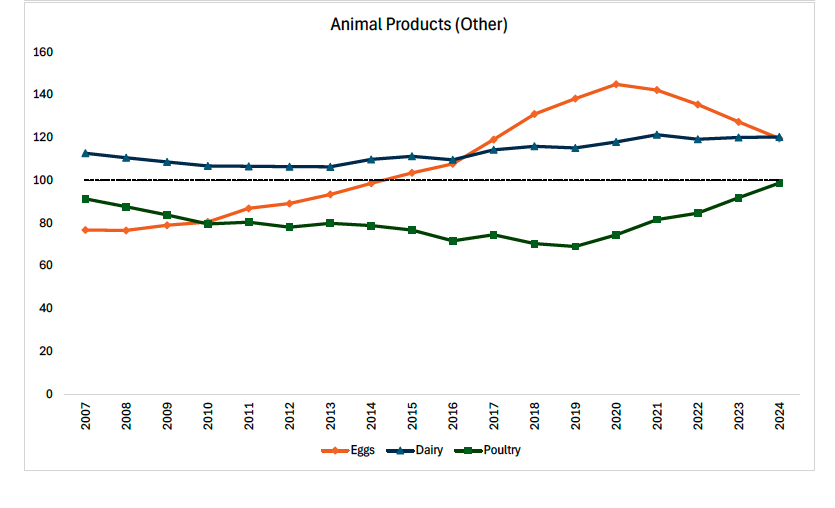
Baseline 4C.3: For indicator 4C.3, average self-sufficiency ratios across each commodity has been calculated from 2003 to 2024.[161] Annual data is presented as a 5-year average - to account for any annual variability in agricultural production, for example. The 5-year average in 2024 will be a baseline for future monitoring.
Indicator 4C.1 provides a broad overview of the UK’s production-to-supply ratio across all foods, based on value metrics. To complement this, and drawing on research funded through the Scottish Government’s Strategic Research Programme, a new measure of Scotland’s production relative to supply across key food commodities is also used as an indicator under this sub-outcome. Unlike the UK indicator, these measures are volume-based, offering a clearer picture of the balance between the total volume of food produced in Scotland and the volume consumed across different commodities.[162] The ratios follow the UN FAO’s food balance sheet methodology[163] and combine production data from the Scottish Government’s June Agricultural Survey[164] with consumption estimates from Defra’s Family Food Survey.[165]
Both domestic production and trade play vital roles in maintaining food security. Imports can mitigate the risks of local production shocks, yet excessive reliance on imports—particularly from a small number of countries—may expose the food system to external market or geopolitical vulnerabilities.
As illustrated in Figure 45, Scotland produces a surplus of barley and oats, and approximately balances wheat production with domestic demand. In contrast, consistent with findings from the UK Food Security Report, Scotland remains highly import-dependent for fruit and vegetables, though potato production meets domestic needs. For animal products, production exceeds consumption for lamb, beef, dairy and eggs, while pork remains import reliant. In the fisheries sector, production from landings and aquaculture exceeds domestic supply by roughly a factor of ten—reflecting the importance of fish and shellfish exports to Scotland’s food economy.
When interpreting this indicator, it is important to recognise its limitations. The ratio measures aggregate farm-gate production against estimated food purchases and does not account for product quality, processing suitability, or end use. For example, much of Scotland’s wheat is unsuitable for breadmaking due to climatic constraints and is therefore used primarily as animal feed, while higher-quality bread wheat is imported. This highlights that high production volumes do not necessarily equate to self-sufficiency in the foods most critical for household consumption.
Indicator 4C.4: Total food supply available for human consumption globally
Headline 4C.4: Over the long-term global food production has continued to grow and keep up with population growth.
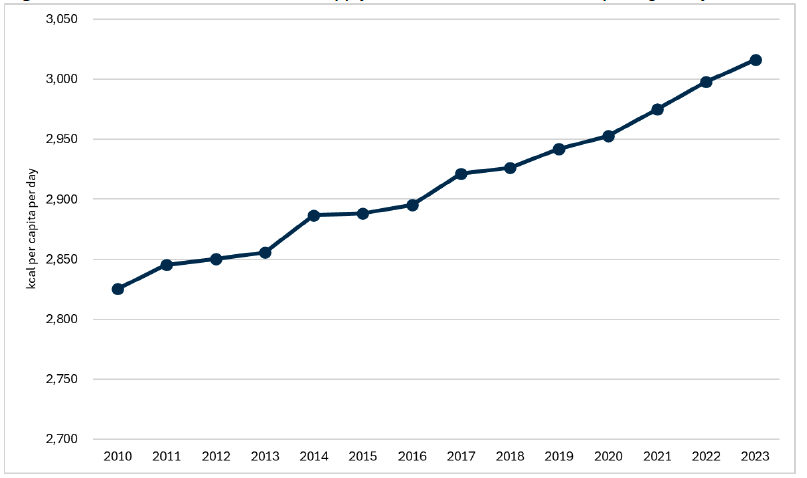
Source: Food and Agriculture Organization of the United Nations, Food Balances
Baseline 4C.4: Total food supply available for human consumption was 3,016 kilocalories per person per day in 2023, increasing by 74 calories from 2019. This is the latest data for indicator 4C.4. A baseline for indicator 4C.4 will be set when 2025 data is available.
Given Scotland’s integration within global agri-food markets, it is important to complement national indicators of food production and trade with a measure of total global food supply available for human consumption. This indicator provides a high-level view of whether global agricultural production is keeping pace with population growth and global calorie requirements.
Monitoring global food availability helps assess systemic risks that may affect Scotland’s food security indirectly through international supply chains. If global food supply tightens relative to demand—for example, due to climate shocks, conflict, or trade disruptions—partially import-dependent nations such as the UK and Scotland become more exposed to price volatility, competition for key commodities, and potential export restrictions from major producing countries.
Broadly, this indicator shows that food production has continued to grow and keep up with population growth. This means there is enough food in the world in terms of volume and dietary energy supply to meet global population needs. This is in line with the broad conclusions set out in the UK Food Security Report 2024.
Contact
Email: resasfoodresearch@gov.scot