Good Food Nation plan: initial monitoring framework
The first monitoring framework for the national Good Food Nation Plan establishes a baseline for evaluating Scotland’s food system. It sets out 51 high-level indicators used to monitor progress towards the six overarching outcomes outlined in the national Good Food Nation Plan.
3. Outcome 1: A better food environment
Outcome 1: The food environment in Scotland enables people to eat well. Everyone benefits from reliable and dignified access to safe, nutritious, affordable, enjoyable, sustainable and age-appropriate food.
Summary of Outcome 1 Indicators
Outcome 1 indicators are structured around three sub-outcomes. The first sub-outcome focusses on indicators of food affordability, as well as access and nutrition. These indicators are drawn from official inflation data for food, estimates of the prevalence of household food insecurity in Scotland, estimates of the uptake of meals provided in schools (both free and paid for) and breastfeeding drop off rates. The second sub-outcome focusses on the safety of foods available in Scotland - drawing upon measures of perceived safety of food in Scotland (as measured by trust in the regulator), and regulatory activities that monitor food safety (the proportion of premises that pass food hygiene inspections and the number of food samples tested by local authorities for food hygiene/authenticity reasons). The final sub-outcome relates to ‘sustainable’ food actions and creating food environments conducive to good health. We acknowledge there are data gaps around understanding ‘food environments’ as well as age and culturally appropriate food under this outcome.
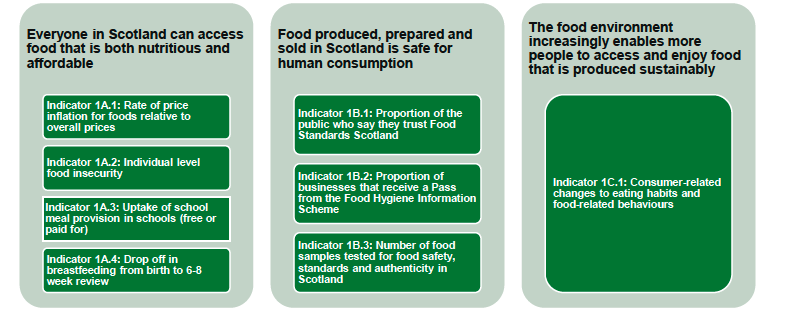
Everyone in Scotland can access food that is both nutritious and affordable
- Indicator 1A.1: Rate of price inflation for foods relative to overall prices Indicator
- 1A.2: Individual level food insecurity Indicator
- 1A.3: Uptake of school meal provision in schools (free or paid for) Indicator
- 1A.4: Drop off in breastfeeding from birth to 6-8 week review
Food produced, prepared and sold in Scotland is safe for human consumption
- Indicator 1B.1: Proportion of the public who say they trust Food Standards Scotland
- Indicator 1B.2: Proportion of businesses that receive a Pass from the Food Hygiene Information Scheme
- Indicator 1B.3: Number of food samples tested for food safety, standards and authenticity in Scotland
The food environment increasingly enables more people to access and enjoy food that is produced sustainably
- Indicator 1C.1: Consumer-related changes to eating habits and food-related behaviours
Sub-outcome 1A: Everyone in Scotland can access food that is both nutritious and affordable
As stated in the Plan, a key aim is to shift the dial and create a food system in Scotland that enables and promotes a healthy population. The cost and relative price of different foods is an important driver of consumer behaviour with respect to food choices.[7] Access to affordable food is also essential to maintaining a reasonable standard of living and reducing food insecurity in our communities.
The cost of food is one important element of the overall cost of living for households, which in turn is one of the three key drivers of child poverty in our society (alongside income from employment and income from social security and benefits in kind).[8] Whilst it is recognised that there is considerable overlap between tackling child poverty and the national Good Food Nation Plan outcomes, we have not duplicated on-going monitoring work set out in Child Poverty progress reports within the indicator framework for the Plan.[9] Local authorities and Health Boards also publish data at a local level within respective Local Child Poverty Action Reports.[10]
Food price inflation disproportionately impacts low-income households who spend a greater proportion of their income on food and essentials. The average UK household spends around 11.3% of their expenditure on household food and non-alcoholic drink. This increases to 14.3% for the lowest fifth of households by equivalised income.[11] Food is the fifth highest expenditure item for the average household, after ‘housing, fuel and power’, ‘transport’, ‘other expenditure items’ and ‘recreation and culture’.
There have also been concerns that remote rural communities are particularly affected by higher food prices in comparison with average prices or prices in urban areas. This may be because of higher transportation costs or even the possibility that retailers may have a degree of spatial market power. There is some limited evidence that consumers in rural areas do pay more for their food basket than they would pay at average prices.[12]
Whilst the market price for different foods are influenced by a range of factors, from global market dynamics and weather patterns, to significant supply chain shocks such as Brexit, the COVID-19 pandemic, and the war in Ukraine, ultimately, a food system that delivers higher prices for ‘healthier foods’ will impede progress towards meeting the Good Food Nation outcomes.
By categorising foods using the Eatwell Guide[13] categories, independent analysis of UK food price data suggests that more healthy foods in the UK can cost more than twice as much as less healthy foods, on a £ per calorie basis.[14],[15] The connection between price promotions and the current over-consumption of unhealthy discretionary foods that are high in fat, salt and sugar in the Scottish diet is also recognised.[16] As set out in the Plan, the Scottish Government intends to legislate to restrict the promotion of food and drink that is high in fat, sugar or salt where they are sold to the public.[17]
Indicators for sub-outcome 1A are based on a high-level assessment of the affordability of food, firstly through a measure of food prices relative to general prices as captured by the Consumer Price Index (CPIH), and secondly, through monitoring the proportion of households in Scotland that experience food insecurity as reported in the Scottish Health Survey. We also capture within this sub-outcome the uptake of free school meals within Scottish schools, as captured in the School Meal Uptake Statistics. Finally, an indicator has also been added to the framework to understand whether or not babies and young children are getting access to the healthy nutritious food that meets their needs, which aligns with ‘age-appropriate food’ within this Outcome and the stretch aim re-iterated in the Good Food Nation Plan that breastfeeding drop off rates at 6-8 weeks are reduced by 10% by 2025.
Indicator 1A.1: Rate of price inflation for foods relative to overall prices
Headline 1A.1: Following a period of relative stability from 2015 to 2021, food prices have become a major driver of overall inflation since 2022.
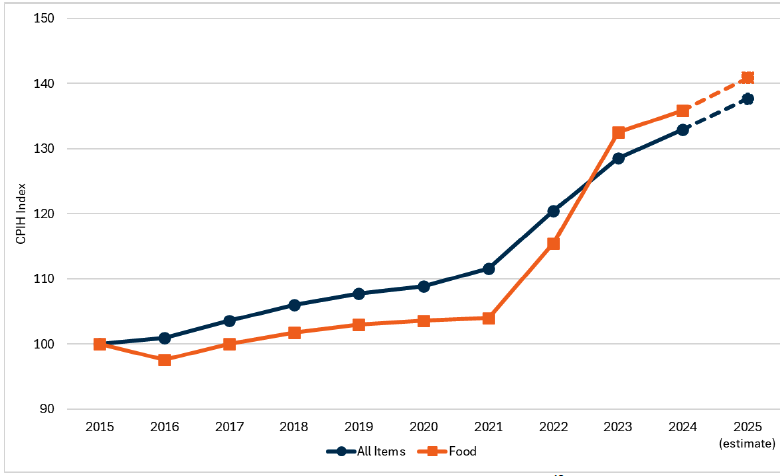
Source: Office for National Statistics, Consumer Price Index (CPIH)[18]
Baseline 1A.1: It is estimated that in 2025, when compared to 2015, food prices will have increased (+40.9%) by 3.2 percentage points more than overall consumer prices (+37.7%).
Tracking how food prices change relative to overall consumer prices provides insight into how quickly food costs are rising compared with general inflation.
This indicator is sourced from the Consumer Price Index (including owner occupier housing costs) data produced by the Office for National statistics. The indicator shows that between 2015 (the base year for the index) and 2025, overall food prices had risen by 40.9% according to the CPIH measure of inflation.[19] This compares to the overall CPIH, which increased by 37.7% over the same period. This means that food prices increased by 3.2 percentage points more than overall consumer prices over this period.
For most of this period (2015-2022), the CPIH index for food was lower than the overall CPIH index. This changed prior to 2023, as outlined in Figure 3, and coincided with the cost-of-living crisis that was, in part, triggered by Russia’s illegal invasion of Ukraine in February 2022.[20] This led to food prices rising rapidly, peaking at an annual inflation rate of 19.2% in March 2023. As shown in Figure 3, food prices jumped from being 7.6 percentage points lower than the overall CPIH price index to 3.9 percentage points above the overall CPIH price index in 2023.
The difference between the CPIH index for food and the overall index fell slightly from 3.9 percentage points in 2023 to 3 percentage points in 2024. For 2025, the difference is estimated to grow to 3.2 percentage points based on the first 10 months of data for 2025.
The Office for National Statistics (ONS) intend to transition the source of CPI food price data from traditional in-store field collection to data obtained from ‘grocery scanner data’.[21] Scanner data will have several benefits compared with current sources, including improved product coverage, accounting for price variations within a given month, improved geographic coverage and inclusion of more discount types (in-store loyalty cards). ONS will not revise previous consumer price statistics when grocery scanner data is introduced, however once this data is confirmed, it will change our indicator going-forward. We will reflect any changes in future monitoring of this indicator.
Indicator 1A.2: Individual level food insecurity
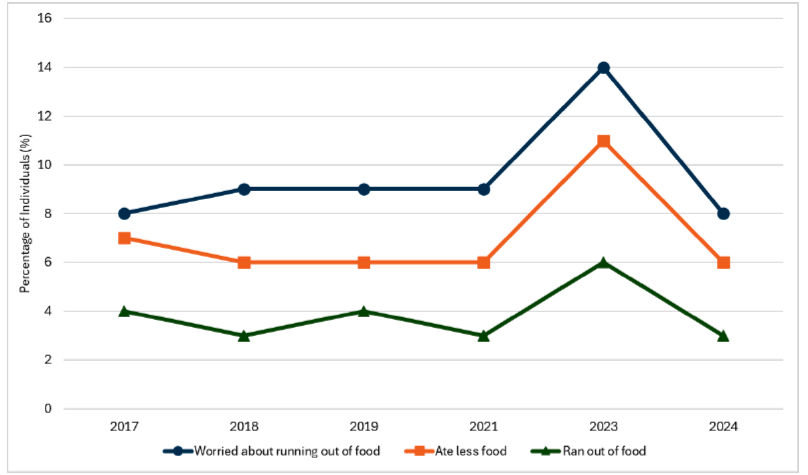
Headline 1A.2: Food insecurity reported by individuals increased significantly in 2023, but returned to previously recorded levels in 2024. Adults in single parent households were the most likely to experience food insecurity.
Source: Scottish Government, Scottish Health Survey 2024[22]
Baseline 1A.2: In 2024, 8% of adults were worried about running out of food, 6% of adults ate less food than they should have and 3% of adults ran out of food in the last 12 months. The baseline for indicator 1A.2 will be set when 2025 data is available.
Ensuring people can afford the food they need to stay healthy and happy is a cornerstone of the right to food and the outcomes of the Good Food Nation Plan. The Scottish Government defines food insecurity as the lack of access to enough or appropriate food due to a lack of resources. This includes a range of experiences, from worrying about affording food to skipping meals or compromising on quality and quantity due to financial pressures. This indicator, sourced from the Scottish Health survey, explores whether adults reported any food insecurity during the previous 12 months.
In 2024, 8% of individuals reported being worried about running out of food due to a lack of money or other resources in the last 12 months, 6% of individuals ate less food and 3% of individuals ran out of food. These figures were down from the series highs recorded in 2023 (14%, 11% and 6% respectively) and a return to the ranges previously recorded between 2017 and 2021. Food insecurity was highest among those aged 16-44, with 10% reporting they were worried about running out of food, 7% reporting they ate less and 5% reporting that they ran out of food, although these were the lowest recorded levels for this age group for those worried about running out of food and those who ate less. There was no significant variation by gender.
In terms of household composition in 2023/2024[23], food insecurity was highest among single parents, single adults and large families. In single parent households, over a third (36%) of adults were worried about running out of food, 27% ate less and 15% ran out of food. This compares to 21%, 18% and 13% respectively in single adults households and 19%, 15% and 7% respectively in large family households.
An alternative measure of food insecurity is sourced from the Family Resources Survey. For the period 2021-2024, this data showed that 16% of people lived in households which had marginal, low or very low food security.[24]
Some individuals that experience food insecurity seek assistance from food banks and other forms of food aid. The Scottish Government believe a Scotland without the need for food banks is possible - but getting there will take time, collective action and the right powers. Scotland was the first nation in the UK to publish a Cash-First Plan, grounded in human rights, that is taking forward nine actions between 2023 and 2026 to improve the response to crisis, using a cash-first approach so that fewer people need to turn to food parcels.[25] Stakeholders such as Trussell and the Independent Food Aid Network agree with this approach. Scotland has also published an Infant Food Insecurity Toolkit[26] that helps guide organisations to provide support appropriate to the needs of families with infants who have money worries, taking a cash first approach.
There are no official estimates of the scale and scope of food bank provision in Scotland, although data on both were collected by Urban Roots for the Scottish Government in 2019-20.[27] Independent research supported by the Scottish Government found that there were over 630 food support organisations operating in Scotland in 2023, operating through 1,008 outlets.[28] Trussell is the biggest food bank network in the UK, and operated from 143 locations in Scotland in 2024-25. The total number of food parcels distributed by food banks in the Trussell network in 2024-25 was 239,503. Although this represents a fall of 10% since 2023-24, the number of parcels was 3% higher than in 2019-20.[29]
Estimates of Food Insecurity are available at Health Board and Local Authority level.
Indicator 1A.3: Uptake of school meal provision in schools (free or paid for)
Headline 1A.3: The overall uptake rate of school meals (free and paid for) was up in 2023-2024, marking a return to pre-pandemic levels. Uptake of school meals is highest among pupils with universal entitlement to free meals compared to where free meal provision is means-tested.
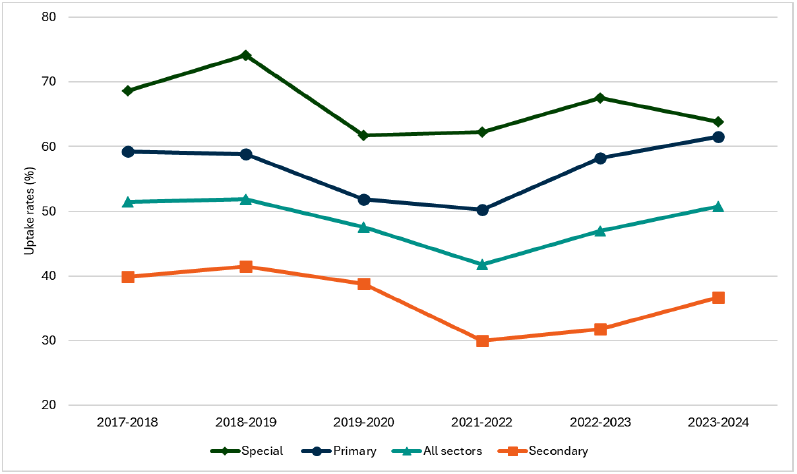
Source: Scottish Government, School meal uptake statistics, 2023-24[30]
Baseline 1A.3: The latest data reflects school meal uptake in 2023-24 - which was 50.8% across all schools. A baseline will be set when 2024-25 data is published.
Food provided in schools can make a valuable contribution to improving the nutritional quality of diets and promoting consistent messages about healthy eating. In Scotland, universal free school meals are available during school term-time for over 230,000 children in Primary 1 to 5 and special schools, as well as eligible pupils in Primary 6 to Secondary 6.[31]
Following public consultation, The Nutritional Requirements for Food and Drink in Schools (Scotland) Regulations 2020 were introduced. [32],[33] The Regulations are based on scientific evidence and dietary advice designed to ensure children and young people are provided with food, drink and meals that contain an appropriate amount of energy and key nutrients to support healthy growth and development. The Regulations are supported by Healthy Eating in Schools Guidance.[34]
There is also evidence that, where children and young people eat outside school, the food eaten is less healthy than what is eaten in school. Anecdotal evidence from families and schools consistently suggests that, over time, children and young people who eat in school become more willing to eat foods they would previously have refused.[35]
The uptake rate of all school meals (free and paid for) represents the average proportion of pupils in attendance at school that take a school meal over the financial year. The overall uptake rate for all school meals (free and paid for) across all school types was 50.8% in 2023-24, meaning an average of 50.8% of pupils attending school took a meal each school day over the course of the financial year. The uptake rate for all meals was up from 47.0% in 2022-23 and marks a return to pre-pandemic levels. The largest increase over the year was in secondary schools (31.8% to 36.7%), with a smaller increase in primary schools (58.2% to 61.5%). Breakdowns by local authority are available in the supplementary statistics.[36]
The Scottish Government’s expansion to 1,140 funded hours of Early Learning and Childcare (ELC) also introduced a universal entitlement to a free meal for all 3 and 4 year old children and eligible 2 year old children as part of their ELC day. This can be delivered as a breakfast, lunch or dinner and should be consistent with ‘Setting the Table’[37] nutritional standards and practical guidance for early years providers in Scotland. This approach ensures that children aged 0-5 years in childcare settings across Scotland are offered meals, snacks and drinks that meet their nutritional requirements and make a positive difference to their health and wellbeing. Baseline data on uptake are not currently available.
In addition to the ELC free meal the Scottish Government introduced the Scottish Milk and Healthy Snack Scheme (SMHSS) in 2021.[38] SMHSS is a universal preschool policy which provides funding for a daily portion of fruit/vegetable and a serving of milk or non-dairy alternative each day a child attends their regulated childcare setting for two hours or more, which has registered to participate in the Scheme. SMHSS is administered on behalf of Scottish Ministers by LAs who provide upfront payments to participating childcare settings. SMHSS is the only Scheme in the UK offering children a healthy snack of fruit or vegetables and a non-dairy alternative, in addition to milk. The Scheme promotes positive health outcomes for our youngest children through improved nutrition, embedding healthy eating habits from an early age. Data on the operation of the Scheme is collected by Local Authorities and the Care Inspectorate. Local Authorities provide evidence via 6 monthly reporting in both August and again in April on the number of registered settings and children as part of monitoring in line with the Milk and Healthy Snack Scheme (Scotland) Regulations 2021. The Care Inspectorate have included questions on the Scheme in their annual survey with childcare providers which also provides additional data of views on the Scheme from providers.
Indicator 1A.4: Drop off in breastfeeding from birth to 6-8 week review
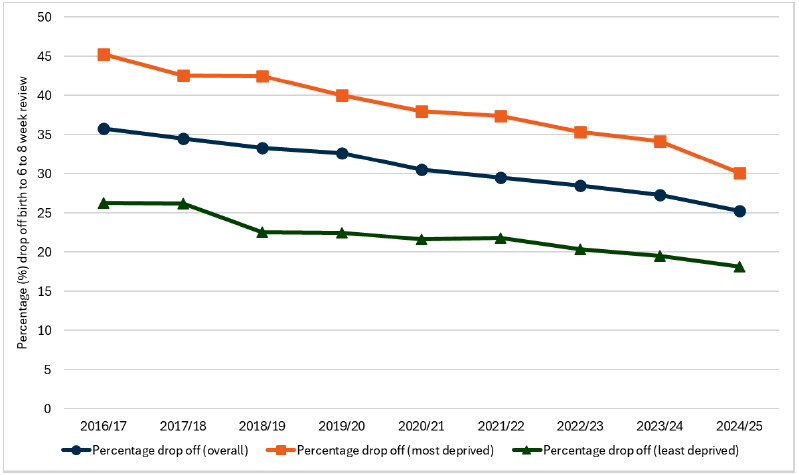
Headline 1A.4: The overall drop off in the proportion of mothers that continue breastfeeding from birth to 6-8 week review point has been declining, falling by 10.5 percentage points between 2016/17 (35.8%) and 2024/25 (25.3%).
Source: Public Health Scotland, Infant feeding statistics
Baseline 1A.4: In 2024/2025, the percentage drop off in breastfeeding from birth to 6-8 weeks was 25.3%. This is the lowest recorded drop off rate. Higher drop off rates are observed in the most deprived quintile.
Breastfeeding provides the best nutrition for babies and young children. It supports children’s health in the short and longer term, including through reduced risk of infections, and also benefits mothers’ health, including through reducing the risk of breast and ovarian cancer. The World Health Organisation (WHO) recommends that all ‘infants should be exclusively breastfed for the first six months of life to achieve optimal growth, development and health’.[39] Current guidance recommends that babies receive just breast milk for the first 6 months of life, then, after introduction of solid foods, should continue to breastfeed up to at least their second birthday.
The Scottish Government’s vision for breastfeeding and infant feeding was set out in a Framework[40] which outlines six strategic goals. The Framework re-iterates a “stretch aim” to reduce the drop off[41] in breastfeeding at the 6-8 week review by 10% by 2025, which was initially set out in the 2018 Diet and Healthy Weight Plan. This stretch aim will be refreshed to 2030 in the coming months.
Tracking infant feeding at key points — including the 6-8 week review — enables detection of where and when drop off in breastfeeding occurs, allowing targeted support to reduce inequalities and improve duration of breastfeeding. The reason this is an important stretch aim is because while initiation of breastfeeding may be relatively high, many mothers stop or substantially change how they feed by the 6-8 week point — supporting continuation out to that stage is critical to realising the health, developmental and equity benefits associated with longer-duration breastfeeding.
In 2024/25, of babies reviewed at 6-8 weeks, 34.3% were exclusively breastfed, 17% mixed breast and formula fed and 48.7% were exclusively formula fed.
In 2024/2025, the drop off rate in breastfeeding from birth to 6-8 week review was 25.3%. The drop off rate has been decreasing over time since 2016/2017 and this is the lowest the drop off rate has been in the time-series. The rate has fallen by more than 10 percentage points since 2016/17.
Increases in breastfeeding over the past 10 years have been greatest among those groups with historically lower rates, such as younger women and those living in more deprived areas. This means inequalities in breastfeeding have reduced over time. Further data on infant feeding - including data available at health board and local authority level - is published by Public Health Scotland.[42]
To improve access to healthy foods and milk, Best Start Foods provides pregnant women and families with children under the age of three who receive certain benefits with a minimum of £5.40 a week via a pre-paid card to buy these items. The payment doubles from birth until a child turns one to support breastfeeding mothers or help with the costs of providing first infant formula milk.[43]
Sub-outcome 1B: Food produced, prepared and sold in Scotland is safe for human consumption
As set out in the Good Food Nation Plan, the importance of an excellent food safety system in Scotland is critical in keeping the Scottish population safe when eating out, preparing food in the home or buying pre-packaged foods. Good hygiene practices also help to reduce demand on critical services within other health and social care settings. Published estimates suggest that around one-in-four people in the UK suffers an episode of infectious gastrointestinal disease each year and foodborne disease is estimated to cost the UK £10.4 billion annually (2022).[44] Foodborne pathogen surveillance in Scotland is conducted by Public Health Scotland, however this data has not been incorporated into the indicator framework (see below).
Food Standards Scotland (FSS) was established in 2015 as the new public sector food body for Scotland, to protect the health and wellbeing of consumers in relation to food. In relation to food safety this includes identifying and investigating risks to the food chain (food crime) and monitoring the regulatory approach to food law enforcement in Scotland. As reflected in the Food Standards Scotland 2021 - 2026 strategy, three of the five outcomes are that ‘Food is Safe and Authentic’, ‘Responsible Food Businesses are enabled to thrive’ and ‘FSS is trusted and influential’.[45] The indicators under this sub-outcome reflect these broad outcomes that align with the Good Food Nation Plan.[46]
On a practical level, Food Safety Officers and Environmental Health Officer roles within local authorities are vital in the inspection and enforcement of food hygiene standards across food production premises in Scotland and play a key role in preventing bad practice and ensuring compliance.
Indicators for sub-outcome 1B are based firstly on measures of consumer trust in the food they consume as captured by measures of public trust in Food Standards Scotland. Indicators are also based on measures of food safety enforcement, through the proportion of food businesses that receive a pass under the Food Hygiene Information Scheme and the number of food samples tested for food safety, standards and authenticity in Scotland.
Indicator 1B.1: Proportion of the public who say they trust Food Standards Scotland
Headline 1B.1: Consumer trust in Food Standards Scotland (FSS) has remained high and broadly stable. FSS plays a critical role in ensuring businesses comply with the legal standards that protect the safety and authenticity of our food.
Source: Food Standards Scotland, Food in Scotland Consumer Tracker Survey
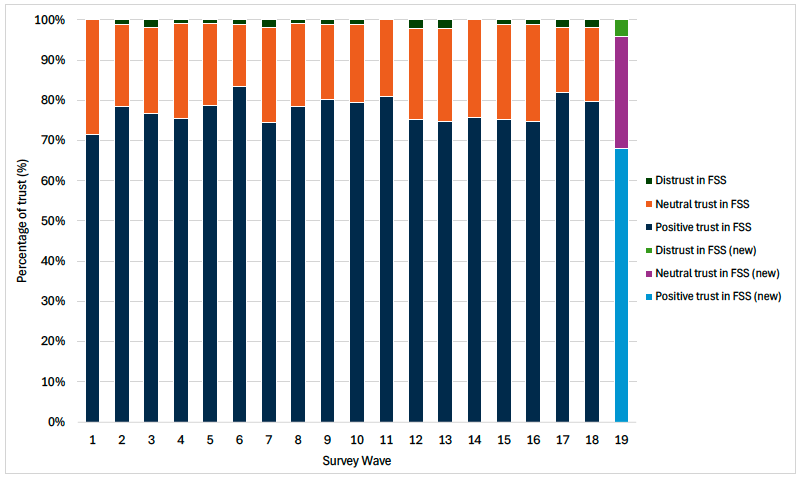
Baseline 1B.1: The latest data for indicator 1B.1 shows that the proportion of respondents with positive trust in FSS was 66%, as recorded in December 2024 (wave 19) of the Food in Scotland Consumer Tracker Survey. The baseline will be set for indicator 1B.1 when 2025 data is available.
Building trust in our system of food regulation in Scotland maintains public confidence and safeguards demand for Scotland’s food and drink products; protecting our economy and enabling consumers to make informed choices about the food they eat.
Indicator 1B.1 is sourced from the Food in Scotland Consumer Tracker Survey by Food Standards Scotland. In the most recent publication, wave 19, which was conducted in December 2024 and published in May 2025, questions were worded differently and therefore the data is not directly comparable to previous waves. In Figure 7, we can see that 66% of the public report positive trust in FSS, whilst only 4% report distrust.
Some external studies indicate that food is among the most trusted sectors. The 2025 Edelman Trust Barometer conducted across 28 countries reported that food was among the top 5 trusted sectors, with 73% of respondents trusting businesses in the food and beverage sector.[47] Similarly, in the UK, Red Tractor reported that despite the challenges of recent years, such as the cost-of-living crisis and international disruptions, trust in UK food has reached its highest level in three years. In 2024, 75% of UK adults trust food produced in the UK, outpacing trust in NHS care and tap water.[48]
Indicator 1B.2: Proportion of businesses that receive a Pass from the Food Hygiene Information Scheme
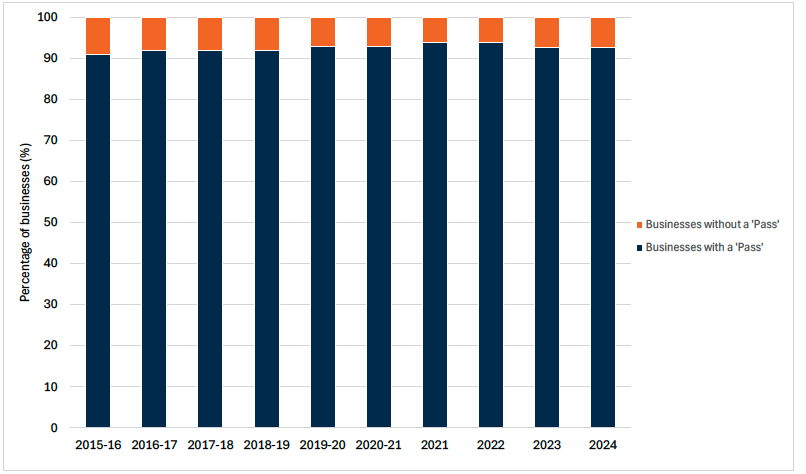
Headline 1B.2: All food businesses have a legal requirement to ensure the food they place on the market is safe. The percentage of businesses achieving a ‘Pass’ rating in the Food Hygiene Information Scheme (FHIS) has remained high, at over 90% since 2015-2016.
Source: Food Standards Agency and Food Standards Scotland, Our Food 2024 and Food Standards Scotland, Annual Report and Accounts [49]
Baseline 1B.2: The percentage of Scottish food businesses with a FHIS ‘Pass’ in 2024 was 92.6%. A baseline for indicator 1B.2 will be set when 2025 data is available.
All food businesses have a legal requirement to ensure the food they place on the market is safe. Compliance with regulatory standards ensures that hazards have been controlled and that good hygiene practice has been followed at all stages in the production process. Local authorities are responsible for enforcing compliance with food law for the vast majority of food businesses.[50]
The FHIS operates in Scotland and covers more than 54,000 food outlets across all 32 Scottish Local Authorities. Following an inspection by an Authorised Officer from the relevant Local Authority, food businesses are given a rating of either a ‘Pass’ or ‘Improvement Required’. Food businesses with a ‘Pass’ rating means that they have met the legal requirements for food hygiene, whilst businesses with an ‘Improvement Required’ rating didn’t meet this legal requirement upon inspection and need to make improvements. Businesses can also be rated as ‘Exempt’ meaning the business has been inspected by a Local Authority Food Officer and met the pass criteria but does not meet the criteria to be part of the scheme. Exempt businesses are usually considered low risk to people’s health in terms of food safety, for example, newsagents or chemists. New businesses or businesses under new ownership will not have a food hygiene rating and are labelled under ‘Awaiting Inspection’.
As shown in Figure 8, as of December 2024, 92.6% of businesses were rated as a ‘Pass’ on the FHIS. Although the proportion of businesses receiving a ‘Pass’ from the FHIS has remained over 90%, it has fallen from a high of 93.8% in 2021 and 2022.
All published food hygiene ratings under FHIS are based on the latest inspection of the food business carried out by Local Authority Officers. The frequency at which food businesses are inspected is based on their risk rating, which is defined by the Food Law Rating System (FLRS). Enforcing food hygiene relies on Local Authorities having sufficient capacity to carry out official control activity, such as inspections and audits, at the frequency required. At present, Local Authority resources remain under pressure with significant staffing vacancies across the country and officers struggling to address inspection backlogs.
It is important to note that of the 92.6% of food businesses with a ‘Pass’ rating, many of these will have been given during historic inspections, and the next programmed inspection(s) under the FLRS frequency have possibly been missed due to the issues facing Local Authority resources. This means that whilst the rate of businesses with a ‘Pass’ is high, it is not necessarily an accurate and up-to-date picture of the out of home food hygiene environment.
The FHIS runs side by side with the Eat Safe Award, which recognises the businesses that go over and above the legal minimum food hygiene standards. Over, 1,000 businesses are signed up under the scheme and information is publicly available (including local authority location).[51]
Indicator 1B.3: Number of food samples tested for food safety, standards and authenticity in Scotland
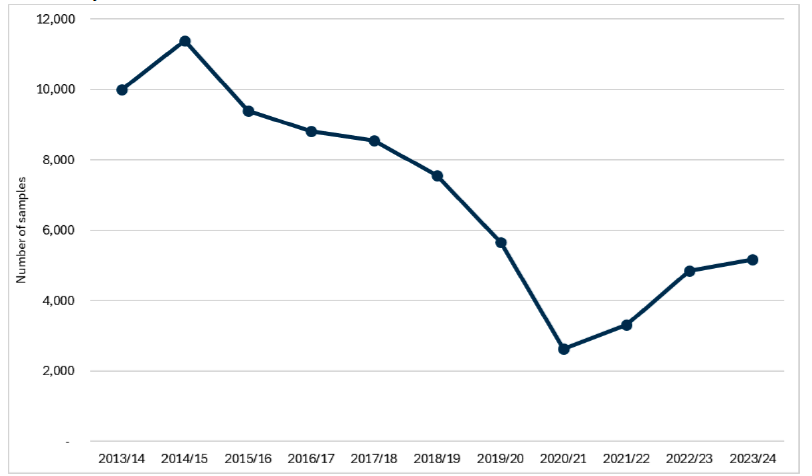
Headline 1B.3: The number of food samples tested for food safety, standards and authenticity in Scotland have been declining, reaching a low in 2020/21 during the Covid-19 pandemic. Since 2020/21, sampling numbers have gradually increased.
Source: Scottish Food Sampling Database[52]
Baseline 1B.3: The latest data for indicator 1B.3 shows that the number of samples reported by local authorities in 2024-25 was 4,402 (provisional figure).
Food sampling is undertaken in Scotland as part of FSS’s National Food Surveillance programme and by Local Authorities as part of the inspections they carry out to ensure food businesses are compliant with regulations. This sampling plays a key role in providing assurance over the food that is produced and sold in Scotland. Food samples are tested for a range of food safety, standards and authenticity parameters at Public Analyst Scientific Services laboratories which are designated by FSS as Official Laboratories (PA OLs).
Since 2015/16, there has been a significant reduction in Local Authority sampling activity, which caused the overall number of samples tested to fall from 9,399 samples to a low of 2,637 samples during the COVID-19 pandemic in 2020/21 - a decrease of almost 72%. Since 2020/21, sampling has gradually increased, however, numbers remain lower than pre-pandemic levels.
FSS is monitoring this issue as insufficient sampling hampers the ability of authorities to detect risks which can pose a threat to public health and consumer confidence. Reduced food sampling also adversely impacts on the ability of PA OLs to maintain routine food safety and standards testing and respond effectively to any major incidents.
Another source of data connected to food hygiene is available from Public Health Scotland (PHS) which provides information on laboratory reports of Gastrointestinal and Zoonotic (GIZ) pathogens in Scotland. Data presented in their reports include general trends for the main GIZ pathogens as well as seasonality, demographics, and incidence rates by NHS health board of residence.[53] Most samples are taken for clinical or public health reasons rather than for general surveillance purposes. Therefore, data arising from this surveillance represents only a proportion of the true underlying infection burden in the community and may be biased towards certain groups who are more likely to be tested such as the very young and the old, or those who have travelled. Therefore, we did not consider this as an appropriate indicator for the national Plan. Nevertheless, this data continues to provide useful information on the trends of infection rates over time, showing that foodborne disease rates in Scotland have remained stable but not decreased over time.
Sub-outcome 1C: The food environment increasingly enables more people to access and enjoy food that is produced sustainably
The food environment can be understood as the foods available to people in their surroundings as they go about their everyday lives and the nutritional quality, safety, price, convenience, labelling, and promotion of these foods.[54]
Our food environment has the potential to change and support our population’s health and promote more sustainably produced foods. The concept of the ‘food environment’ therefore recognises that shifting diets at a population level requires system change, rather than overly relying on policy approaches that focus on influencing individual behaviour alone. Evidence from England suggests that the focus on individual responsibility within diet policy is likely to have contributed to the lack of improvement in levels of healthy weight or related health inequalities over the past 30 years.[55] This aligns with what we see in Scotland, where levels of poor diet and excess weight continue to remain high (see Outcome 3).
Improving the food environment requires a broad range of policy actions and SG have committed to outlining these in the forthcoming Diet and Healthy weight implementation plan.
It is highly likely that new indicators to assess how Scotland’s food environment is changing will emerge over time - particularly indicators linked to new policy initiatives. However, for the first plan, we have used existing data collected as part of FSA and FSS Food and You 2 survey on consumer-related changes to eating habits and food related behaviours.
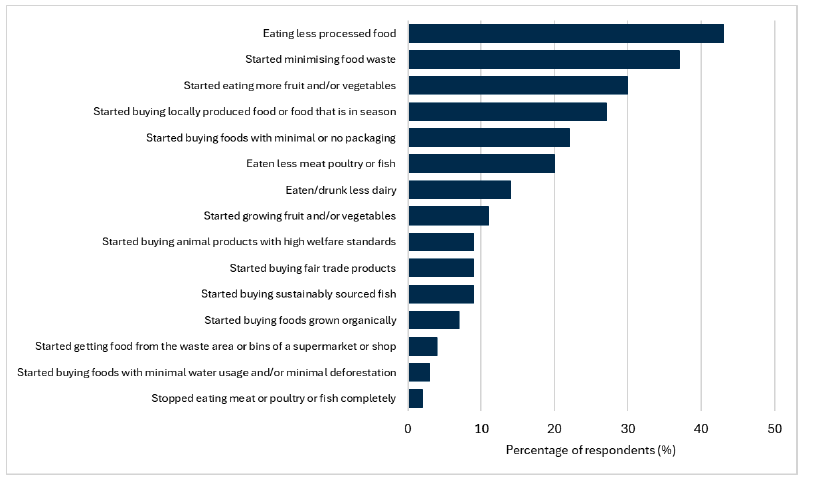
The rationale for this indicator is that it captures a number of behaviours which - if we were to see improvements in our food environment - we could hypothesise would increase. For example, eating less processed foods, eating more fruit and vegetables and choosing products with less plastic packaging. It also includes a number of behaviours related to more sustainable food choices (buying in season or locally produced food for example).
Indicator 1C.1: Consumer-related changes to eating habits and food-related behaviours
Headline 1C.1: From Spring 2026, there will be new survey data available which will indicate how many people in Scotland are changing what they eat, motivated by health and/or sustainability reasons.
Source: Food Standards Agency and Food Standards Scotland, Food and You 2 Survey
Baseline 1C.1: New data on food related behaviours will be published in early 2026 – when this is available this will set a baseline for this indicator going forward.
The FSA has been running the Food and You 2 survey in England, Wales and Northern Ireland since 2020. In Wave 8, FSS collaborated with the FSA to enable, for the first time, a sample of consumers in Scotland to be included in the survey.[56]
The survey questions within Food and You 2 wave 8 looked to explore any changes that respondents have made in the last 12 months to their eating habits or food-related behaviours. Note that responses ‘Other’ (3%), ‘None of these’ (6%) and ‘Don’t know’ (12%) have been excluded above as they do not provide any detail on specific actions taken. In 2023-2024, the top changes consumers made to their eating habits and food-related behaviours were to eat less processed foods, minimise food waste, eat more fruit and/or vegetables, buy local produced or in season food and to buy food with minimal or no packaging
From wave 11, two new questions will be asked - with similar options as set out in Figure 10:
- Thinking about the food that you eat, which, if any, of the following changes have you made in the last 12 months for health reasons?
- Thinking about the food that you eat, which, if any, of the following changes have you made in the last 12 months for sustainability reasons?
We will continue to monitor questions within these surveys that cover consumer related change in eating habits and food-related behaviours.
Contact
Email: resasfoodresearch@gov.scot