Good Food Nation plan: initial monitoring framework
The first monitoring framework for the national Good Food Nation Plan establishes a baseline for evaluating Scotland’s food system. It sets out 51 high-level indicators used to monitor progress towards the six overarching outcomes outlined in the national Good Food Nation Plan.
5. Outcome 3: A healthy population
Outcome 3: Scotland’s food environment and wider food system enables a physically and mentally healthy population. This leads to the prevention of, and a reduction in, diet-related conditions.
Summary of Outcome 3 Indicators
Meeting the ambition set out in Outcome 3 of the Good Food Nation Plan requires that progress is made towards achieving the Scottish Dietary Goals (SDGs) at a population level. When compared to the SDGs, the Scottish diet remains stubbornly unhealthy, and as a nation, we are far from meeting our dietary goals. Poor diet is a leading risk factor for ill health and has been linked to a range of poor health outcomes.[110]
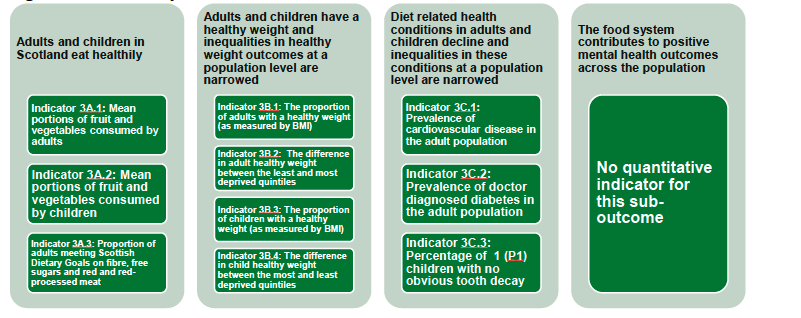
Adults and children in Scotland eat healthily
- Indicator 3A.1: Mean portions of fruit and vegetables consumed by adults
- Indicator 3A.2: Mean portions of fruit and vegetables consumed by children
- Indicator 3A.3: Proportion of adults meeting Scottish Dietary Goals on fibre, free sugars and red and red-processed meat
Adults and children have a healthy weight and inequalities in healthy weight outcomes at a population level are narrowed
- Indicator 3B.1: The proportion of adults with a healthy weight (as measured by BMI)
- Indicator 3B.2: The difference in adult healthy weight between the least and most deprived quintiles
- Indicator 3B.3: The proportion of children with a healthy weight (as measured by BMI)
- Indicator 3B.4: The difference in child healthy weight between the most and least deprived quintiles
Diet related health conditions in adults and children decline and inequalities in these conditions at a population level are narrowed
- Indicator 3C.1: Prevalence of cardiovascular disease in the adult population
- Indicator 3C.2: Prevalence of doctor diagnosed diabetes in the adult population
- Indicator 3C.3: Percentage of 1 (P1) children with no obvious tooth decay
The food system contributes to positive mental health outcomes across the population
- No quantitative indicator for this sub-outcome
Sub-Outcome 3A: Adults and children in Scotland eat healthily
The Scottish Dietary Goals (SDGs) describe, in nutritional terms, the diet that will improve and support the health of the Scottish population. They are set at the Scottish population level. They indicate the direction of travel, and assist policy development to reduce the burden of living with obesity and diet-related disease in Scotland.
The current suite of dietary goals capture nine food groups/nutrients, including fruit and vegetable intake, total saturated fat intake, salt intake and intake of fibre.[111] A review of the goals is in progress and due to complete in 2026. Monitoring of progress towards achieving the SDGs is a key function of Food Standards Scotland (FSS) and more comprehensive data on dietary intake among adults and children is published by FSS.
Since they were set in 1996, there has been little or no progress towards achieving the goals: the Scottish diet is too high in calories, fats, sugar and salt and too low in fruits, vegetables, oil rich fish and fibre. FSS are currently undertaking a review of the Scottish Dietary Goals to ensure that they reflect current scientific evidence on diets and align with the policy landscape in Scotland.
For the purposes of this Good Food Nation indicator framework, we have selected four key SDGs: to increase intake of fruit and vegetables (adults and children) to five portions, to increase intake of fibre, to reduce the intake of free sugars and to limit intake of red and red-processed meat. It should be noted that this selection of these goals does not reflect a prioritisation of these goals over other SDGs and reflects the proportionality of tracking all SDGs as indicators for the Good Food Nation Plan. We will continue to draw upon on-going monitoring of the Scottish diet by FSS and reflect any progress made against each SDG in future reviews of the Good Food Nation plan.
It should be noted that between 2001 and 2018, dietary intake among the Scottish population was estimated based on secondary analysis of food purchase data. From 2021, a new methodology using Intake24[112], was implemented in the Scottish Health Survey (SHeS) to collect detailed dietary intake data. Intake data will now be captured in the SHeS every 3 years. Due to this change in methodology, care should be taken when assessing longer term trends in dietary intake for adults.
With the exception of fruit and vegetable consumption[113], comprehensive information on the diet of Scottish children is limited and not routinely collected and has not been included as an indicator. Prior to 2024, the only comprehensive surveys designed to investigate this topic were being carried out in 2006 and 2010. A cross-sectional representative survey of children and young people aged 2 to 15 years living in Scotland was conducted in 2024, called Dietary Intake in Scotland’s Children (DISH).[114] The study found that most children and young people achieved the Scottish Dietary Goals for total fat, trans fat, total carbohydrate and red and red-processed meat. However, less than 1 in 5 met the Goals for energy density, saturated fat, fibre, free sugars and oily fish. Intake data will now be captured in the SHeS using Intake24 every 3 years from 2027 alongside adult data collection.
The Scottish Government is developing a new two-year implementation plan of preventative action to improve the food environment and support improvements to diet and healthy weight. This aligns with the Population Health Framework which identifies improving healthy weight as a key initial evidence-based priority.
The Scottish Government continues to invest in work to help people access healthier food options, including: the Reformulation For Health Programme[115], which helps Scottish food manufacturers develop healthier produce (and this is captured in the new Intake24 data shown above); the Healthy Living Programme[116] which promotes and sells healthier produce in lower income areas; and Community Food Networks[117] which help marginalized groups access healthier food options. They are also working with Food Standards Scotland and Public Health Scotland to develop actions to support people to eat well when eating out of home and have just completed a pilot of our new Eating Out Eating Well Framework[118], designed to help outlets provide healthier food choices.
Indicator 3A.1: Mean portions of fruit and vegetables consumed by adults
Headline 3A.1: Mean fruit and vegetable consumption by adults in Scotland remains well below the Scottish Dietary Goal of 5 portions per day.
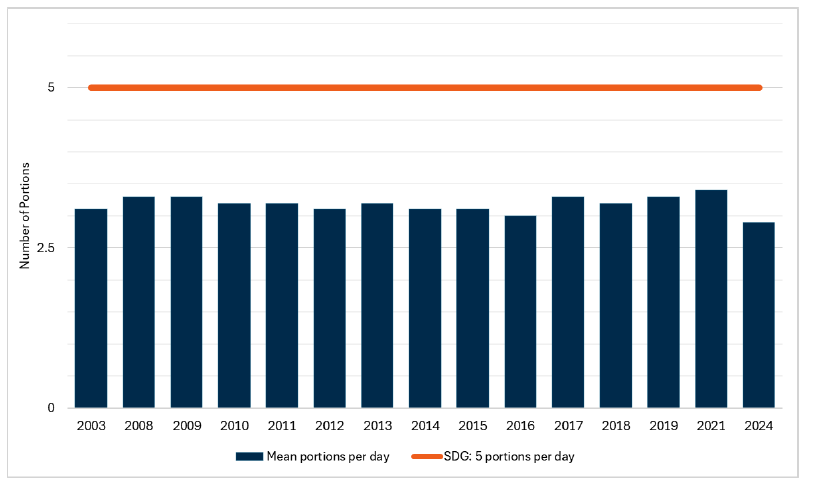
Source: Scottish Government, Scottish Health Survey 2024
Baseline 3A.1: The latest data for indicator 3A.1 shows that 2.9 portions of fruit and vegetables are consumed on average by adults per day in 2024, the lowest mean recorded. This will be the baseline for indicator 3A.1 as this data is collected every 3 years.
On average, adults consumed 2.9 portions of fruit and vegetables per day, which is significantly lower than that recorded in 2021 (3.4 portions) and the lowest average recorded. The mean portions of fruit and vegetables for men (2.9 potions) and women (2.8 portions) were not significantly different.
Fruit and vegetable consumption (mean number of portions per day) was lowest for those aged 16-24 and 25-34 (2.7 portions), and highest for those aged 35-44 (3.2 portions) in 2024. This is consistent with the proportion of adults who consumed five or more portions of fruit and vegetables per day, with the highest among those aged 35-44 (16%) and lowest among those aged 25-34 (7%).
In 2024, just over one-in-five adults (11%-12% of men and 10% of women) consumed the recommended five or more portions of fruit and vegetables per day, a significantly lower proportion than the range recorded between 2003 and 2021 (20%-24%). This figure had previously remained fairly stable since 2003.
Indicator 3A.2: Mean portions of fruit and vegetables consumed by children
Headline 3A.2: Mean fruit and vegetable consumption among children in 2023 remained at the higher end of the range recorded since 2008, but remains short of the Scottish Dietary Goal.
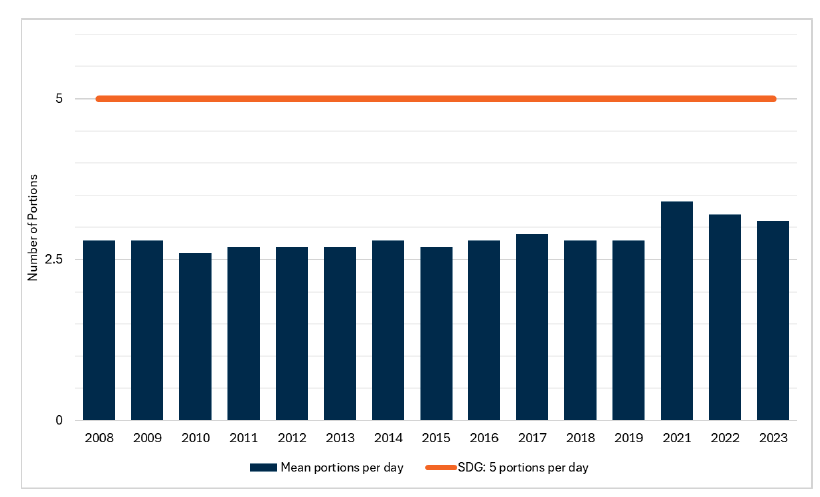
Source: Scottish Health Survey 2023
Baseline 3A.2: The latest data for indicator 3A.2 shows that 3.1 portions of fruit and vegetables are consumed on average by children per day (2023, Scottish Health Survey data). A baseline for indicator 3A.2 will be set when 2025 data is available.
Between 2008 and 2019, mean fruit and vegetable consumption among children aged 2-15 was in the range 2.6-2.9 portions per day. Since 2021, this has been in range of 3.1-3.4 portions per day (3.1 portions in 2023).
Mean consumption of fruits and vegetables was also higher in 2023 among younger children between the ages of 2-7 (3.4 portions) compared with those aged 8-15 (2.8 portions).
No dietary data was collected for children in 2024 due to a separate Intake24 survey being undertaken with children on behalf of Food Standards Scotland in 2023/2024. Information on child fruit and vegetable consumption will be included in the 2025 survey.
Indicator 3A.3: Proportion of adults meeting Scottish Dietary Goals on fibre, free sugars and red and red-processed meat.
Headline 3A.3: In 2024, the vast majority of adults in Scotland did not meet dietary goals for fibre (of 30g per day) and only a fifth met the goal for free sugar consumption (maximum of 5% energy from free sugars). Most adults do meet the goal to eat no more than an average of 70g of red and red-processed meat per day.
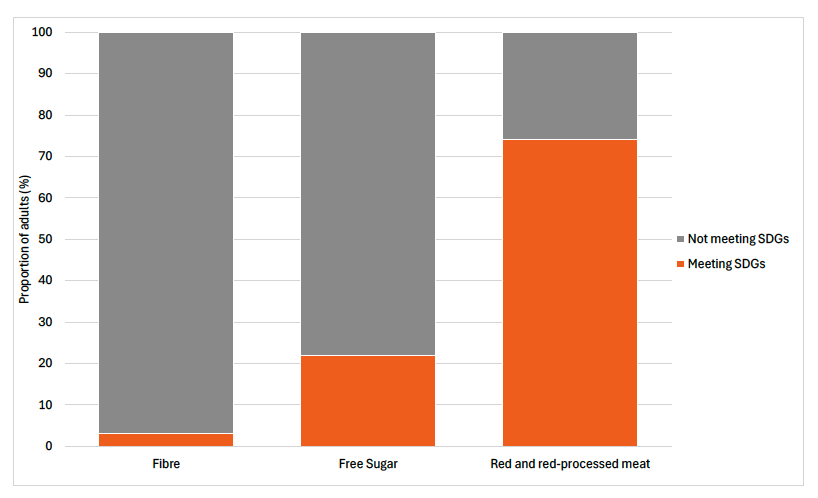
Source: Scottish Government, Scottish Health Survey 2024
Baseline 3A.3: The latest data for indicator 3A.3 shows that in 2024:
3% of adults met the SDG for fibre intake;
22% of adults met the SDG for free sugar intake and;
74% of adults met the SDG for red and red-processed meat intake
This will be the baseline for indicator 3A.3 as this data is collected every 3 years.
Actions relating to the improvement of fibre and free sugars in the Scottish diet are covered in previous sections in this chapter.
With respect to red and red-processed meat consumption the Scottish Government notes that the Climate Change Committee (CCC) has recommended a 20% shift away from all meat and dairy in Scotland by 2035. Currently 26% of the adult population in Scotland consumes in excess of the existing Scottish Dietary Goal for red and red-processed meat, increasing the risk of Type 2 Diabetes and colorectal cancer.[119]
Current advice from Food Standards Scotland (FSS) is that, rather than encouraging an ‘across the board’ reductions in meat consumption, efforts should focus on encouraging people who exceed the existing Dietary Goal to be in line with it.
Many population sub-groups in Scotland are already at risk of low micronutrient intakes including calcium, iodine, vitamin B12, selenium and zinc so any reductions require nutritionally sufficient replacements.
Of the three Scottish Dietary Goals assessed in this indicator, the one which most of the population meet is the goal on red and red-processed meat consumption.
Nearly three-quarters (74%) of adults (both consumers and non-consumers) consumed no more than 70g of red and red-processed meat per day, thereby meeting the SDG. A further 13% consumed over 70g/day but no more than 90g/day, while 13% consumed more than 90g/day. Men were less likely than women to meet the 70g or lower consumption level per day (63%) and more likely to exceed 90g/day (21%), compared with 84% and 6% of women respectively. Variations by age were not significant.
The SDGs recommend that free sugars account for no more than 5% of total dietary energy. Just over a fifth (22%) of adults met the SDG, with no significant variation between men and women. There were however differences in free sugar consumption by age, with adherence to the Scottish Dietary Goal lowest among adults aged 25-34 (17%) and highest among those aged 65-74 (29%).
The SDGs recommend that adults consume 30g of fibre per day. In 2024, only 3% of adults met this goal. The average adult fibre intake was 15g per day. Similar proportions met the goal and similar amounts per day were consumed for males and females and across the age groups.
Sub-outcome 3B: Adults and children have a healthy weight and inequalities in healthy weight outcomes at a population level are narrowed
Meeting the ambition set out in Outcome 3 of the Good Food Nation Plan requires that more adults and children in Scotland live with a healthy weight and that improvements are made in narrowing disparities between the most and least deprived communities.
Obesity occurs when energy intake from food and drink is greater than the body’s energy requirements over a long period of time. The causes of obesity are complex and multifactorial (see the foresight obesity map[120] for an exploration of the factors that contribute to obesity). It is recognised in the Good Food Nation Plan that improvements to our food environment will be an important factor in supporting a shift towards more adults and children living with a healthy weight (see sub-outcome 1C). It is recognised that other factors are important in realising this ambition, such as increasing levels of physical activity among adults and children.
For the purposes of measuring healthy weight across the population, the Good Food Nation Plan will use Body Mass Index (BMI) as measured through the Scottish Health Survey as the basis of indicators.
BMI is a proxy estimate of total body fat and is a widely accepted measure that allows for differences in weight due to height. It is defined as weight (kg)/square of height (m2). This has been used as a measure of excess weight in the Scottish Health Survey since its inception in 1995. For adults a normal or healthy weight BMI score would be between 18.5 and 25 kg/m2, a score of between 25 and 0 would be classified as overweight, and a score of over 30 is considered to indicate obesity. The full BMI classifications are set out in the Table 1 below. Although the BMI calculation method is the same, there are no fixed BMI cut-off points defining overweight and obesity in children. Instead, overweight and obesity are defined using several other methods including age and sex specific BMI cut-off points or BMI percentile cut-offs based on reference populations.
| BMI (kg/m2) | Description |
|---|---|
| Less than 18.5 | Underweight |
| 18.5 to less than 25 | Normal |
| 25 to less than 30 | Overweight, excluding obesity |
| 30 to less than 40 | Obesity, excluding morbid obesity |
| 40+ | Morbid obesity |
BMI is known to have some limitations and does not, for example, distinguish between mass due to body fat and mass due to muscular physique. The BMI ranges are also slightly different for people from South Asian, Chinese, African-Caribbean and black African backgrounds. People from these backgrounds may be at higher risk of health problems at a lower BMI than people from other ethnicities. Notwithstanding these limitations, BMI remains a robust and well understood indicator of healthy weight at a population level, hence its inclusion as an indicator for the Good Food Nation Plan.
The 2018 Diet and Healthy Weight Delivery Plan[121] set out the main areas of focus for improving levels of healthy weight. The plan set out the ambitious aim to halve childhood obesity by 2030 and significantly reduce diet-related health inequalities. We know that there are weight-related health inequalities in Scotland’s population, and that these are exacerbated by poor diets and diet inequalities.
Particular sub-groups may have particular needs in relation to achieving and/or maintaining a healthy weight. There is a specific reference to malnutrition in the Good Food Nation Plan. Actions on malnutrition will be set out in our upcoming Diet and Healthy Weight implementation plan, due to publish in 2026.
Indicator 3B.1: The proportion of adults with a healthy weight (as measured by BMI)
Headline 3B.1: The proportion of adults with a healthy weight has remained relatively stable over time from 2012 to 2024. Although the proportion of adults that are overweight has decreased slightly over this period, the proportion that are living with obesity (including morbid obesity) has increased.
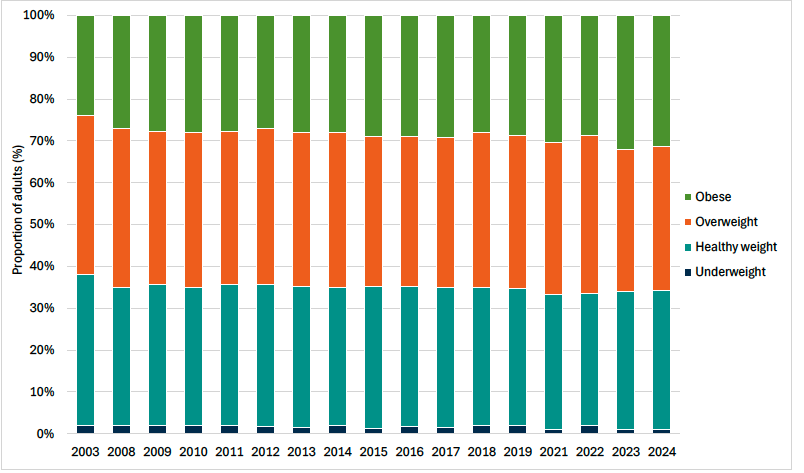
Source: Scottish Government, Scottish Health Survey 2024
Baseline 3B.1: The latest data for indicator 3B.1 shows that 33% of adults had a healthy weight in 2024. A baseline for indicator 3B.1 will be set when 2025 data is available.
As set out in section 2 of this report, we have amended indicator 3B.1 to track the proportion of adults in the Scottish population living with a ‘healthy weight’, as measured by BMI in the Scottish Health Survey.
In 2024, a third of adults (33%) were within a healthy weight ranged based on their BMI. Women (35%) were more likely than men (30%) to be in the healthy weight range, and were also less likely to be overweight (28%) than men (41%), but women were more likely to be obese, including morbidly obese (35%) than men (27%). Nearly a third of all adults (31%) were living with obesity.
In terms of the mean BMI for adults, it reached its highest level (28.1 kg/m2), with a higher mean BMI recorded among females compared with males.
Indicator 3B.2: The difference in the proportion of adults with a healthy weight (as measured by BMI) in the most and least deprived quintile of the population
Headline 3B.2: The difference in the proportions of adults with a healthy weight between the least and most deprived quintiles of the population has fluctuated over time.
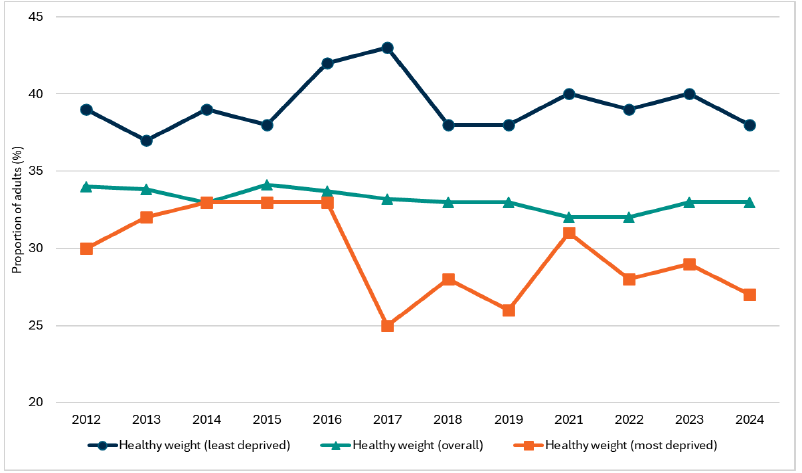
Source: Scottish Government, Scottish Health Survey 2024
Baseline 3B.2: The latest data for indicator 3B.2 indicates that the difference the proportion of adults in healthy weight categories for the least and most deprived quintiles was 11% in 2024. A baseline for indicator 3B.2 will be set when 2025 data is available.
As set out in section 2 of this report, we have amended indicator 3B.2 to track the proportion of adults in the Scottish population living with a ‘healthy weight’, as measured by BMI in the Scottish Health Survey.
In 2024, the proportion of adults within the healthy weight range was 38% in the least deprived quintile[122] and 27% in the most deprived quintile, meaning there is a healthy weight gap of 11% between the least and most deprived quintiles.
In 2012, the gap in the proportion of adults within the healthy weight range was around 9%, rising to 11% in 2024. This pattern has fluctuated - peaking at 18% in 2017 - but the overall trend suggests growing disparity. The widening gap is largely driven by differences in obesity prevalence. In 2024, 36% of adults in the most deprived areas were living with obesity compared with 24% in the least deprived, whereas the proportion of adults who were overweight (but not obese) showed little difference between groups.
Disparity between the least and most deprived quintiles is also reflected in the mean BMIs recorded, with 27.1 kg/m2 the average in the least deprived quintile and 28.9 kg/m2 the average in the most deprived quintile.
Indicator 3B.3: The proportion of children with a healthy weight (as measured by BMI)
Headline 3B.3: More than six in ten children were in the healthy weight range as measured by BMI in 2024. This proportion has been in the range 64% to 72% since 1998.
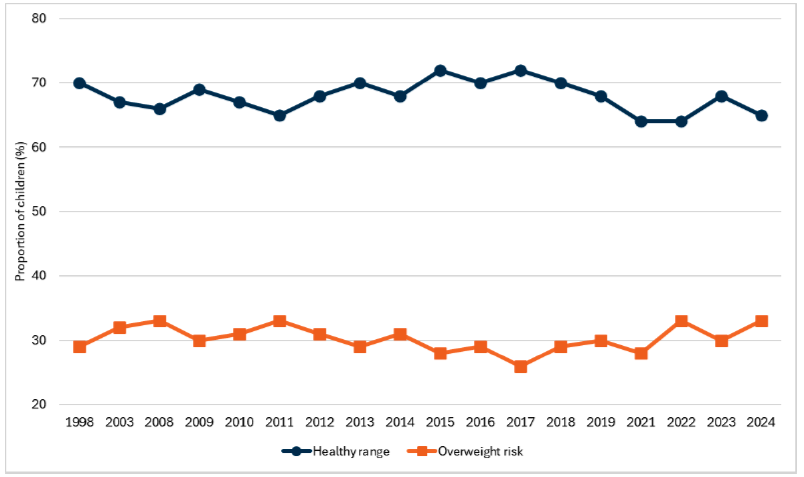
Source: Scottish Government, Scottish Health Survey 2024
Baseline 3B.3: The latest data for indicator 3B.3 shows that the proportion of children with a healthy weight was 65% in 2024. A baseline for indicator 3B.3 will be set when 2025 data is available.
In 2024, almost two-thirds (65%) of children were within a healthy weight range based on their BMI. Although this is down from 68% in 2023, the proportion of children within the height weight range has been between 64% and 72% since 1998. There was not a significant difference between males and females in 2025 (64% and 66% respectively).
In 2024, 33% of children were at risk of being overweight (15% of children were at risk of being overweight and a further 18% were at risk of living with obesity). This marks a return to the series peak, previously recorded in 2022, although the proportion has fluctuated between 26% -33% since 1998. Differences by age and sex were not significant.
Indicator 3B.4: The difference in the proportion of children with a healthy weight (as measured by BMI) in the most and least deprived quintile of the population.
Headline 3B.4: In 2024, 59% of children in the most deprived communities in Scotland have a healthy weight, compared to 74% in the least deprived communities.
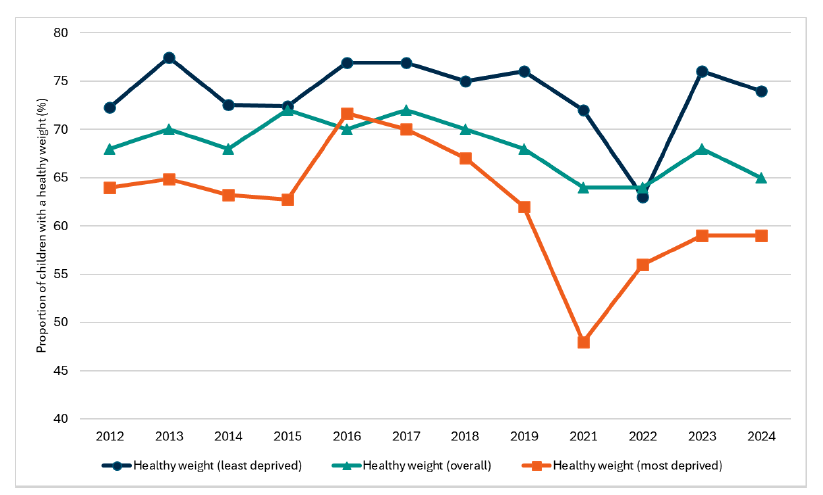
Source: Scottish Government, Scottish Health Survey 2024
Baseline 3B.4: The latest data for indicator 3B.4 shows the difference in healthy weight categories for the least and most deprived quintiles of children was 15% in 2024. A baseline for indicator 3B.2 will be set when 2025 data is available.
The proportion of children in the most deprived areas of Scotland within the healthy weight range has been consistently lower than the proportion of children within the healthy weight range in the least deprived areas of Scotland, as measured by quintiles. Whilst at times the gap has been statistically insignificant (2016) and there is annual variation, the gap has tended to widen over time. In 2024, the gap was 15 percentage points (74% and 59% in the least and most deprived areas, respectively), this compares with a gap of 8 percentage points in 2012 (72% and 64% in the least and most deprived areas, respectively).
Sub-outcome 3C: Diet related health conditions in adults and children decline and inequalities in these conditions at a population level are narrowed
Shifting more people in Scotland to a healthy diet is understood to be an important driver - alongside other lifestyle changes, such as increased physical exercise - in reducing the risk and prevalence of diet-related health conditions in the long-term, as referenced in Outcome 3 of the Good Food Nation Plan. “Diet-related conditions” refers to health conditions that are influenced or caused by an individual’s dietary behaviours. The risk of these conditions can be increased due to poor diets, for example, inadequate or excessive consumption of certain nutrients. Common diet-related conditions include: type 2 diabetes, cardiovascular diseases, hypertension, certain types of cancer, nutrient deficiencies, and digestive disorders.
In the long-term, improvements to the Scottish diet should have a meaningful impact on key indicators of diet-related conditions in the population. For the purposes of the indicator framework, we have focused on three indicators. Two indicators cover diet-related health conditions within the adult population and one indicator is used for children’s health outcomes (dental health).
For the adult population, the first indicator considers the prevalence of any cardiovascular condition (except diabetes and high-blood pressure) in the adult population. The second indicator captures the prevalence of diagnosed diabetes in the adult population. Both are measured annually in the Scottish Health Survey.[123]
High free sugar intake among children is a key factor driving tooth decay. As tooth decay can be linked to over consumption of free sugar, we use this as an indicator of diet-related disease in children. The data is sourced from the National Dental Inspection Programme (NDIP).[124]
Indicator 3C.1: Prevalence of CVD in the adult population
Headline 3C.1: Prevalence of cardiovascular disease (CVD) in adults has remained broadly stable. In 2024, there was a significant reduction in the prevalence gap between adults in the most and least deprived areas.
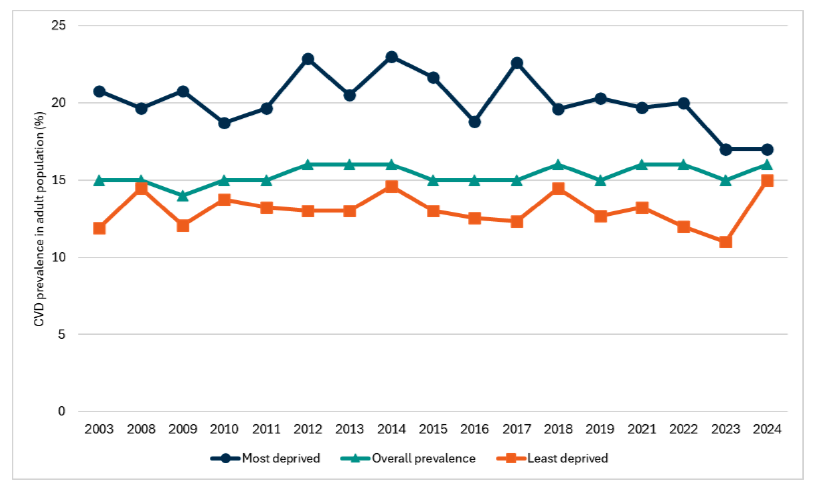
Source: Scottish Government, Scottish Health Survey 2024
Baseline 3C.1: The latest data for indicator 3C.1 indicates that CVD prevalence in the adult population was 16% in 2024. A baseline for indicator 3C.1 will be set when 2025 data is available.
In 2024, the prevalence of CVD[125] in the adult population was 16%. The prevalence has remained relatively stable over time, fluctuating between 14%-16%. There was no significant difference between men and women (17% and 14% respectively). However, the prevalence of CVD among adults increases with age, from 4% among those aged 16-24 to 42% among those aged 75 and over.
The prevalence of CVD in the least deprived quintile was 15% in 2024. This compares to 17% in the most deprived areas. Although the overall prevalence has remained stable over time, the prevalence gap between the most and least deprived quintiles (2%) has reduced to its lowest level.
Indicator 3C.2: Prevalence of doctor-diagnosed diabetes in the adult population
Headline 3C.2: Prevalence of doctor-diagnosed diabetes in adults has remained broadly stable, however rates are higher for adults in more deprived areas.
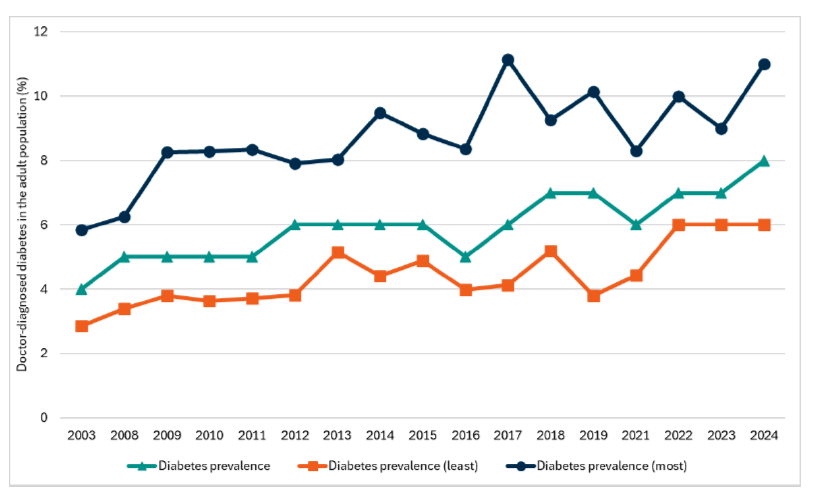
Source: Scottish Government, Scottish Health Survey 2024
Baseline 3C.2: The latest data for indicator 3C.2 indicates that doctor-diagnosed diabetes prevalence in the adult population was 8% in 2024. The difference in diabetes prevalence between the most and least deprived areas was 5 percentage points. A baseline for indicator 3C.2 will be set when 2025 data is available.
Diabetes, the most prevalent metabolic disorder, is a growing health challenge for Scotland. The majority of those registered as diabetic in Scotland have Type 2 diabetes, which can be influenced by demographic factors such as an ageing population and lifestyle factors such as diet, low levels of physical activity and obesity. Type 2 diabetes can have a serious impact on people’s lives - such as cardiovascular disease, sight loss and amputation - and puts a significant amount of pressure on our health service.
In 2024, the prevalence of self-reported doctor-diagnosed diabetes was 8% - it is the highest prevalence level recorded.[126] The prevalence level for women was 6% and 9% for men. Type II diabetes remained the most frequently diagnosed type of diabetes among all adults (7% in 2024 for Type II versus 1% for Type I).
Similarly to the prevalence of CVD, the prevalence of type II diabetes and doctor-diagnosed diabetes increased with age, increasing from 0%-2% for those aged 16-44 to 18% and 20% respectively for adults aged 75 and over.
The prevalence of doctor-diagnosed diabetes in the least deprived quintile was 6% in 2024, compared to 11% in the most deprived quintile.
Indicator 3C.3: Percentage of Primary 1 (P1) children with no obvious tooth decay
Headline 3C.3: Child oral health has improved over recent decades. In 2024, more than 7 in 10 P1 children examined showed no obvious decay experience. Inequalities between the least and most deprived areas remain.
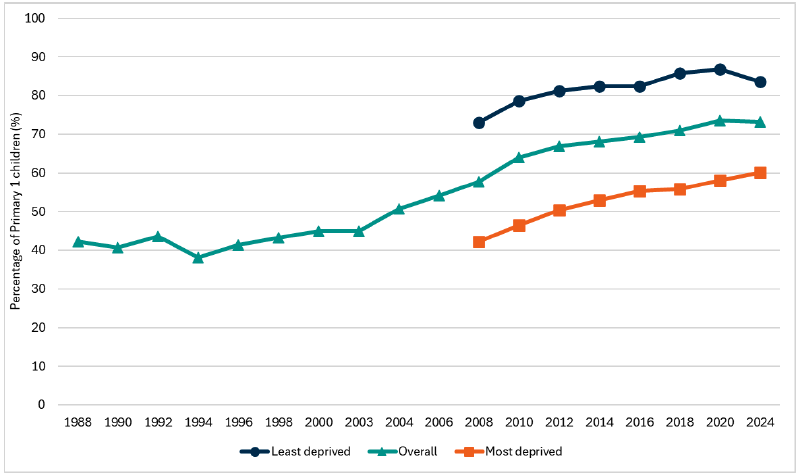
Source: Public Health Scotland, National Dental Inspection Programme (NDIP)
Baseline 3C.3: The latest data for indicator 3C.3 is set at 73.2% which is the proportion of Primary 1 children with no obvious tooth decay recorded in 2024 and the difference in prevalence between the most and least deprived areas is 23.5 percentage points.
All Primary 1 and Primary 7 pupils are offered a Basic Inspection each year. In addition, a Detailed Inspection is conducted on a representative sample, alternating each year between P1 and P7 pupils. This indicator focuses on the Detailed Inspection of Primary 1 pupils. The Detailed Inspection involves a comprehensive assessment of the mouth using a light, a mirror and ball-ended probe. It involves recording the status of each surface of each tooth in accordance with international dental epidemiological conventions, and measures obvious decay into dentine when seen under school (rather than dental surgery) conditions. Data is available back to 2002/03 and is published by Public Health Scotland.[127] Prior to this, data was collected through a series of annual surveys of key age groups of Scottish children. Data is collected at a Health Board and local authority level.
In the 2024 survey, 73.2% of P1 children examined had no obvious decay experience in their primary teeth, meaning 26.8% had obvious decay experience. Among those with decay experience, the average number of affected teeth was 3.66, with regional variations ranging from 2.63 to 4.09. The number of affected teeth per child varied from one to all 20 teeth.
Sub-outcome 3D: The food system contributes to positive mental health outcomes across the population
Headline 3D: An improved food system is expected to contribute positively to mental health outcomes for Scotland’s population. However, a suitable indicator to assess and monitor this has not been identified at this stage, with further work required to develop indicators.
Outcome 3 of the Good Food Nation emphasises that an improved food environment and food system will bring about improvements not just in the physical health of the population, but also mental health outcomes. Whilst it is recognised that the causes of mental illness are many and varied, and are present independent of nutrition and diet, the relationship between diet and nutrition and mental health has gained recent research interest.
For example, epidemiological research has observed that adherence to healthy or Mediterranean dietary patterns is associated with a reduced risk of depression[128]. The nature of this relationship is complex. There is clear potential for reverse causality between diet and mental health, as it could be the case that sub-optimal food choices could be linked with a pre-existing mental state. For example, consumption of “comfort foods” in times of low mood, or changes in appetite from stress.
Similarly, it has been shown that sharing meals with others can provide psychological and social benefits, helping to reduce feelings of isolation and improve overall mental well-being. The results from independent research[129] suggest that communal eating increases social bonding and feelings of wellbeing, and enhances one’s sense of contentedness and embedding within a community.
For the purposes of the Good Food Nation indicator framework, we have not identified a suitable indicator that could be used to monitor how improvements in the food system might translate directly to improved mental health outcomes. Overall mental wellbeing of adults, at a population level is monitored through the Scottish Health Survey through WEMWBS[130] scores.[131] Loneliness for adults is also measured, as well as prevalence of self-reported eating behaviours and feelings related to food that could be indicative of a possible eating disorder. Many factors can have an impact on mental health and wellbeing including social, cultural, political, environmental and economic factors such as living and working conditions and social support.
Contact
Email: resasfoodresearch@gov.scot