We use cookies to collect anonymous data to help us improve your site browsing
experience.
Click 'Accept all cookies' to agree to all cookies that collect anonymous data.
To only allow the cookies that make the site work, click 'Use essential cookies only.' Visit 'Set cookie preferences' to control specific cookies.
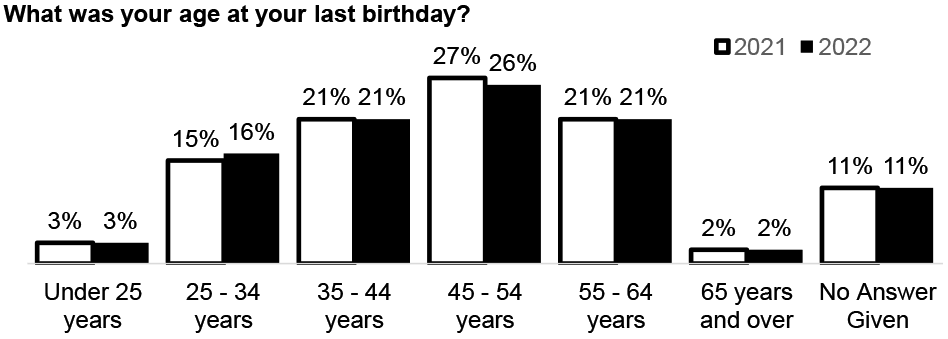
No major changes in the demographic profile of staff completing the iMatter survey. The very slightly younger age profile may be contributing to the increases in those who have not married/entered a civil partnership and those who have no religion.
What is your sex?
2021
2022
Movement 2022 – 2021 (Percentage points)
Female
75%
75%
0
Male
19%
18%
-1
No Answer Given
6%
7%
+1
Which of the following best describes your sexual orientation?
2021
2022
Movement 2022 – 2021 (Percentage points)
Straight/Heterosexual
87%
88%
+1
Gay or Lesbian
2%
2%
0
Bisexual
1%
1%
0
Prefer to self-describe
1%
1%
0
No Answer Given
8%
8%
0
Do you consider yourself to be trans, or have a trans history?
2021
2022
Movement 2022 – 2021 (Percentage points)
No
93%
93%
0
Yes
<1%
<1%
0
No Answer Given
7%
7%
0
What is your legal marital or registered civil partnership status?
2021
2022
Movement 2022 – 2021 (Percentage points)
Never married and never registered in a civil partnership
25%
28%
+3
Married
52%
51%
-1
In a registered civil partnership
1%
1%
0
Separated, but still legally married
3%
3%
0
Separated, but still legally in a civil partnership
<1%
<1%
0
Divorced
8%
8%
0
Formerly in a civil partnership which is now legally dissolved
<1%
<1%
0
Widowed
2%
2%
0
Surviving partner from a civil partnership
<1%
<1%
0
No Answer Given
9%
8%
-1
What religion, religious denomination or body do you belong to?
2021
2022
Movement 2022 – 2021 (Percentage points)
None
50%
52%
+2
Church of Scotland
21%
20%
-1
Roman Catholic
14%
14%
0
Other Christian
4%
4%
0
Muslim
1%
1%
0
Hindu
<1%
<1%
0
Buddhist
<1%
<1%
0
Sikh
<1%
<1%
0
Jewish
<1%
<1%
0
Pagan
<1%
<1%
0
Another religion or body
1%
1%
0
No Answer Given
7%
7%
0
Have you been on maternity/parental or shared parental leave in the last 12 months?
2021
2022
Movement 2022 – 2021 (Percentage points)
Yes
4%
3%
-1
No
88%
90%
+2
No Answer Given
12%
7%
-5
Do you consider yourself to be disabled within the definition of the Equality Act 2010?
2021
2022
Movement 2022 – 2021 (Percentage points)
No
88%
88%
0
Yes
5%
6%
+1
No Answer Given
6%
6%
0
Do you have any of the following, which have lasted, or are expected to last, at least 12 months?
2021
2022
Movement 2022 – 2021 (Percentage points)
Deafness or partial hearing loss
4%
4%
0
Blindness or partial sight loss
1%
1%
0
Full or partial loss of voice or difficulty speaking
<1%
<1%
0
Learning disability
1%
1%
0
Learning difficulty
2%
2%
0
Developmental disorder
<1%
0%
0
Physical disability
4%
4%
0
Mental health condition
10%
10%
0
Long-term illness, disease or condition
14%
14%
0
Other condition
4%
4%
0
No condition
68%
68%
0
No Answer Given
21%
18%
-3
19,464 (18%) staff did not answer this question. It is reasonable to assume the majority of these do not have any conditions lasting 12 months or more. Therefore, as a proportion of all staff the percentages reported above are likely to be reduced by circa.20%.
What is your ethnic group?
2021
2022
Movement 2022 – 2021 (Percentage points)
White
90%
90%
0
Mixed or multiple ethnic groups
1%
1%
0
Asian, Scottish Asian or British Asian
2%
2%
0
African, Scottish African or British African
1%
1%
0
Caribbean or Black
1%
<1%
0
Another ethnic group
<1%
<1%
0
No Answer Given
6%
7%
+1
2021
2022
Movement 2022 – 2021 (Percentage points)
White
Scottish
85%
85%
0
Other British
10%
10%
0
Irish
2%
2%
0
Polish
1%
1%
0
Gypsy / Traveller
<1%
<1%
0
Roma
<1%
<1%
0
Showman / Showwoman
<1%
<1%
0
Another white ethnic group
2%
2%
0
No Answer Given
1%
1%
0
Asian, Scottish Asian or British Asian
Pakistani, Scottish Pakistani or British Pakistani
19%
19%
0
Indian, Scottish Indian or British Indian
44%
44%
0
Bangladeshi, Scottish Bangladeshi or British Bangladeshi
2%
2%
0
Chinese, Scottish Chinese or British Chinese
11%
11%
0
Other
17%
19%
+2
No Answer Given
6%
5%
-1
Another ethnic group
Arab, Scottish Arab or British Arab
26%
27%
+1
Other, please write in
56%
55%
-1
No Answer Given
18%
18%
0
Staff Grouping
83% of staff completing the iMatter survey are employed by NHSScotland and 14% by Local Authorities. 3% chose not to answer the question.
The three largest staff groupings in NHSScotland staff are Nursing and Midwifery (34%), Administrative Services (22%) and Allied Health Profession (12%).
Support Services (Catering, domestic, portering, estates and facilities, security, laundry, transport, sterile services.)
7%
No Answer Given
3%
Among Local Authority staff almost half (48%) are employed in Adult Services and a quarter (25%) in Older People Services.
Local Authority Employees
2022
Adult Services
48%
Business Services (Business Improvement, Support Services, Information Systems, Finance and Administration)
7%
Children’s Services
11%
Criminal Justice
4%
Older People Services
25%
Senior Managers
1%
Strategic Development
1%
No Answer Given
3%
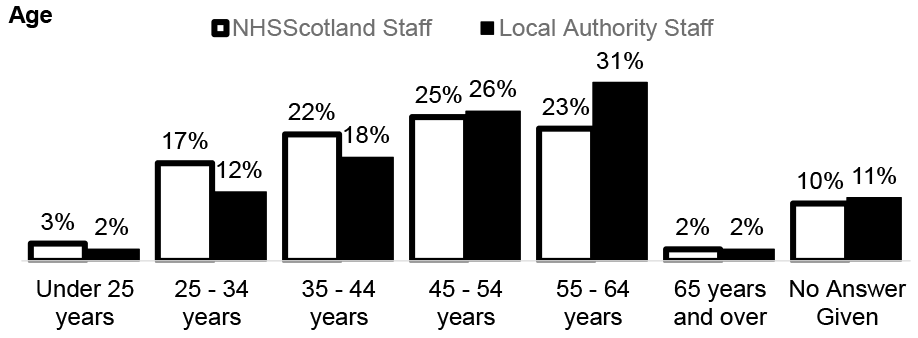
Staff Groupings – Demographic Profiles
While NHSScotland staff have a similar demographic profile to Local Authority staff in most attributes, there is a notable difference on age. A greater proportion of Local Authority staff are 45 years and over (55% vs 47%).
Appendix 8 contains an overview of the demographic profile of each of the NHSScotland and Local Authority Staff Groupings. There are quite considerable differences for example:
90% of NHSScotland Nursing and Midwifery staff are female compared to only 41% of Ambulance Services staff
90% of Local Authority staff working in Older People Services are female, compared to 70% of Senior Managers
12% of NHSScotland staff working in Other Therapeutic are aged 55 years and over, compared to 41% of those working in Support Services
26% of Local Authority staff working in Business Services and Criminal Justice are aged 55 years or older, compared to 39% of those working in Older People Services
The highest proportion of staff who are of ethnicity other than white in NHSScotland are Medical and Dental staff (14%) and the lowest is Ambulance Service and Senior Managers (both less than 2%)
Appendix 9 contains an overview of demographics by Board. The Geographic Boards are quite similar in demographic profiles. National Boards show more differences particularly around age and gender.