Scottish Income Tax: 2018-19 policy evaluation
A policy evaluation of Scottish Income Tax in 2018-19
6. Progressivity and Protecting lower earners tests
Progressivity test - any changes to the Income Tax system should increase the progressivity of the tax system and reduce income inequality.
Protecting lower earners test - at a time when living costs are also rising, taxpayers in lower income brackets should not pay more tax.
In addition to raising revenues for investment in public services, Income Tax is also one of the main levers at the Scottish Government's disposal for redistributing household income and tackling income inequality. The role of Income Tax in Scotland's budget discussion paper therefore set out two further tests against which the 2018-19 policy was to be judged.
This section sets out to which extent the 2018-19 policy met these tests by drawing on newly available evidence from HMRC's Survey of Personal Incomes (SPI) for the year of the tax reform, 2018-19, as well as data from the Family Resources Survey (FRS) from 2015-16, 2016-17 and 2018-19 to examine the impact of the policy on taxpayers and households.
6.1 Key findings
- Our modelling indicates that the 2018-19 Income Tax policy was progressive across large parts of the income distribution – with certain elements of the policy more progressive than others.
- The policy resulted in a small reduction in inequality, as measured by the Gini coefficient (a fall of 0.3 percentage points).
- The policy was also highly redistributive with the bottom two household deciles experiencing small gains in household income.
6.2 Progressivity Test
A progressive tax regime taxes people according to their ability to pay, with high income earners paying proportionately more in tax than those on lower incomes. Prior to devolution, the Income Tax systems in Scotland and the rUK were already progressive. However, following the introduction of the two new bands, the Starter and Intermediate Rate, and the 1p increase in the Higher and Top rate, Scotland's tax schedule slightly more progressive, relative to the rUK, as illustrated in chart 4.
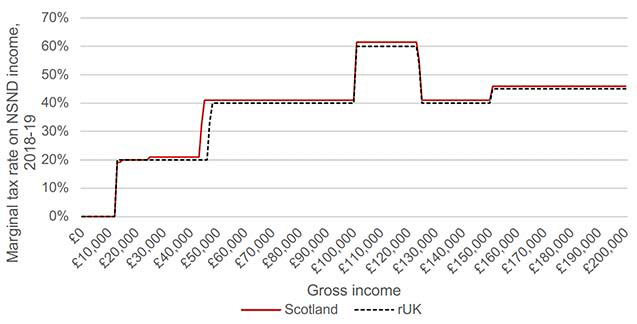
Source: Scottish Government
There are different ways of measuring the progressivity of a tax system, each with their pros and cons.
One way to assess the progressivity of a tax system as a whole, and its impact on inequality, is to estimate the change in the Gini coefficient[21], an internationally recognised measure of how equally income is distributed across the population. A reduction in the Gini co-efficient would reduce income inequality and would therefore mean that the tax policy is more progressive.
We estimate these impacts using the microsimulation model UKMOD, based on Family Resources Survey (FRS) data from 2016-17, 2017-18, and 2018-19[22]. UKMOD is a static model, meaning it does not take into account behavioural changes resulting from the policy. However, we would expect the broad findings to remain valid, even if the magnitudes are affected by behavioural changes.
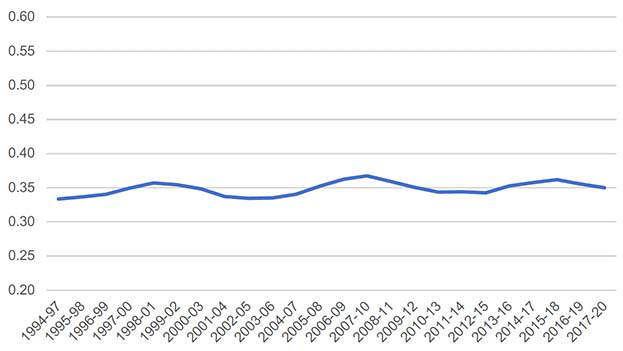
As illustrated in chart 5, the Gini coefficient for Scotland has been relatively stable at 36% over the period 2014-17 to 2016-19, with a small drop, i.e. an improvement in income equality, over the period 2017-2020. However, it is important to note that many factors, not just Income Tax policy, determine the Gini coefficient, most notably UK Government welfare policies in addition to the distribution of earnings growth.
In order to isolate the impact of the Scottish Government's Income Tax policy choices on equality outcomes, this section considers the impact of 2018-19 reform on the Gini coefficient, and on different types of individuals and households, by comparing the Scottish tax regime in 2018-19 with a hypothetical scenario where the rUK rates and bands had remained in place in Scotland. This allows us to focus on the impact of Scottish policy choices, rather than changes in the UK-wide Personal Allowance, and show which taxpayers benefitted, or saw their tax bill increase, from the policy reform.
Source: Scottish Government analysis using UKMOD
As shown in Chart 5, this modelling indicates that the Gini coefficient was 0.3 percentage points lower under the Scottish tax regime in 2018-19 than it would have been if the UK tax regime had remained in place in Scotland. Given the small size of these estimates, they will be highly sensitive to measurement error as well as methodological choices and thus should be treated as solely indicative. Note also that the measures given here are modelled estimates which do not necessary align with official statistics, for example because benefit income is simulated rather than taken directly from the FRS.
|
|
UK tax regime |
Scottish tax regime |
Difference |
|---|---|---|---|
| Gini Coefficient |
32.9% |
32.6% |
-0.3 |
Previous analysis carried out by Scottish Government estimated a reduction of 0.14 percentage points in the Gini coefficient if the 2018-19 Scottish tax system was compared with the 2017-18 system, and a reduction of 0.18 percentage points if compared to a counterfactual scenario of the 2018-19 system without the policy change[23]. Although the scale of the reduction varies depending on the chosen counterfactual, the modelling therefore points towards a small reduction in inequality.
Another option for measuring the progressivity of the tax system is to consider the percentage change in income, as this allows us to examine the impact of the reform across different levels of income. This approach is relevant here as the policy would affect different segments of the income distribution differently. Chart 6 illustrates the impact of the Scottish Government's policies up to 2018-19 on individual taxpayers' take-home pay, compared to having the rUK rates and bands in place, as well as the impact in cash terms.
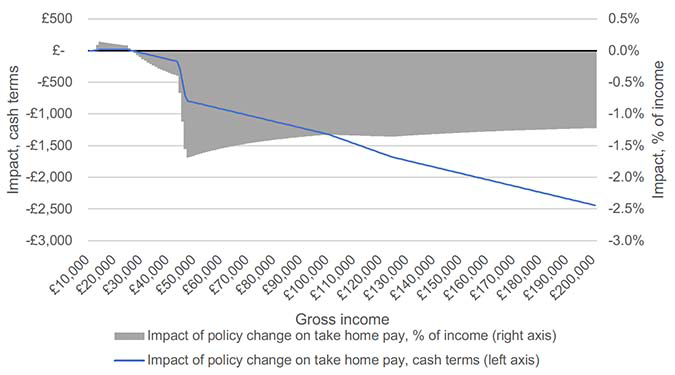
Source: Scottish Government analysis
Income Tax policy increased take-home pay for low income earners, albeit by a modest amount of up to £20 per year (or 0.1% of their gross income). At the same time, take-home pay fell for taxpayers earning more than £26,000. However, the percentage change in income did not increase consistently with the level of income as some income groups – in particular those with earnings just above £46,350 and £123,700 – saw the largest percentage fall in their take-home pay.
This means that the Income Tax policy was progressive across many parts of the income distribution. However, some elements of the policy were less progressive than others. For example, the change in the Higher Rate threshold was less progressive than the 1p change in the rates. This is because for all taxpayers earning more than £46,350, the threshold change increased their tax liability by the same amount, in this instance £584, regardless of their income.
This explains why taxpayers with earnings just above the rUK's Higher Rate threshold of £46,350 saw a greater percentage change in their net income than taxpayers higher up the distribution, although differences are marginal. Moreover, interactions with reserved elements of Income Tax - such as the tapered withdrawal of the Personal Allowance for incomes above £100,000, with it being fully withdrawn at £123,700 (for 2018-19) mean that taxpayers in that income range, rather than the very top earners, faced the largest percentage change in their take-home pay.
Chart 6 above, while it shows the impact of the policy change by income, does not account that the vast majority of taxpayers have incomes on the left hand side of the chart. An alternative approach is to present the impact of the 2018-19 policy on Scottish taxpayers by income decile, based on data from the 2018-19 SPI, as in Charts 7 and 8 below. This approach divides the taxpayer population into ten equal groups, with decile 1 representing the 10% of taxpayers with the lowest earnings and decile 10, the 10% of taxpayers with the highest earnings.
As shown in charts 7 and 8, the Scottish Government's 2018-19 policy has been highly redistributive and protected low - and middle-income taxpayers. The introduction of the Starter Rate provided a tax saving of up to £20 annually to all taxpayers, although for the top 40% of taxpayers, this is more than offset by the tax raising measures. Relative to their gross earnings, taxpayers in deciles 2 and 3 saw the largest increase in their take-home pay, as they benefitted from the full £20 tax saving. By contrast, the highest earning 10% of taxpayers, i.e. those earning more than £50,100, saw the largest fall in their take-home pay, both in cash terms (-£1,180 annually) and relative to their gross income (-1.34%).
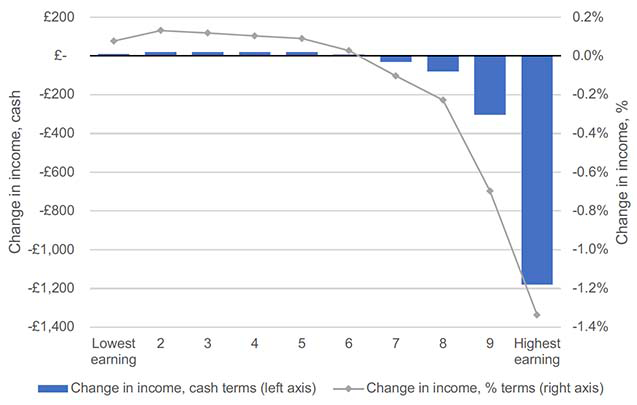
Source: Scottish Government analysis based on 2018/19 PUT
However, it is important to remember that a significant proportion of the Scottish adult population, 44.1% or 2.0 million adults, did not pay Income Tax in 2018-19, either because they were in work but earned less than the Personal Allowance, or because they have no taxable income - if, for example, they were in education or had full-time caring responsibilities. These individuals were not directly affected by the Scottish Government's Income Tax policies and are not covered in the taxpayer analysis above.
We therefore consider the impact of the policy across the household distribution and different types of households. This accounts for the fact that some of these high income taxpayers may be the main family earner, supporting a partner and/or children.
Using UKMOD, Chart 8 below shows the impacts of the policy by household income decile. As can be seen in the chart, on average the bottom two deciles experienced marginal gains in household income, despite a marginal fall in benefit payments and a likely concentration of non-taxpayers in these deciles[24]. The remaining deciles experienced net losses, which were larger for higher-income households. While the distribution of losses was therefore more dispersed when measured at the household level, these results confirm that the policy was progressive.
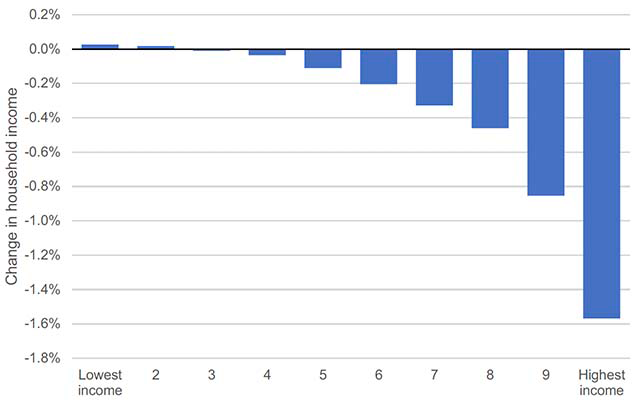
Source: Scottish Government analysis using UKMOD
This analysis also found that only 0.02% of individuals experienced an increase in household income of over 1%, compared with the UK tax regime, and no individuals experienced an increase of over 5%. On the other hand, 17% of individuals experienced a decrease in household disposable income of over 1%.
As shown in Chart 9 below, a higher proportion of people in households with children (23%) experienced a reduction of income of over 1% of household income. However, only 5% of people in lone-parent households and 1% of people in households with young mothers (i.e. mothers aged under 25) experienced reductions of 1% or more. Conversely, 26% of people in households with at least two earners experienced reductions of 1% or more, compared with 17% of people in households with only one earner. These results imply that the impacts on households with children are largely due to correlations between having children on the one hand and being older (and thus having higher income) and having more earners in the household (and thus standing a higher chance of being impacted by the policy) on the other hand.
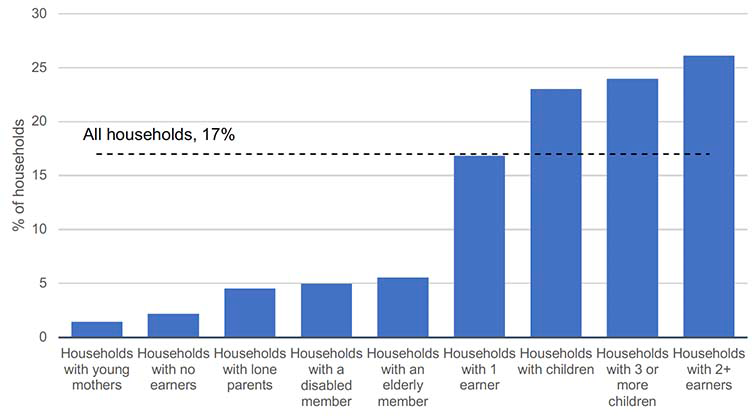
Source: Scottish Government analysis using UKMOD
Protecting low income earners test
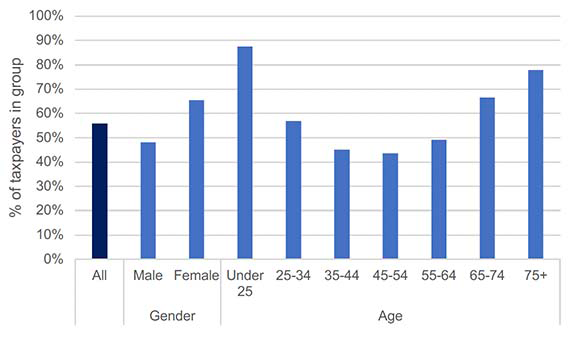
At the time of the Scottish Rate Resolution on 20 February 2018, it was forecast that around 55% of Scottish taxpayers, i.e. those earning less than £26,000, would pay less tax in 2018-19 than if they lived in other parts of the UK[25]. The 2018-19 SPI data allows us to assess this forecast. It shows that 56% of Scottish taxpayers, or 1.41 million individuals, paid less tax than their rUK counterparts in 2018-19. This is broadly in line with the original estimates.
However, the benefits of the reform vary across different taxpayer groups. Since average earnings tend to be lowest amongst young adults and older people, 87% of taxpayers under the age of 25 and 78% of over 75s paid less tax in 2018-19 than they would have done in the rUK. Similarly, relatively more women benefitted from the policy than men. This is because women still tend to have lower earnings, on average, than their male counterparts. This reflects the fact that women take more time out of the labour market to look after family and children, and are often second earners or work part time. Finally, while the gender pay gap has narrowed in recent decades, women continue to be paid less, on average, than their male counterparts for the same jobs.
Our modelling also suggests that any impacts of the Income Tax policy on relative poverty, including child poverty, were negligible[26]. This result is to be expected: relative poverty is a binary measure (someone is classified as being either in or out of poverty); and poverty rates only change when changes in income are sufficiently large and widespread to move a number of households over the poverty line. This issue is magnified by the fact that poverty measures are based on a survey sample, which means that small poverty impacts are difficult to measure.
Contact
Email: martin.davidson@gov.scot