Scottish Income Tax: 2018-19 policy evaluation
A policy evaluation of Scottish Income Tax in 2018-19
5. Revenue test
Revenue test – any Income Tax changes should raise additional revenue, over and above the current policy, to help protect public services in Scotland and support the social contract.
The Scottish Government believes that investment in the economy, public services and the social contract – which goes beyond what is provided in other parts of the UK – delivers benefits for all taxpayers and makes a significant contribution to making Scotland the best place in which to live, work, study and invest.
Our Income Tax policies were introduced at a time when the Scottish Budget had been falling in real terms, with real funding around £0.3 billion less in 2019-20 than 2015-16. Raising additional tax revenue was therefore one of the four policy tests against which the reforms are ultimately to be judged.
5.1 Key findings
- A new empirical study published by HMRC on the 2018-19 Scottish Income Tax reform provides "limited evidence of Scottish taxpayers lowering their declared income in response to increasing tax rates"[11].
- We estimate that the 2018-19 Income Tax policy raised £239 million, compared to implementing the rUK rates and bands. Our estimate is based on HMRC's headline measure of taxpayers' responsiveness to tax changes, as outlined in their study.
- This is about £60 million lower than would have been expected using the estimates of taxpayers' responsiveness and the estimated composition of the Scottish tax base at the time the policy was introduced.
5.2 Summary of results
Overall, we estimate that the 2018-19 Income Tax policy raised between £230 and £300 million in additional revenue, compared to implementing the same rates and bands as the rUK. Our central estimate of revenues raised by the reform is £239 million, based on the headline measure used in a new study published by HMRC on estimating taxpayers' behavioural responses to the policy change. This includes the impact of both the introduction of new rates and bands in 2018-19, and the change in higher rate threshold in 2017-18. This additional money was invested in public services and to support the Scottish economy in 2018-19.
Breaking down the individual parts of the policy, we estimate that the introduction of the Intermediate Rate and the relatively lower uprating of the Higher Rate threshold, relative to the rUK, made the largest contribution to this additional revenue raising
By comparison, we estimate that our decision to raise the Top Rate of Income Tax by 1p to 46p raised limited additional revenues, and might even have resulted in a small loss of receipts. Estimates range from -£6 million to +£5 million, depending on the scale of the behavioural response. However, using HMRC's headline estimate of behavioural responses in their latest published study suggests that the increase to the Top Rate raised revenue.
Table 5 below summarises estimates of the revenue raised in 2018-19 by each component of the policy change. It shows the revenue raised using both the original estimates of behavioural response used at the time the policy was introduced, and the new estimates based on the HMRC study. The estimates for the Top Rate uses behavioural responses estimated for all Top Rate payers collectively, rather than by narrower income bands.
Table 5 also shows how much revenue the policy would be expected to raise if taxpayers did not change their behaviour. As can be seen, the size of the estimated behavioural response generally increases in line with income, as is typically expected.
| Behavioural response used | Total revenue raised | Contribution (£m) to total of… | ||||
|---|---|---|---|---|---|---|
| Starter Rate | Intermediate Rate | Higher Rate | Top Rate | Higher Rate threshold | ||
| Assuming no behavioural response | £378m | -48 | 133 | 85 | 27 | 181 |
| Using original estimates of behavioural response | £302m | -47 | 127 | 62 | 4 | 155 |
| Using new HMRC estimates of behavioural response | £239m | -47 | 125 | 37 | 5 | 119 |
| Range of HMRC estimates dependent on method used | £230m to £245m | -47 | 124 to 128 | 33 to 39 | -6 to 5 | 119 to 125 |
The estimates of behavioural responses in the HMRC study are broadly in line with the international academic literature. As HMRC highlight in their study, several of their estimates are not statistically significant, particularly where the number of taxpayers in the income band being analysed was very small, and consequently the specific results should be interpreted with a degree of caution.
However, despite these limitations, this paper provides new Scotland-specific evidence on behavioural responses to tax policy. In particular, there is evidence that the behavioural responses of Higher Rate taxpayers might have been larger than originally expected. This means that certain elements of the policy reform, namely the Higher Rate threshold freeze and the 1p increase in the Higher Rate, might have raised less than originally anticipated.
Nevertheless, the policy generated additional revenue for the Scottish Budget, as was intended. It had also provided evidence around the extent to which increasing tax rates reduce the amount of revenue raised, due to the changing behaviour of taxpayers.
In many cases, behavioural responses only materialise over time. As such, the results need to be interpreted with a degree of caution as they provide only one piece of additional information in a large body of evidence. We will therefore continue to work in partnership with HMRC, the SFC and other stakeholders to monitor the emerging data about Scottish taxpayers' behavioural responses.
The HMRC study only includes those taxpayers resident in Scotland for three consecutive years, and therefore does not include any migration effects. Separate work by HMRC analysed movement of Self-Assessment (SA) taxpayers between Scotland and the rest of the UK from 2016-17 to 2019-20. This identified a slight decrease in the net migration of SA taxpayers from the rUK to Scotland. However, this was observed across all tax bands, not just those who saw an increase in tax paid as a result of the policy. Additionally, data limitations make it challenging to draw wider inferences from data on SA taxpayers alone.
Despite our updated estimate that the policy should have raised £239 million compared to implementing rUK rates and bands, the net benefit to the Scottish Budget, as measured by the difference between Scottish receipts and the corresponding BGA, was only £119 million in 2018-19.
The reasons for this difference are not clear, but it is likely explained in part by relatively weaker performance in the Scottish economy and the underlying tax base in 2018-19, as well as due to long standing differences in the composition of the tax base. The most recent Scotland's Economic and Fiscal Forecasts [12] released by the SFC discusses possible explanations for this weaker than expected tax revenue in more detail.
Overall, our analysis suggests that the reforms made to the Income Tax system struck an appropriate balance between asking those who can best afford it to pay more while managing the risks of behavioural responses.
5.3 Methodology and Data
In September 2020, HMRC published outturn data on Income Tax for 2018-19, the first year of the five-band system. The data showed that Scottish receipts grew by 5.9% from 2017-18 to 2018-19, compared to 4.2% in the rUK, and raised £119 million more than the corresponding BGA.
However, putting a quantitative estimate on the amount of additional tax that policy reform has raised is not straightforward. Firstly, we will never know for certain how much tax the policy generated as we are comparing the published outturn data against a hypothetical scenario that was not observed in practice.
The choice of counterfactual has a major impact on the estimates of revenue raised. For the purposes of this evaluation, we compare the Income Tax policy implemented in Scotland to a counterfactual where Scottish Income Tax policy was identical to that of the rest of the UK in 2018-19. This is different from the standard approach used in the official forecasts and policy costings produced by the OBR and SFC that underpin the Scottish Budget, which compares to a counterfactual of increasing existing thresholds with inflation.
We depart from the standard approach in this evaluation for two reasons. Firstly, using a counterfactual where Scotland and the rUK have identical Income Tax policy allows us to more easily draw conclusions about the impact of the policy change on the net position, as calculated under the Fiscal Framework. Estimating a counterfactual in which Scotland follows the same Income Tax policy as rUK shows how much the net position could have improved by after policy effects, all else being equal.
Secondly, we view the counterfactual of retaining rUK Income Tax policy as being more pertinent to public discourse on Scottish Income Tax policy. By using rUK Income Tax policy as the counterfactual we are, in effect, comparing current policy to a scenario where Income Tax devolution did not take place. This is not necessarily an appropriate counterfactual for assessing year-to-year policy changes, but it is helpful for informing the debate on the impact of changes made by the Scottish Government following the Scotland Act 2016.
Using a counterfactual of inflationary uprating remains the standard approach by which the SFC produces its official policy costings and forecasts of Scottish Income Tax. It continues to be a meaningful baseline against which to assess future policy changes. However, it should be noted that due to the different counterfactuals used, revenue estimates in this evaluation are not directly comparable to those published by the SFC. As noted above, the SFC's forecasts and costings of policies remain the official forecasts of the Scottish Government and underpin the Scottish Budget.
Regardless of the counterfactual used, an economic model is needed to estimate the revenue in the counterfactual scenario, and therefore the impact of policy reforms. Both the Scottish Government and the SFC use a micro-simulation model of the Scottish Income Tax system which uses detailed micro data from the Survey of Personal Incomes) and allows for insights into the characteristics of Scottish tax base.
This model also provides us with the ability to assess how much could have been raised from the policy reform had taxpayers not changed their behaviour. To aid this approach we continually draw on new evidence that emerges in the economic literature, including working with stakeholders such as the SFC and HMRC to benefit from their internal knowledge and expertise in this area.
5.4 Evidence and scale of different types of behavioural responses
Behavioural responses can cover a wide range of taxpayers' responses to policy changes, including:
- Economic responses: seeking work or increasing the number of hours worked or vice versa;
- Cross-border mobility: taxes could also affect migration, both into and out of Scotland;
- Tax planning or avoidance: shifting income into a more tax-efficient source, such as dividends; or artificially reducing one's tax liability; and
- Evasion: where there is a deliberate (and illegal) attempt not to pay the tax which is due.
Despite extensive research in this area, there is still considerable uncertainty when it comes to measuring taxpayers' behavioural responses to Income Tax changes. There is, however, general agreement in the international empirical literature that responsiveness increases with income, as higher earners have greater means and incentives to limit their tax liability.
Empirically, taxpayers' responsiveness to changes in Income Tax policy are estimated through taxable income elasticities (TIEs), which measure the percentage change in taxable income in response to a one per cent change in the percentage of income retained after tax. A TIE of one implies a one per cent reduction in taxable income for a one percentage point decrease in the percentage of income retained after tax. A TIE of zero would imply taxpayers do not change their income in response to tax policy changes. The more responsive taxpayers are, i.e. the greater the TIE, the larger will be the change in their taxable income and hence tax receipts.
Our analysis of taxpayers' responses to the 2018-19 reform incorporates new information on the first two of the above behavioural responses, using Scotland specific economic data rather than empirical studies based on international evidence.
A) Economic responses
What does the empirical literature tell us about behavioural responses?
Since Income Tax devolution is a fairly recent development and UK and Scottish policies did not diverge until 2017-18, there is currently limited evidence on the behavioural responses of Scottish and rUK taxpayers to increasing policy divergence with the rUK. Instead, both the SFC and the OBR/HMRC rely on empirical findings from across the world, as well as evidence from UK-wide policy changes, to inform their policy costings – none of which are Scotland specific.
As summarised in our 2017 and 2020 analytical papers[13], the international evidence suggests that TIEs tend to fall within the range of 0 to 1 for the top 1% of taxpayers. Estimates tend to be towards the lower end of the range in the Scandinavian countries and Canada, and towards the upper end of the range in the United States. However, more recent evidence suggests that even within the top 1% bracket, behavioural responses may differ and increase with income.
With regard to UK specific studies, the IFS (2017) estimated that top earners' responsiveness to the 2010 change in the UK-wide Additional Rate - where the rate was increased from 45p to 50p, affecting individuals in the top 1% who earn more than £150,000 - ranged from 0.31 to 1, depending on the methodology used.
Lower TIEs of 0.1 to 0.2 are found for those further down the income distribution. This implies that Starter, Basic and Intermediate Rate taxpayers, as well as individuals towards the lower end of the Higher Rate band, will show limited responsiveness to small tax changes.
How does this compare to the new evidence from the 2018-19 reform?
The 2018-19 tax reform provides a unique opportunity to update and test our understanding of taxpayers' behavioural responses in the context of Scottish Income Tax devolution. While limited changes to the Scottish Income Tax regime were implemented as early as 2017-18, these were not expected to have significant behavioural responses, and 2018-19 was the first time that Income Tax rates differed across the different areas of the UK.
We have a long-standing commitment to monitor the evidence base on behavioural responses, both to inform our policy choices and to improve our understanding of the Scottish Income Tax base, as evidenced in our previous work with the Council of Economic Advisers. This year, we have worked in close partnership with HMRC, supported by the University of Westminster and the Fraser of Allander Institute, to use newly available Scottish Income Tax data to assess the behavioural impact of the 2018-19 reform.
This is the first time such an analysis has been attempted in the Scottish context. It represents an important step towards our understanding of the policy impacts of devolution as well as a significant contribution to the wider empirical literature on behavioural responses to tax differentials within countries.
This unique setting – where one group of taxpayers faced a policy change whereas their counterparts elsewhere in the UK did not – lends itself to an empirical methodology called "difference in difference estimation". This involves assuming that Scottish taxpayers' incomes would have grown along the same path as their rUK peers in the absence of the policy change. By analysing the difference in earnings and tax liabilities for both Scottish and a matched group of rUK taxpayers with similar characteristics, the impact of the policy itself can be estimated, while controlling for differences between the two economies[14].
HMRC's study provides "limited evidence of Scottish taxpayers lowering their declared income in response to increasing tax rates", in particular:
- Their findings were broadly in line with the international academic literature and the assumptions currently used by the two independent forecasters, the SFC and the OBR.
- As expected, the scale of the behavioural responses generally increased in line with income as high income earners have greater means of limiting their tax liability.
- Top Rate taxpayers, i.e. those earning more than £150,000, showed the largest behavioural responses. Looking at this group as a whole, elasticities ranged from 0.52 to 0.77, depending on the methodology used. This is slightly higher than HMRC's previous estimate of 0.45 (2012), but in line more recent studies by the MIFS.
- The study also examined how behavioural responses differed within the Top Rate band. However, "results are a little unstable for this group depending on the matching methodology used and this is likely due to the relatively small numbers of taxpayers in these bands." We have presented estimates for these TIEs below, but would caution against using these due to concerns about sensitivity to the matching approach used. In producing estimates of the revenue impact of the policy changes, we have used a single TIE of 0.52 for all Top Rate taxpayers.
- HMRC's study also showed slightly larger than expected behaviour for Higher Rate taxpayers, ranging from 0.12 to 0.46 depending on methodology used. While empirical studies of the behavioural responses of these taxpayers are limited in number, they typically tend to find slightly lower estimates of 0.11 to 0.27. This is in line with our own analysis of the academic literature, as published in our 2020 paper, which found TIEs of 0.1 to 0.2 for those earning less than $100,000 annually[15].
- Once the effects of public sector pay growth, which was faster in Scotland than rUK over the period, are accounted for, HMRC's results also indicate that there is little to no evidence of behavioural effects for Starter, Basic and Intermediate Rate taxpayers. This is in line with our expectations.
Table 6 below shows the TIEs estimated by HMRC by income range, compared to the TIEs used by the SFC, and used to estimate the impact of the policy at the point it was introduced. The three different results shown from the HMRC study are a consequence of using different methods to control for differences between Scottish and rUK taxpayers. Further details are provided in the HMRC study[16]. The range of these results demonstrates the uncertainty in estimating TIEs, and the sensitivity of results to the method used, particularly for higher income taxpayers.
| Income Range | Taxable Income Elasticities (TIEs) | ||||
|---|---|---|---|---|---|
| Lower Threshold (£) | Upper Threshold (£) | SFC estimates | HMRC estimates: headline method | HMRC estimates: alternative method 1 | HMRC estimates: alternative method 2 |
| 11,850 | 13,850 | 0.015 | -0.06 | 0.01 | 0.10 |
| 13,851 | 24,000 | NA | NA | NA | |
| 24,001 | 43,430 | 0.07 | 0.09 | -0.01 | |
| 43,431 | 80,000 | 0.1 | 0.35 | 0.31 | 0.33 |
| 80,001 | 100,000 | 0.2 | 0.27 | 0.40 | 0.40 |
| 100,001 | 123,700 | 0.29 | 0.43 | 0.46 | |
| 123,701 | 150,000 | 0.12 | -0.04 | 0.29 | |
| 150,001 | 300,000 | 0.35 | 0.18 | 0.48 | 0.68 |
| 300,001 | 500,000 | 0.55 | 2.39 | 1.89 | 0.88 |
| 500,000 | Unbounded | 0.75 | 5.45 | 3.79 | 2.89 |
| All Additional/Top Rate Taxpayers | 0.51 | 0.52 | 0.54 | 0.77 | |
This study excludes taxpayers migrating between Scotland and the rUK, and only captures behaviour with regard to the amount of earned income which taxpayers have declared rather than other behaviours, such as out-migration. This issue is turned to later in this section.
B) Cross border mobility
What does the empirical literature tell us about tax induced cross border mobility?
There is a separate strand of the empirical literature which analyses the impact of changes in taxation on peoples' location choices, which we discuss in greater depth in our 2020 publication[17].
International evidence finds small migration responses, depending on country-specific circumstances. Recent studies largely confirm these findings, emphasising that: i) the strength of the mobility response depends on a number of non-tax factors; and ii) small differentials in average tax rates of below 4 percentage points are unlikely to influence people's location choices.
However, many of these academic studies are based on cross border mobility within the United States and as such, their applicability to the Scottish context remains limited. For example, some of these studies might fail to capture the ease with which UK taxpayers with more than one address can switch their residence to lower their tax liability. This 'paper migration' - as opposed to physical migration - is difficult to track in official migration data and will require access to tax returns, which the Scottish Government does not have.
What evidence do we have on cross border mobility in Scotland?
The Office for National Statistics (ONS) and the National Records of Scotland (NRS) publish data on net migration in Scotland on an annual basis, including migration from both the rUK and the rest of the world.
This shows that Scotland has increased its population by just over 8,000 people a year, on average, through net migration from the rest of the UK since 2001-02, although as illustrated in chart 1, there can be significant variation from year to year. Since 2012-13 however, net migration to Scotland from the rest of the UK has been consistently between 8,000 to 11,000 a year.
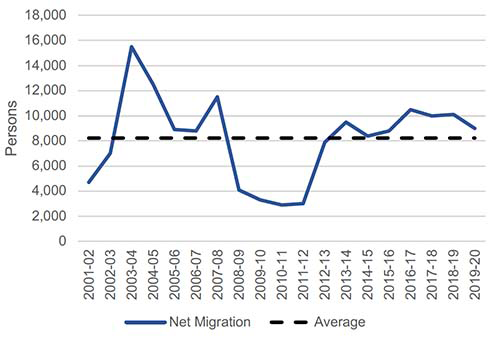
Source: National Records of Scotland
People base their decisions as to where to live and work on a wide range of factors, including differences in housing costs or opportunities in the local labour market. Tax is only one of such factors. It is therefore difficult to empirically test whether a tax policy change, such the 2018-19 Scottish Income Tax reform, had any statistically significant impact on migration patterns to Scotland.
However, the published net migration data provides no strong indication that our Income Tax policy had a negative impact on net migration to Scotland, at least not at the aggregate level. In fact, in 2018-19 net migration to Scotland remained above average and actually increased slightly relative to 2017-18. There is also no evidence that net migration in 2018-19 was more, or less, volatile than has historically been the case.
Using data produced by the ONS and NRS on net migration by age group between Scotland and the rUK, there was a decrease in the net migration of those aged 16-34 in 2018-19, although this was more than offset by increased net migration for all other age brackets. Again there is no evidence to suggest this is related to tax changes relative to other wider socio-economic factors.
Ultimately, there are limitations to this analysis as the data only allows us to track physical movements of the entire Scottish population rather than changes in tax residency, which sometimes occur only on paper.
We therefore worked in partnership with HMRC to analyse tax returns for SA taxpayers in the UK over the period 2016-17 to 2019-20. While this allows us to track residency changes of individual taxpayers over time, this approach is not without challenges. For example, a taxpayer may complete an SA in one year but not the next for a variety of reasons, including:
- their tax affairs are changing and they are no longer required to fill in an SA return.
- they are self-employed but earn less than the Personal Allowance.
- they become resident abroad and cease to have any income from the UK.
It is not possible to determine from the data why a taxpayer does not appear in each year of the dataset. SA taxpayers also make-up only about 17% of taxpayers in Scotland. These taxpayers will not be a representative sample of the whole population of taxpayers. Analysing their migration choices therefore does not allow any definitive conclusions to be drawn about the impact of migration on the Scottish tax base overall.
Keeping in mind these limitations, the analysis shows some reduction in the net migration of SA taxpayers into Scotland following the changes in Income Tax policy. From 2016-17 to 2017-18 (before the policy change) there was a net gain of around 1,400 SA taxpayers moving to Scotland from the rest of the UK. This fell to a net increase of around 500 SA taxpayers from 2017-18 to 2018-19 (the year the policy was introduced), before falling further to a net decrease of 75 SA taxpayers from 2018-19 to 2019-20, after the policy's introduction.
However, this reduction in the net migration of SA taxpayers occurs both in bands in which rates were increased, and in groups unaffected by the policy change (see chart 2 below). This suggests that the reduction in SA taxpayers moving to Scotland from rUK may have been driven by factors other than the policy change. However, further analysis would be needed to draw robust conclusions. As noted above, in aggregate, migration from rUK to Scotland remained around its historic levels.
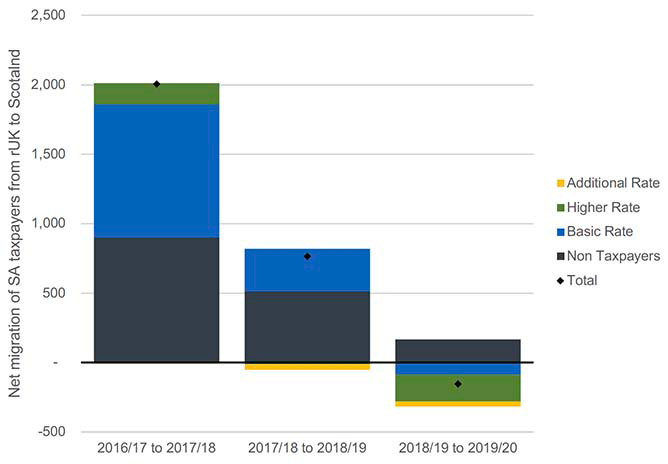
Source: HMRC analysis of self-assessment tax data
Moreover, migration between Scotland and rUK makes up only a small proportion of the change in the Scottish SA taxpayer base. Chart 3 below decomposes the change in the Scottish SA taxpayer base into the net migration of taxpayers between Scotland and rUK; the net impact taxpayers either entering or leaving SA; or changing taxpayer status, i.e. remaining in Scotland but becoming or ceasing to be a taxpayer. It shows that the impact of the latter two sources of change is significantly greater than the impact of cross-border movements. In this analysis, HMRC are not able to track those individuals who leave or enter SA. It is therefore possible the net change in those entering/leaving SA in Scotland is partially driven by individuals moving to or from Scotland and (simultaneously) to or from the PAYE system into SA. This adds further uncertainty to this analysis, and makes it challenging to draw any definitive conclusion on migration impacts.
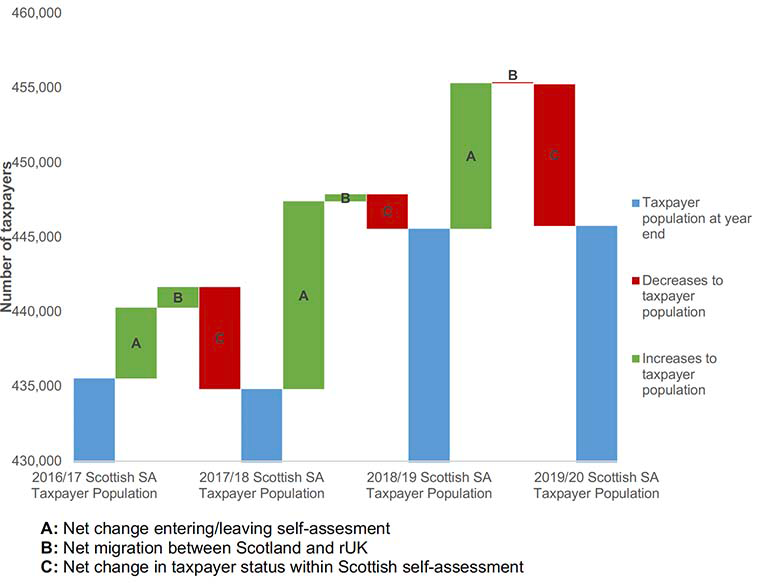
Source: HMRC analysis of self-assessment tax data
The uncertainty is compounded by the fact that a net loss or gain in the number of taxpayers does not necessarily correspond to an equivalent change in revenue. Table 7 below shows the net migration in taxpayers, and the total net impact of those movements on tax liabilities. Despite the fall in net migration in the year the policy was introduced, the net impact of migration of tax liabilities increased. This further complicates drawing any conclusions about the impact of migration on revenue from the data available to us.
| Years | Net migration of SA taxpayers between Scotland and rUK (no. of people) | Net change in liabilities due to migration of SA taxpayers between Scotland and rUK (£m) |
|---|---|---|
| 2016/17 – 2017/18 | 1379 | 9.3 |
| 2017/18 - 2018/19 | 468 | 18.1 |
| 2018/19 – 2019/20 | -75 | -0.1 |
Overall, while HMRC's analysis showed a decline in net migration of SA taxpayers from rUK to Scotland, it is not possible to draw robust conclusions on whether the 2018-19 changes caused any substantial net movement of taxpayers from rUK to Scotland or vice versa.
5.5 Implications for Scotland's Income Tax net position
As noted above, the net benefit to the Scottish Budget, as measured as the difference between Scottish receipts and the corresponding BGA, was £119 million in 2018-19.
This is lower than any of our earlier estimates of the amount of revenue that could have been raised by the policy compared to implementing the same rates and bands as the rUK. While our estimates are uncertain, a difference of this magnitude suggests there are other factors that partially offset the positive revenue impacts of the policy change.
As noted in section 3.1, under the Fiscal Framework, Scotland's budget position improves if tax receipts per head grow more quickly in Scotland than in the rUK (and vice versa). This will be affected by policy changes in both Scotland and rUK, but also a number of economic factors:
- Growth in earnings, pensions and property income: growth in wages is one of the key drivers of Income Tax performance.
- Growth in the number of taxpayers: This in turn depends on growth in the (working age) population, the performance of the Scottish labour market as well as decisions around the UK-wide Personal Allowance which may lift some taxpayers out of paying tax altogether. The Fiscal Framework partially protects Scotland against its relatively slower population growth as it operates on a per head basis, but will not account for, for example, demographic changes that reduce the growth rate of the working age population.
- The composition of the tax base, including the relative contribution of high income taxpayers and their earnings growth.
Differences in any of these economic factors between Scotland and rUK could potentially explain the gap between the estimates of revenue raised by the policy change and the net impact on the Scottish Budget in 2018-19.
Annex B of the January 2021 Medium Term Financial Strategy (MTFS)[19] includes analysis of two specific hypotheses that could explain the slower than expected tax revenue growth in Scotland in 2018-19.
Firstly, sectoral differences in the Scottish and rUK economies, including persistent effects from the global oil price crash in 2015-16 weighing on tax revenue in the North East of Scotland. Illustrative modelling in the MTFS estimated that a temporary $30 fall in the global oil price could, in the absence of any policy interventions, reduce Scotland's Income Tax net position by between -£100 and -£200 million across two years, largely due to lower average earnings growth relative to the rUK.
Secondly, differences in the distribution of the Income Tax base in Scotland and the rest of the UK. In 2018-19 the proportion of taxpayers earning £100,000 or more was considerably higher in the rest of the UK than in Scotland (2.6% vs. 1.7%) whilst incomes per head in that cohort were also 21% higher in the rUK. Consequently, UK-wide factors that have a disproportionate impact on the incomes of top earners will have a relatively larger effect on rUK receipts. There is evidence from a range of data sources that earnings growth is unequally distributed across the income distribution as earnings tend to grow more strongly at the bottom and top end of the income spectrum. For example, the SFC have previously noted that individuals at the very top end of the income distribution in the UK (i.e. within the 99th percentile) have seen their incomes grow significantly faster since 2002, compared with Scottish individuals[20].
The weaker than expected tax performance in 2018-19 likely reflects a combination of these factors, as well as a potentially broader-based difference in economic performance between Scotland and rUK. Understanding differences in the economies and tax base of Scotland and rUK remains an area of ongoing analysis for the Scottish Government. Furthermore, since differences in the composition of the tax base were already evident when the current Income Tax powers were devolved, the Scottish Government has called for the issue to be considered as part of the upcoming review of the Fiscal Framework.
Contact
Email: martin.davidson@gov.scot