The Scottish Government's Medium Term Financial Strategy
This is the fourth Medium Term Financial Strategy (MTFS) published by the Scottish Government. The MTFS provides the context for the Scottish Budget and the Scottish Parliament.
Annex A: Income Tax - Distributional Risks to the Scottish Budget
As noted in the January 2021 MTFS publication[14] compositional differences in the Scottish and rUK Income Tax bases can pose a risk to the Scottish Budget, particularly if earnings growth or tax revenue growth is not uniform across the income distribution.
In this annex we look at these concerns in more detail. We begin by undertaking illustrative modelling that investigates how sensitive relative tax revenue growth can be based on tax base distributional differences between two different hypothetical taxpayer populations. These go on to show that even if earnings growth is identical in both tax bases, unless it is completely uniform across the income distribution, then tax base compositional differences can mean that tax per head growth is not equal.
In turn, this could pose a risk to the Scottish Budget and we go on to discuss how some of these issues may materialize in practice in the context of Scottish Income Tax. We then consider some possible solutions to manage these risks, which we argue should be considered as part of the Fiscal Framework Review in 2022.
Tax base distributional differences between Scotland and the rUK
Income Tax devolution in Scotland has only been in operation for a relatively short period of time and our understanding of Scotland's Income Tax base is continually evolving as new sources of data are published.
As well as variations between Scotland and the rUK in the sectoral composition of each economy, or in the demographic characteristics of the population, there are also significant differences in the distribution of the Income Tax base[15]. Most importantly, there are relatively fewer high-Income Taxpayers in Scotland than in the rest of the UK and their earnings are also typically lower.
Updating work published in our previous MTFS publication in January 2021, Figure A.1 below shows some further analysis of the 2019-20 outturn data published in July 2021. This broadly reiterates previous findings showing that Scotland had relatively more taxpayers in the £15,000 to £43,000 NSND income bracket than in the rUK excl. Wales.[16] However, significant differences start to emerge at the higher end of the income distribution. For example, the proportion of taxpayers earning £100,000 or more was considerably higher in the rest of the UK excluding Wales than in Scotland (2.9% vs. 1.8%) whilst incomes per head in that cohort were also 24% higher in the rUK[17].
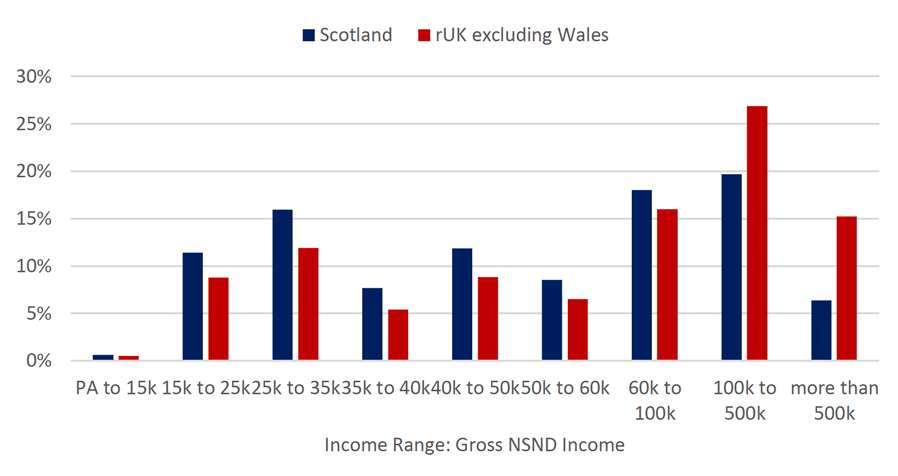
HMRC 2019-20 NSND Income Tax Outturn Statistics
As a result, Scotland raised a relatively smaller proportion of liabilities from individuals earning £100,000 or more in 2019-20 (26% vs. 42%).
A key concern for Scotland's Budget is whether or not these distributional differences then have a material impact on how quickly Income Tax revenues grow in both Scotland and the rUK over time.
Illustrative scenario analysis
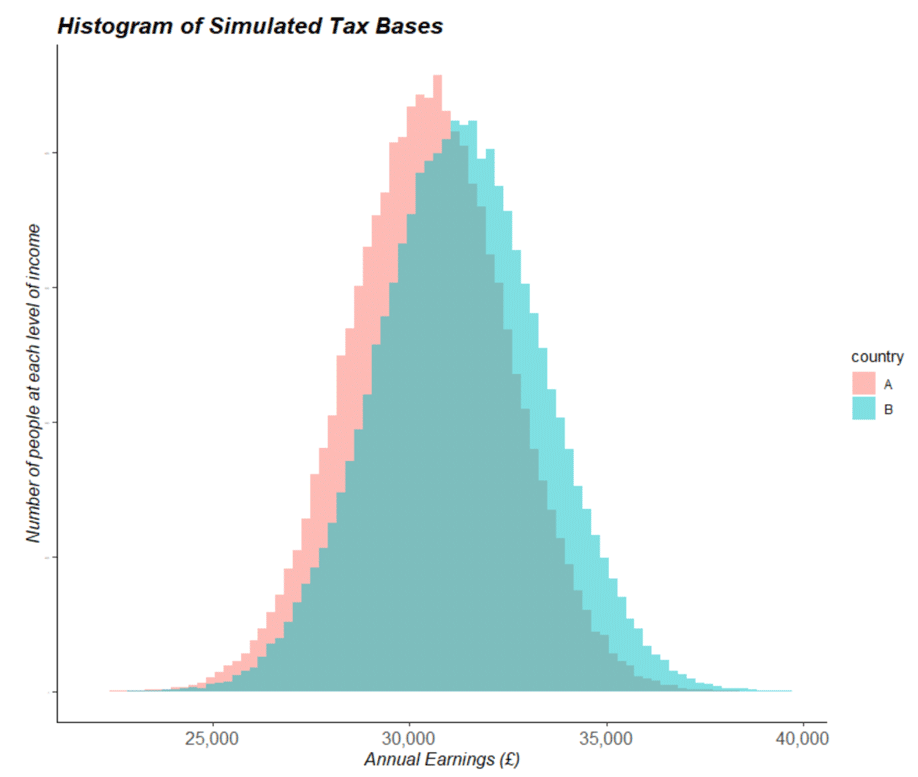
One method to explore this issue in more detail is by applying illustrative scenario analysis. For example, consider two simulated tax bases shown below in Figure A.2. These are artificially generated tax bases for 2 hypothetical countries – A and B[18]. Both countries have a 100,000-person labour force although country B's labour force has marginally higher average annual earnings of £31,300 relative to country A with average annual earnings of £30,500[19]
It is then possible to construct an illustrative progressive Income Tax system, apply this equally in both countries and calculate the amount of tax generated in each country as laid out in Table A.1.
| Tax rate | Share % of Labour Force (Country A) | Share % of Labour Force (Country B) | |
|---|---|---|---|
| Earnings below £26,500 | 0% | 2% | 1% |
| Earnings between £26,500 and £32,000 | 20% | 75% | 62% |
| Earnings between £32,000 and £34,000 | 40% | 19% | 27% |
| Earnings above £34,000 | 45% | 4% | 10% |
| Average Annual Earnings | Average Tax Paid per Person | |
|---|---|---|
| Country A | £30,500 | £858 |
| Country B | £31,300 | £1,076 |
| Ratio A/B | 97% | 80% |
Although these are artificial simulations for illustrative purposes, there are intentionally constructed similarities with devolved Non-Saving Non-Dividend (NSND) Income Tax between Scotland and the rUK. We know that Scotland, whilst having a broadly similar shaped taxpayer base to the rUK in the middle of the income distribution, does have relatively fewer top end taxpayers and relatively more taxpayers at the lower end of the income distribution.
We also know that, in the baseline year when NSND Income Tax was devolved, tax per head in Scotland was around 80% the level of that in the rUK despite evidence that the level of average earnings in Scotland was broadly similar to the UK as a whole.
However as noted above, the primary concern is not the relative level of tax per head between Scotland and the rUK but rather it is the relative rate that tax per head grows over time. Under the Fiscal Framework, if tax per head in Scotland grows faster than in the rUK the Scottish Budget is better off, and it is worse off if tax per head grows at a slower pace than in the rUK.
The following scenario analysis examines how earnings growth, the shape of the income distribution and tax per head growth interact with each other and what this might mean in terms of risk to the Scottish Budget via the current Fiscal Framework.
The first scenario simply grows the earnings of every single taxpayer in both countries by the same uniform growth rate of 2%[20] across the income distribution.
As can be seen in Table A.2, as long as earnings grow uniformly by the same rate in both countries, and as long as tax thresholds in both countries also grow by the same rate, then both average earnings and the average tax paid per head grows symmetrically by 2% in each country.
| Growth (%) | ||
|---|---|---|
| Average Earnings (£) | Average Tax per Head (£) | |
| Country A | 2.0% | 2.0% |
| Country B | 2.0% | 2.0% |
In other words, the different levels of tax per head and the differences in the taxpayer earnings distribution has no impact on the overall relative growth of each countries tax base, as long as earnings growth is uniform across the tax base distribution and the tax system thresholds are also adjusted in tandem to avoid fiscal drag (that is, people moving into higher tax bands as a result of a faster earnings increases relative to the increase in the tax thresholds).
However, it is not necessarily the case that earnings grow uniformly across an entire income distribution. For example, the latest data from HMRC's Real Time Indicator database for September 2021 shows that annual pay growth for employees in the PAYE system in the UK has not been even across the distribution with higher earnings growth for the top earning PAYE employees. In fact, the top 1% of PAYE employees saw annual average pay growth in September almost twice that of the bottom 10% of PAYE employees.
| Percentile | |||||||
|---|---|---|---|---|---|---|---|
| 10th | 25th | 50th | 75th | 90th | 95th | 99th | |
| Annual Earnings Growth (%) | 3.70% | 5.30% | 6.00% | 5.90% | 6.10% | 6.60% | 6.90% |
ONS: HMRC RTI Earnings and Employment data
Although pay discrepancies are not always skewed in such a fashion (for example across 2016 pay growth was much stronger for the bottom 25% of PAYE employees than elsewhere in the income distribution) it is unusual historically for earnings growth to be uniform across every income decile.
Consequently, the following scenarios look at the impact of uneven earnings growth across the income distribution. Scenario 2 allows those at the top end of the income distribution in both countries to have their earnings grow 1 percentage point faster than those at the lower end of the income distribution. This is again a relatively arbitrary choice of growth rates, although it somewhat mirrors the latest RTI data for September 2021 where earnings growth at the very top of the employee income distribution was around one percentage point higher than the median employee. However, the scale of the difference does not change the overall pattern of the results.
Table A.4: Scenario 2 - 2% growth in earnings for taxpayers in country A and B earning below £34,000 and 3% earnings growth for all taxpayers in country A and B earning above £34,000
| Growth (%) | ||
|---|---|---|
| Average Earnings (£) | Average Tax per Head (£) | |
| Country A | 2.0% | 2.7% |
| Country B | 2.1% | 3.5% |
As can be seen, despite earnings growth at each level of income being the same in both countries, the differences in the tax base distribution causes average earnings growth to be marginally higher in Country B, and more importantly for tax per head growth to be significantly higher.
This highlights the fact that if earnings growth is not uniform across all levels of earnings, then differences in the tax base distribution do start to matter in terms of comparing the relative growth of tax per head in each country.
Scenario 2 is weighted in Country B's favour. We know that Country B has disproportionately more taxpayers in the higher end of the income distribution and consequently faster earnings growth in this area not only results in higher overall average earnings growth than in Country A, but because of the progressive nature of the tax system disproportionately higher tax per head growth.
Scenario 3 instead considers a situation where earnings growth is not just higher for those in the higher end of the income distribution, but also for those at the lower end of the distribution where Country A has a comparative advantage. Again, the choice of earnings growth rate differential is relatively unimportant (as long as it is uneven across the distribution) and does not alter the overall narrative of the findings. However, it has been purposely calibrated to ensure that overall average earnings growth is equal in both Country A and B.
| Growth (%) | ||
|---|---|---|
| Average Earnings (£) | Average Tax per Head (£) | |
| Country A | 2.2% | 3.7% |
| Country B | 2.2% | 4.0% |
As can be seen from Scenario 3, despite both Country A and B having the same average earnings growth of 2.2% and despite both countries having the same exact growth rates at every single level of income, the distributional differences in their tax bases and the progressive nature of the tax system means that Country B still grows its average tax per head faster than Country A.
Consequently, even if average earnings in each tax base grow at equal rates over time and earnings at each level of income grow at the same rate in each country, differences in the tax base distribution means that tax per head can still grow faster in one tax base relative to the other.
Implications for the Fiscal Framework
The results from this scenario analysis have specific relevance to the Scottish Budget and the current Fiscal Framework. It suggests that there is a risk that even if Scotland grew its economy and/ or average earnings at the same rate as the rUK, the Scottish Budget could be made worse off if earnings growth is not uniform across the income distribution due to the differences in the structure of the existing tax base.
Were there to be a sustained difference in earnings growth at higher marginal tax rates (even if it were the same in both Scotland and the rUK) then the different structure of the tax base could result in tax per head receipts growing persistently slower in Scotland relative to the rUK over time. This could then potentially undermine the long-term sustainability of the current Fiscal Framework. Even if the Scottish and rUK economies saw similar earnings growth the Scottish Budget could still be worse off, arguably a contradiction with the Smith Commission principles. Consequently, it is imperative that tax base distributional risk is considered in the upcoming Fiscal Framework Review in 2022.
The importance of addressing this risk has already been demonstrated in Wales. The Welsh Fiscal Framework incorporates a "by-band" component into the Block Grant Adjustment mechanism to address similar concerns around the differences in the Welsh tax base distribution relative to the rUK.
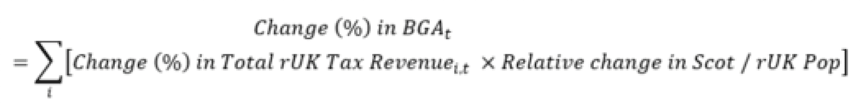
For example, Figure A.3 below shows how the Indexed Per Capita (IPC) Block Grant Adjustment (BGA) mechanism currently operates for devolved Scottish taxes. The key thing is that the BGA grows in line with the growth in total rUK tax revenue which is then weighted by differences in population growth between Scotland and the rUK.

A possible solution to tax base distributional risk is outlined in Figure A.4 below. Effectively there are individual BGAs by each tax band notated by the subscript " i ". Using the example of Income Tax, the rUK has 3 tax bands, the Starter Rate, Higher Rate and Additional Rate. Each band is given its own individual BGA which is then aggregated into a final total BGA.
This by band mechanism helps control for any disproportional tax per head growth from various parts of the income distribution by effectively growing the BGA by a weighted average, where the weights reflect how much was originally raised by band in Scotland in the baseline year.
Table A.6 below shows the BGA calculated using this IPC by band approach, compared to the existing IPC approach. Such a mechanism helps control for periods where tax base distributional differences are driving the faster relative growth in tax per head between Scotland and the rUK. For example, between 2016-17 and 2019-20 around 42% of the cumulative increase in total rUK NSND Income Tax revenue was solely driven by an increase in tax revenue paid by Additional Rate taxpayers in the rUK (1.2% of the tax base). In comparison in Scotland only 19% of the cumulative increase in total Scottish NSND tax revenue was driven by an increase in tax revenue paid by Additional Rate taxpayers (0.6% of the tax base). This is despite the fact that the amount of tax paid per person for Additional Rate taxpayers in Scotland grew by almost 6% between 2016-17 and 2019-20. Almost six times faster than the 0.8% growth in tax paid per person for Additional Rate taxpayers in the rUK across the same time period.
| (£m) | 2016-17 | 2017-18 | 2018-19 | 2019-20 |
|---|---|---|---|---|
| IPC BGA | 10,719 | 11,013 | 11,437 | 11,685 |
| IPC By Band BGA | 10,719 | 10,962 | 11,343 | 11,600 |
| Difference | -52 | -94 | -84 | |
| Cumulatively | -230 |
To conclude, the illustrative scenario analysis demonstrates that the relative composition of two different tax bases can have a material impact on the relative growth rates of tax revenue generated per person. It can be the case that even if average earnings growth in both tax bases is the same, and even if the growth rate of earnings is the same at each level of income, tax per head can still grow faster in one tax base relative to the other due to compositional differences.
There are solutions to mitigate this risk, such as using an alternative "By-Band" Block Grant Adjustment mechanism inspired by a similar approach used in the Welsh Fiscal Framework . As shown in Table A.6 above, the Scottish Budget would have been cumulatively better off across the three years by £230m had such a mechanism been in place for devolved Income Tax since 2016-17. The significant impact such a mechanism would have had on the Scottish Budget across a relatively brief period of time, highlights the need for tax base compositional risk to be considered as part of the upcoming review of the Fiscal Framework.
Contact
Email: sophie.osborn@gov.scot