Publication - Research and analysis
Scottish economic bulletin: December 2025
Provides a summary of latest key economic statistics, forecasts and analysis on the Scottish economy.
Consumer Activity
The Scottish Consumer Sentiment Indicator improved by 1.5 points to -6.6 in October.
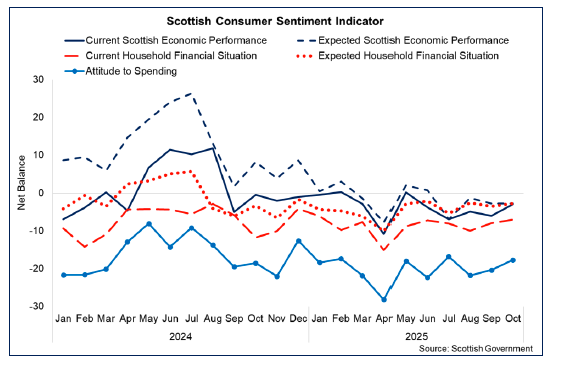
Consumer Sentiment
- The Scottish Consumer Sentiment Indicator (SCSI) reflects how people feel the economy is performing, how secure they feel about their household finances and how relaxed they feel about spending money.
- In October, the consumer sentiment indicator’s net balance strengthened to -6.6 (up from -8.1 in September), however remained lower compared to the same point last year (down 1.5 points).[28]
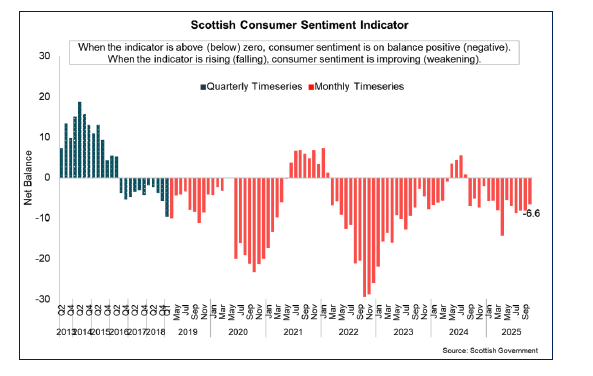
- The strengthening in sentiment over the month was driven by improvements in four of the five sub-indicators, most notably those measuring current economic performance and attitudes to spending, which were up by 3.1 and 2.7 points, respectively. Sub-indicators measuring current and expected security of household finances also improved, rising by 1.0 and 0.7 points, respectively. The remaining sub-indicator, measuring expected economic performance remained unchanged from September.
- Despite the strengthening in the indicators for attitudes to spending, its net balance remains the most negative (‑17.6), reflecting the ongoing challenges facing household budgets.
- More recently at a UK level, the GfK Consumer Confidence Index fell by two points to -19 in November. This was driven by a decline in sentiment on all measures of consumer confidence, with the Major Purchase Index falling most notably (down by 3 points) further reflecting households caution about spending.[29]
Spending and Cost of Living
- More stable inflation expectations and the reduction in interest rates are supportive of conditions for stronger consumer and household activity growth, however cost of living challenges and weakness in consumer sentiment are continuing to weigh on activity.
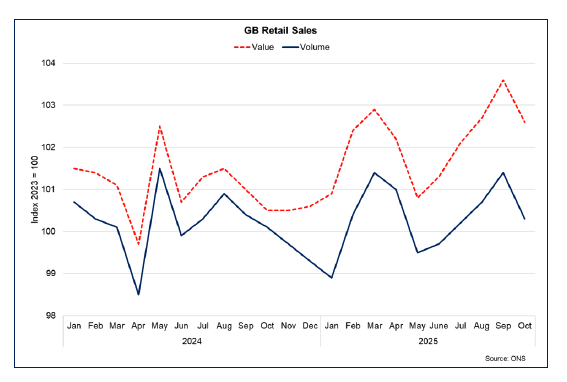
- At a GB level, retail sales growth has strengthened moderately in 2025 following a fall over 2024. Latest data for the three months to October show sales rose by 1.1% in volume terms and by 1.7% in value terms. Over the past year they have risen by 0.4% and 2.0% respectively.[30]
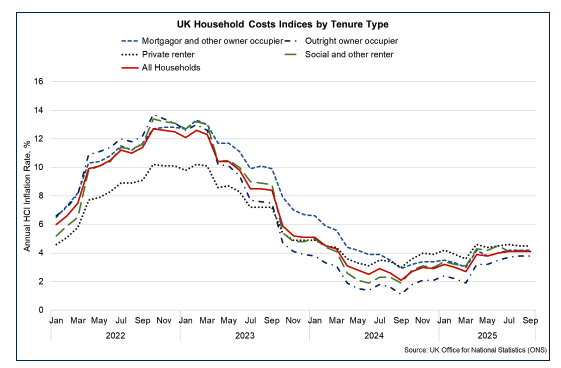
- Consumers continue to face cost of living challenges. As set out above, CPI inflation fell to 3.6% in October, however inflation is experienced differently across households. The Household Costs Indices (HCIs), which complement the CPI, measures inflation experienced by different household groups.[31]
- The HCIs show that household costs in the UK rose by 4.1% in the year to September for the average household. Considering the annual inflation rates for different housing tenure groups, outright owner-occupier households saw the lowest inflation rate (3.8%), while private renter households saw the highest rate (4.5%). Mortgagor and other owners as well as social and other renters saw annual inflation rates of 4.2% and 4.1% respectively.
- The differences in annual inflation rates experienced by the different housing tenure groups in September were primarily due to housing costs. Private rental costs contributed 1.59 p.p to the annual rate of inflation for private renters, while mortgage interest payments contributed 0.64 p.p to mortgagor households.
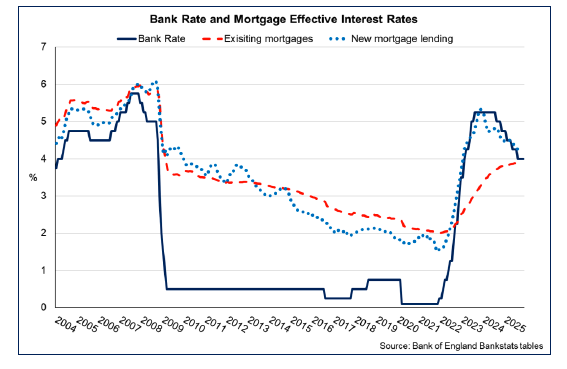
- The gradual loosening in monetary policy over the past year following the sharp tightening is progressively feeding through the economy. The effective interest rate on new mortgages continued to fall in October to 4.17% (down from 4.19% in September) while the effective rate on the stock of existing mortgages remained stable at 3.89% in October.[32]
- However, while inflation is forecast to come down from its current rate, consumers continue to face cost pressures. The energy price cap is increasing slightly by 0.2% in January 2026 to £1,758 per year for a typical household who use electricity and gas and pay by direct debit.[33]
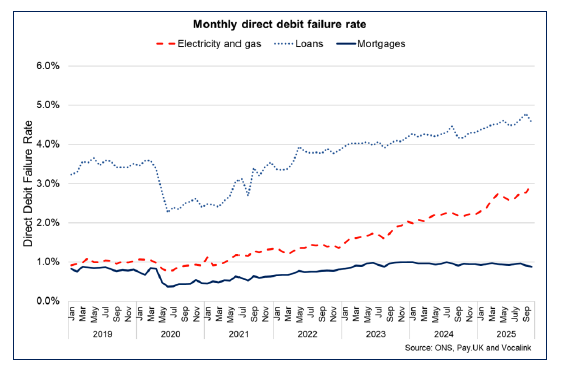
- At a GB level, direct debit failure rates due to insufficient funds data show that the failure rate for electricity and gas payments has continued on its upward trend to 2.98% in October, up from 2.77% in September and is at its highest rate since the series began. [34]
- Direct debit failure rates for loans also remains elevated but marginally lower in October (4.57%, down from 4.79% in September). Failure rates for mortgage payments remain relatively low, with the rate also falling marginally in October to 0.88%, down from 0.91% in September).
Contact
Email: economic.statistics@gov.scot