
Prevention toolkit
The Prevention toolkit curates some of the latest tools in active use across the Scottish public sector to analyse prevention. It provides practical guidance on how to use these tools and links to further resources.
Tool 6 – Avoided Cost Modelling
The Tool
- An avoided cost model is typically used in an organisational setting to understand the impact of an intervention on reducing future public service costs and negative outcomes. It uses established appraisal techniques but is often used for producing quick assessments of the return on investment of planned spending.
Use this to
- Develop timely estimates of the avoided costs of an intervention, that is based on information on the costs and benefits of the activity and balances robustness with time and resource.
You end up with
- An estimate of avoided costs or return on investment, accounting for costs of the intervention and the potential benefits over time to public services, the economy and wider society.
Who can use this?
- Avoided cost modelling has been designed to be a relatively simple, proportionate model for anyone seeking to develop preventative investment proposals for a budget or bidding process.
How does this tool support prevention thinking?
- Avoided cost modelling supports the case for preventative investment by providing a quick/ proportionate model for illustrating how an intervention will lead to reduced costs across different public sector departments, the wider economy and society
- Avoided cost modelling should be developed in conjunction with a plan for wider appraisal and evaluation when time allows (see Tools 7 and 8).
Using the Tool
Overview
Avoided cost models are a type of model for calculating return on investment. They typically focus on the estimation of fiscal costs, benefits and return on investment to the public sector, with some consideration of wider economic and social impacts where possible. It adheres to Green Book guidance around appraisal, but is typically tailored to quick deployment in an organisational setting (e.g. a budget process).
An avoided cost model typically involves a structure as follows:
- Step 1: Specify the intervention – what is the intervention, how does it work, and who will be impacted by it.
- Step 2: Project baseline service use – project the expected service use by the cohort you are trying to target.
- Step 3: Project post-intervention service use – Calculate the expected service use of the cohort after an intervention.
- Step 4: Calculate avoided costs – subtract the post-intervention service use from the baseline service use.
- Step 5: Adjustmentsand scenario testing – to account for different factors such as discounting, coverage, attribution and deadweight. Modelling should also test different scenarios by changing key variables.
- Step 6: Results – present and frame results for decision makers.
Step 1 – Specify the intervention
Before any modelling begins, the intervention must be clearly specified in terms of its purpose, mechanism, and target population. This involves defining what problem the program seeks to address is, how it is expected to change behaviours or outcomes, and which group it is designed to benefit.
A hypothetical example intervention could be a 12‑month mentoring programme for high-risk 13–17 year‑olds, which aims to reduce first-time offending by improving engagement with school. This could be delivered through weekly sessions with trained mentors target 100 eligible young people identified by risk criteria (e.g. prior exclusions, police contact).
A simple theory of change is typically articulated, linking program activities to short- and long-term outcomes (see Green Book for more information on logic modelling). This step ensures the modelling is grounded in a coherent logic around how the inputs impact on outputs. This ensure that subsequent estimates of impact are appropriately targeted to the right population and outcomes.
Step 2 – Project baseline service use
Here the goal is to model what happens to the target cohort in the absence of any intervention. This involves projecting how individuals move through government systems over time, including justice, health, child protection, and welfare.
In developing the baseline, you should use any data available on the likelihood of individuals within the cohort experiencing an issue that leads to public service use, and for how long.
For example: without intervention, 30% of the cohort are expected to offend within a 2‑year period, with each offence generating justice system contact lasting an average of 6–12 months (from police involvement through courts and potential supervision).
Using this information and any available cost estimates for contact with public services (e.g. the cost of a case going through the justice system), you should be able to generate a long-term cost profile representing the government’s expected expenditure if no action is taken. The cost profile is typically illustrated in cost per year.
Step 3 – Project post-intervention service use
This step adjusts the baseline trajectory to reflect how outcomes are expected to change as a result of the intervention.
Rather than rebuilding the model, the existing probabilities of adverse events are modified using robust, evidence-based effect sizes. These adjustments may reduce the likelihood of an event occurring, delay its onset, or lessen its severity and duration.
In our hypothetical example, it may be applying an evidence-based effect (e.g. 10 percentage point reduction in offending) such that the expected offending rate falls to 20%. This would reduce interactions with justice services and lowering overall projected service use across the cohort.
The result is an updated projection of how the cohort interacts with public services over time under the intervention scenario. This produces a revised cost profile that captures both immediate and longer-term changes in service use attributable to the intervention.
Step 4 – Calculate Avoided Costs
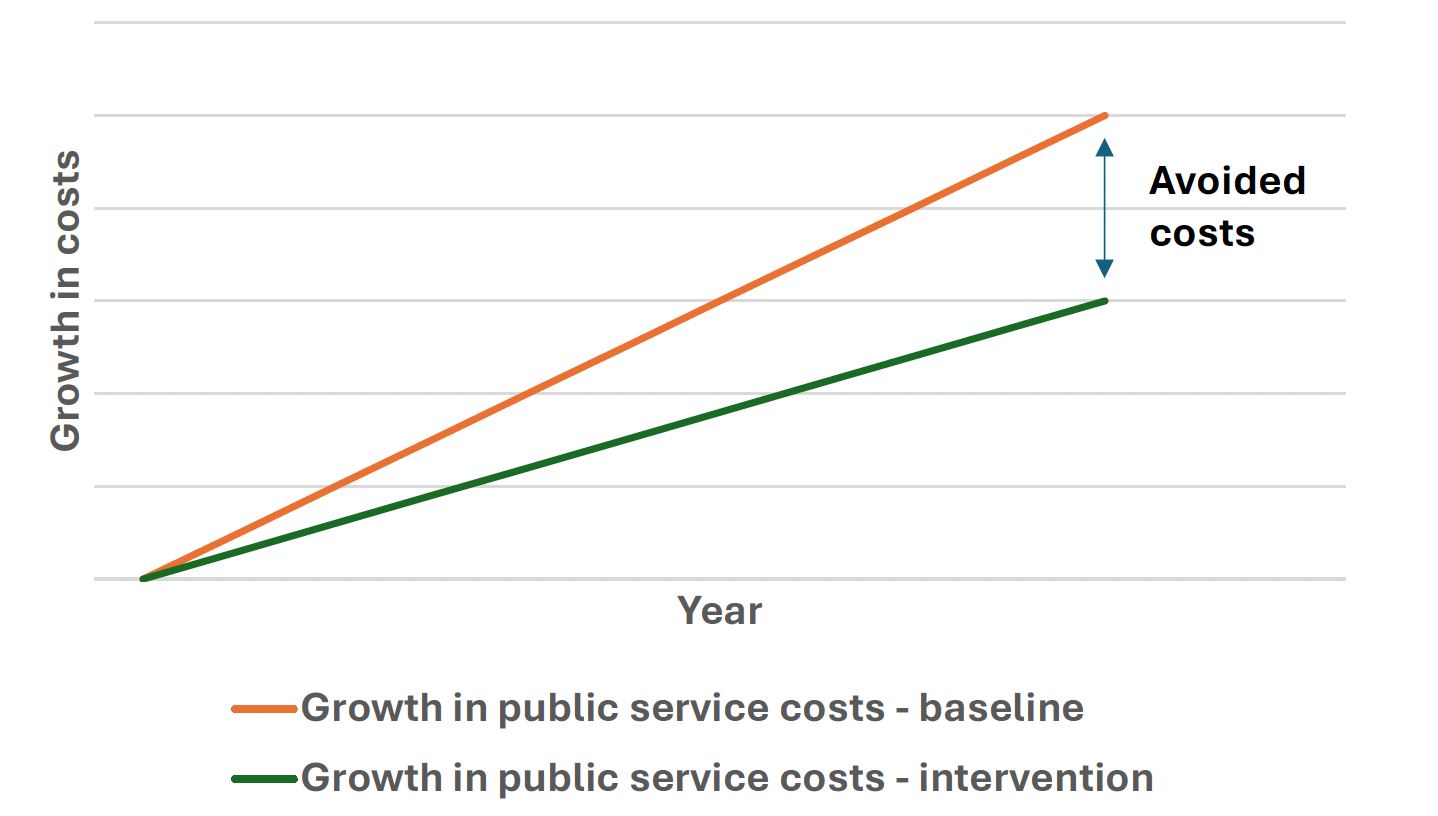
Once both intervention and baseline scenarios have been calculated, the expected cost under the intervention scenario is then subtracted from the baseline cost. This yields a stream of “avoided costs,” representing the reduction in government expenditure attributable to improved outcomes.
In our example: the difference between baseline and intervention scenarios (10 fewer offences) could generate £80,000 in avoided justice system costs, with savings for policing, courts, and custody over the 2-year period. Figure 13 provides an illustration of the avoided costs generated from reducing public service demand over time. Similar charts could be produced for impacts to individual wellbeing, wider economic and societal impacts, if the modelling covers these costs and benefits.
These differences may vary over time, with some savings appearing immediately and others emerging years later. The calculation is typically performed separately across different service domains and then aggregated to produce a comprehensive estimate of annual savings.
Step 5 – Adjustments and Scenario Testing
Once avoided costs are calculated, this is not the end of the process. There are a number of adjustments that must be considered to improve the credibility of findings. These adjustments are set out in the Green Book and include:
- Participation adjustment – Not all eligible individuals will receive or complete the intervention, so any estimate of avoided costs should scale the avoided costs to reflect actual participation rates.
- Persistence and decay of effects - Intervention effects are rarely permanent, so the model should account for how impacts diminish over time. This is done by applying “persistence or decay factors” to the avoided costs in each future year. For example, the full effect may be realised shortly after the intervention but gradually weaken as individuals’ circumstances change, or there may be a delay before the benefits are realised.
- Attribution and deadweight adjustment – Any estimate should refine the results to ensure that only outcomes directly caused by the intervention are counted. This involves removing “deadweight,” or improvements that would have occurred even without the program, and adjusting for attribution where multiple factors influence outcomes.
- Discounting to present value - Because many benefits occur in the future, the model applies a “discount rate” to convert them into present-value terms. This reflects the principle that a pound saved today is worth more than a pound saved in the future due to time preference and opportunity cost.
In addition to these adjustments, you should also do scenario testing. This explores how results change under different assumptions and assesses the robustness of the avoided cost estimates. This involves systematically varying key parameters—such as intervention effect size, participation rates, persistence of impacts, or discount rates—to generate alternative scenarios (e.g. pessimistic, central, and optimistic cases).
The purpose is to identify which assumptions have the greatest influence on results and to understand the degree of uncertainty in the model. By presenting a range of possible outcomes rather than a single estimate, scenario testing strengthens confidence in the analysis and supports more informed decision‑making under uncertainty.
Where to find more information/ support
Avoided cost modelling is a tool being actively explored by the Scottish Government Prevention Unit and further updates will be provided in due course PreventionUnit@gov.scot.
More information/ support on appraisal more generally (including many of the steps covered above) is covered by the Green Book.
Other resources
- A practical example of an avoided costs framework is the Victoria State Early Intervention Investment Fund in Australia Early Intervention Investment Framework | dtf.vic.gov.au
- The Healthcare Finance Management Association (HFMA) produced a guide on return on investment more broadly which provides a useful summary of similar tools.
Contact
Email: PreventionUnit@gov.scot