
Prevention toolkit
The Prevention toolkit curates some of the latest tools in active use across the Scottish public sector to analyse prevention. It provides practical guidance on how to use these tools and links to further resources.
Tool 2 – Prevention Driver Mapping Tool
The tool
- This tool provides a simple format for identifying drivers of demand for a public service or policy area, and provides a way of organising and prioritising key drivers.
Use this to
- Map out the key drivers that could have an impact on your particular policy area, organisation, or community.
- Illustrate the relative importance of different drivers for your area.
You end up with
- A mapping of your programme or policy area showing links between different drivers of demand and outcomes.
- An indicative analysis of the strength of association between your policy area of interest and key drivers/ outcomes.
Who can use this?
- This framework is applicable for a range of audiences, but particularly for policy areas or organisations interested in what drives demand or outcomes in their area.
- Examples of users could be a particular policy area, a portfolio, organisation or place.
How does this tool support prevention thinking?
- This tool supports the targeting of key drivers of demand for policy action.
- It can be used to illustrate how a specific driver of demand (e.g. reoffending) impacts other drivers across public service boundaries.
Using the tool
A mapping of preventable demand drivers and outcomes
The Scottish Government Prevention Unit developed a mapping of different frameworks used by public sector partners to describe preventative drivers of demand and outcomes (Figure 4).
This includes:
- Social determinants – often used to consider the underlying drivers of health and wellbeing. An example of this is the Marmot Principles used in health.
- Risk and protective factors – a set of more specific determinants of risk and resilience, such as housing quality or physical health behaviours. These are often considered as areas that could be targeted to improve resilience against preventable outcomes.
- Drivers of demand – this is the language used in the Public Service Reform Strategy to describe a set of drivers of public service demand and outcomes, such as reoffending or unemployment. These are the things that could have been prevented to some degree and often represent the point at which a negative consequence occurs.
- Outcomes – Scotland’s National Performance Framework describes the set of outcomes that we seek to improve in Scotland. See the latest draft proposed National Outcomes (still in development), see the letter to Parliament provided by the Scottish Government on 16 February 2026.
This linear mapping provides a simplistic starting point for thinking about drivers of demand, the risk or protective factors that drive them, and how they impact on outcomes. In reality, the picture will be more complicated and less linear, but this provides a basis for understanding the different frameworks used by different parts of the system and how they relate to each other.
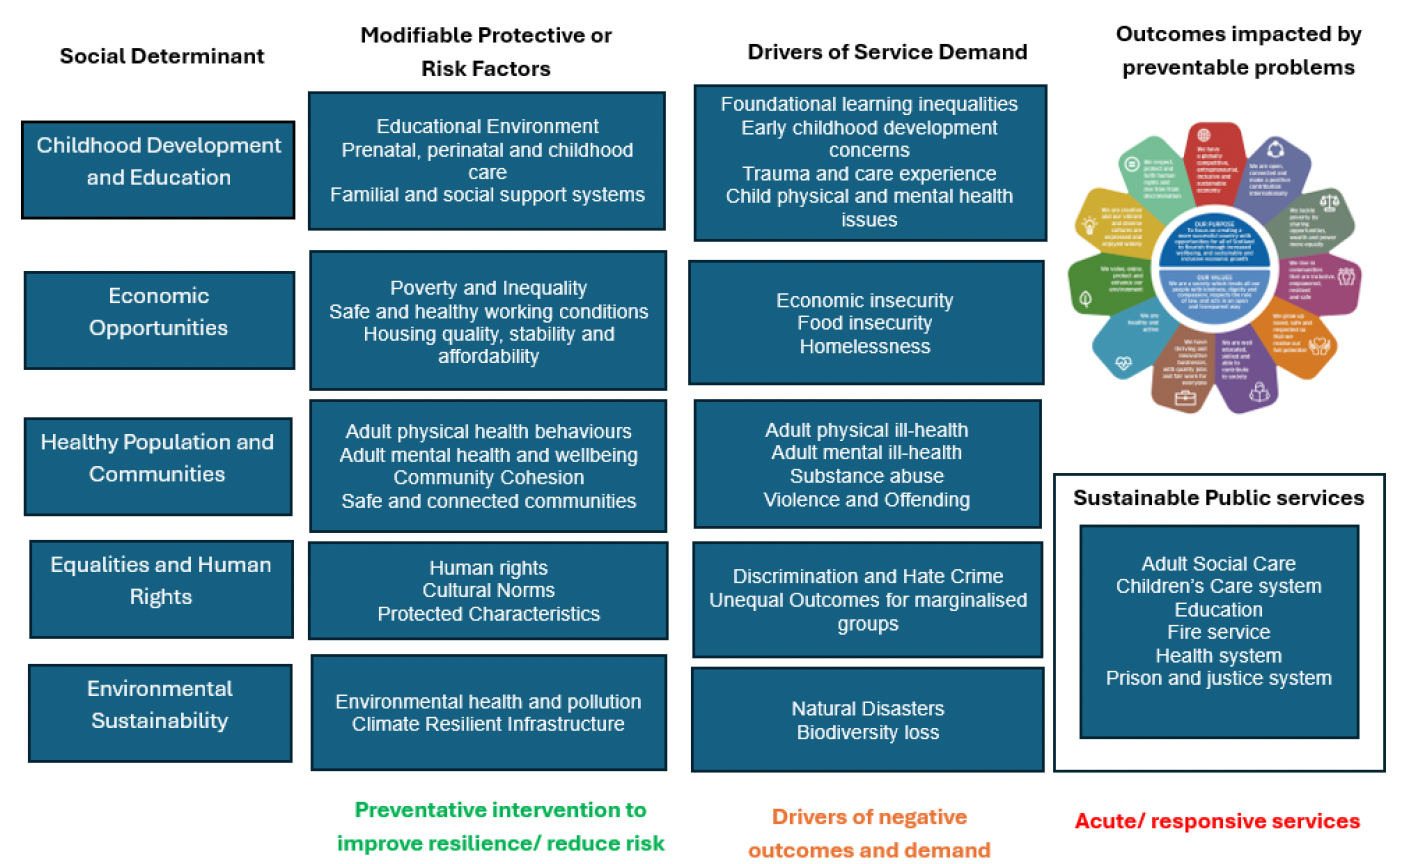
Source: Scottish Government Prevention Unit
Social Determinant
- Childhood Development and Education
- Economic Opportunities
- Healthy Population and Communities
- Equalities and Human Rights
- Environmental Sustainability
Modifiable Protective or Risk Factors
- Educational Environment
- Prenatal, perinatal and childhood care
- Familial and social support systems
- Poverty and Inequality
- Safe and health working conditions
- Housing quality, stability and affordability
- Adult physical health behaviours
- Adult mental health and wellbeing
- Community Cohesion
- Safe and connected communities
- Human rights
- Cultural Norms
- Protected Characteristics
- Environmental health and pollution
- Climate Resilient Infrastructure
The above are all preventative intervention to improve resilience/reduce risk.
Drivers of Service Demand
- Foundational learning inequalities
- Early childhood development concerns
- Trauma and care experience
- Child physical and mental health issues
- Economic insecurity
- Food insecurity
- Homelessness
- Adult physical ill-health
- Adult mental ill-health
- Substance abuse
- Violence and Offending
- Discrimination and Hate Crime
- Unequal Outcomes for marginalised groups
- Natural Disasters
- Biodiversity loss
The above are all drivers of negative outcomes and demand.
Outcomes impacted by preventable problems
- Grow up loved, safe and respected so that we realise our full potential (Children);
- Live in communities that are inclusive, empowered, resilient and safe (Communities);
- Are creative and our vibrant and diverse cultures are expressed and enjoyed widely (Culture);
- Have a globally competitive, entrepreneurial, inclusive and sustainable economy (Economy);
- Are well educated, skilled and able to contribute to society (Education);
- Value, enjoy, protect and enhance our environment (Environment);
- Have thriving and innovative businesses, with quality jobs and fair work for everyone (Fair Work & Business);
- Are healthy and active (Health);
- Respect, protect and fulfil human rights and live free from discrimination (Human Rights);
- Are open, connected and make a positive contribution internationally (International);
- Tackle poverty by sharing opportunities, wealth and power more equally (Poverty).
Sustainable Public services
- Adult Social Care
- Children’s Care system
- Education
- Fire service
- Health system
- Prison and justice system
The above are acute/responsive services.
Step 1 – Select your driver
The first step in mapping drivers of demand is to consider the policy area, programme or service you want to analyse.
Once you have a clear definition of the area you want to analyse, then use the mapping above as a starting point to consider what you want to map against. For example:
- Demand driver factor focus - if you are looking to map a driver of demand (say offending), you may wish to show which risk/protective factors are important for determining demand for your driver.
- Public service focus - If you want to analyse a public service (e.g. health) you may be interested in understanding key drivers of demand for health demand.
- Outcome focus – If you are interested in a particular national outcome, you may want to map drivers of demand against this outcome.
Step 2 – Map the connections
Once you have defined your starting point, you can start to build the links.
For example, if we pick “offending” as a driver of demand, then you can make links to key risks and protective factors that drive demand for offending. For example, you may consider poverty and inequality to have a link to offending.
We suggest also considering the “strength of association” (i.e. weak, moderate, strong line) between two nodes as this can help identify different categories of more and less impactful drivers. An indicative example is provided in Figure 5.
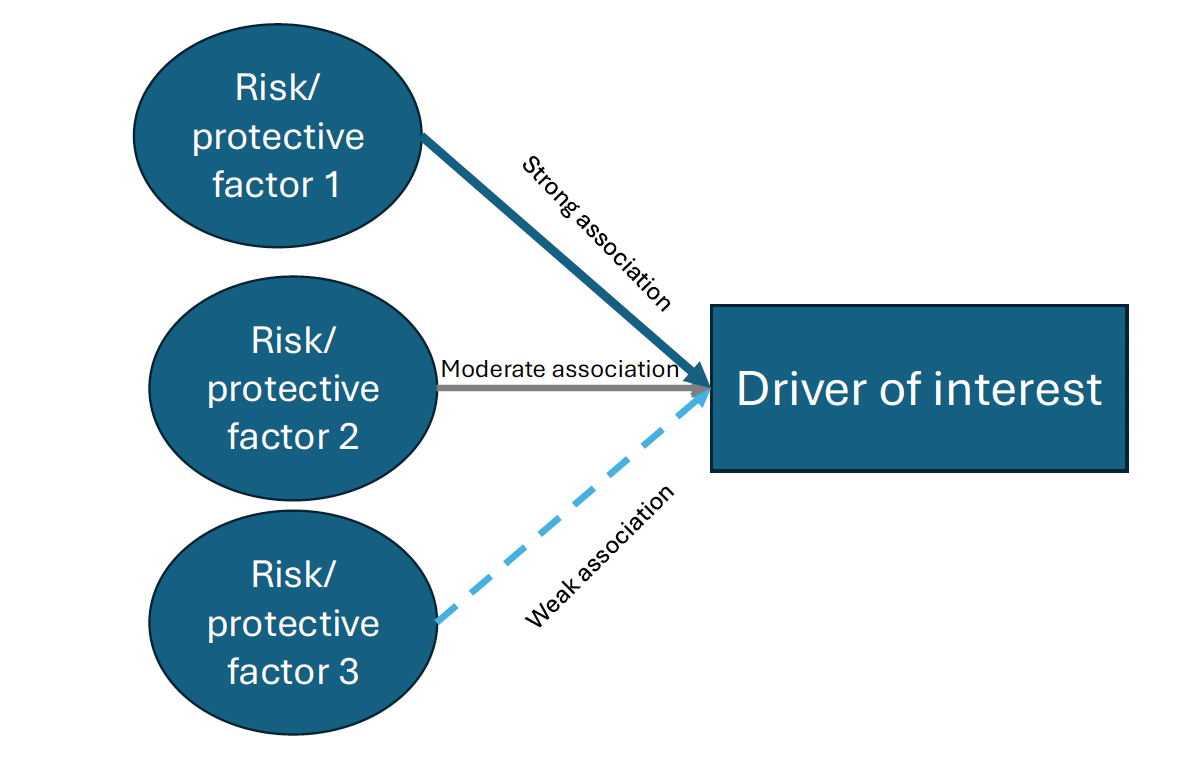
Figure 5 provides a hypothetical illustration of how different risk or protective factors could be linked to a particular driver of demand that is of interest to the user. For example, “adult physical health behaviours” and “poverty and inequality” may be linked to adult mental ill-health, which is a driver of demand. The chart also illustrates which of these hypothetical risk and protective factors may have strong, moderate or weak links to the driver in question.
Step 3 – Group driver categories and findings
The linear mapping is best used for high level analysis, and the more drivers that are mapped against, the less user-friendly the outputs could become, unless consideration has been given on how to illustrate findings.
One option is to group drivers into different categories, for example grouping the set of risk and protective factors by whether they have a strong, moderate or weak association with your chosen driver.
Likewise, looking in the other direction, the outcomes impacted by the driver could also be grouped. These could be organised into those outcomes that are impacted strongly by the driver, those moderately impacted and those with little or no impact.
Step 4 – Consider the policy implications
Once the mapping has been completed, then this could provide the basis for understanding where further work or tools could be used to increase the understanding of different drivers. See Tool 3 for example on systems thinking tools or later tools on quantifying impact on preventative interventions.
More broadly, the mapping should provide an illustration of the varied set of risk and protective factors that could have an impact on the driver of demand you are interested in. This could help with understanding where activity across system boundaries (e.g. in other public service areas) could support the reduction of demand for that driver. Likewise, this mapping could provide the basis for thinking through the outcomes that are impacted by a particular driver of demand.
Where to find more information/ support
The driver of demand mapping is being developed by the Scottish Government Prevention Unit. For more information contact PreventionUnit@gov.scot.
Additional resources
- One common framework for thinking through socio-economic determinants of health (linked in our driver mapping above) is the Marmot Principles used in public health.
- See the Public Service Reform Strategy for actions around mitigating drivers of demand.
- See the latest draft proposed National Outcomes (still in development), see the letter to Parliament provided by the Scottish Government on 16 February 2026.
Contact
Email: PreventionUnit@gov.scot