
Prevention toolkit
The Prevention toolkit curates some of the latest tools in active use across the Scottish public sector to analyse prevention. It provides practical guidance on how to use these tools and links to further resources.
Tool 3 – Systems Thinking Approaches
The tool
- Systems thinking covers a set of tools for mapping different drivers in a system and understanding the connections between them.
Use this to
- Understand how different drivers of demand may connect and intersect within your public service, policy area or system.
- Identify where a driver can have a positive or negative consequence on other drivers.
You end up with
- A diagram showing the interconnections between different drivers of demand and other factors in a system.
Who can use this?
- Systems thinking is a set of tools that can be suited for large or small systems and be as complex or simple as the user would like.
- Developing a systems map does require some systems thinking expertise and knowledge to understand which factors to include and the relationships between them.
How does this tool support prevention thinking?
- Systems mapping provides a more complex view of a preventative system than simple linear driver mapping (Tool 2). It can show the complex set of connections between different drivers of demand and public services, and where these relationships may be positive or negative.
- This can help when thinking about where tackling particular drivers of demand could have a range of intended and unintended consequences on other elements of the system. This can be useful in thinking about key priority areas to focus.
Using the tool
The guidance in this Toolkit draws on the Systems Thinking Toolkit for Civil Servants, focussing on an example systems thinking technique - the “Causal Loops” tool.
This section provides a brief overview of the steps involved in applying this tool, adapted to a potential use for thinking about a preventative system and key drivers of demand.
Step 1 – Define the purpose, boundaries and approach
The first step in developing a Causal Loop diagram, is to develop a clear sense of why you are creating this map (your goals) and the boundaries you are setting on what you want to map. For example, Is this a map for a whole system with multiple drivers of demand, or focussing on a specific driver of demand?
You may wish to consider how you will build your map, whether on a whiteboard, pen and paper, or a data visualisation software.
To start the process for mapping, you should look for a factor that you think captures something important in your system. Make sure to frame your factors as something that can increase or decrease (e.g. number of prison places, or number of people in poverty).
There are a number of tools in the Systems Thinking Toolkit for problem structuring which can support with defining the boundaries and approach, such as “Rich Pictures” or Strategic Options Development and Analysis (SODA).
Step 2 – Developing causal loops
The next step is to start working downstream from your starting factor. What does it cause? Connect your starting factor to the next factor with an arrow to show that one causes another. Then ask again for the new factor, what does that cause? Keep looking at the downstream effects. Ultimately, if it is a loop, it will eventually loop back and influence the original factor.
There are multiple ways to show the relationship between factors, so choose the style or notation that works for you. The System Thinking Toolkit suggests using a plus (+) or minus (–) signs on the arrow connecting 2 factors. An example is provided in Figure 6, taken from the Systems Thinking Toolkit
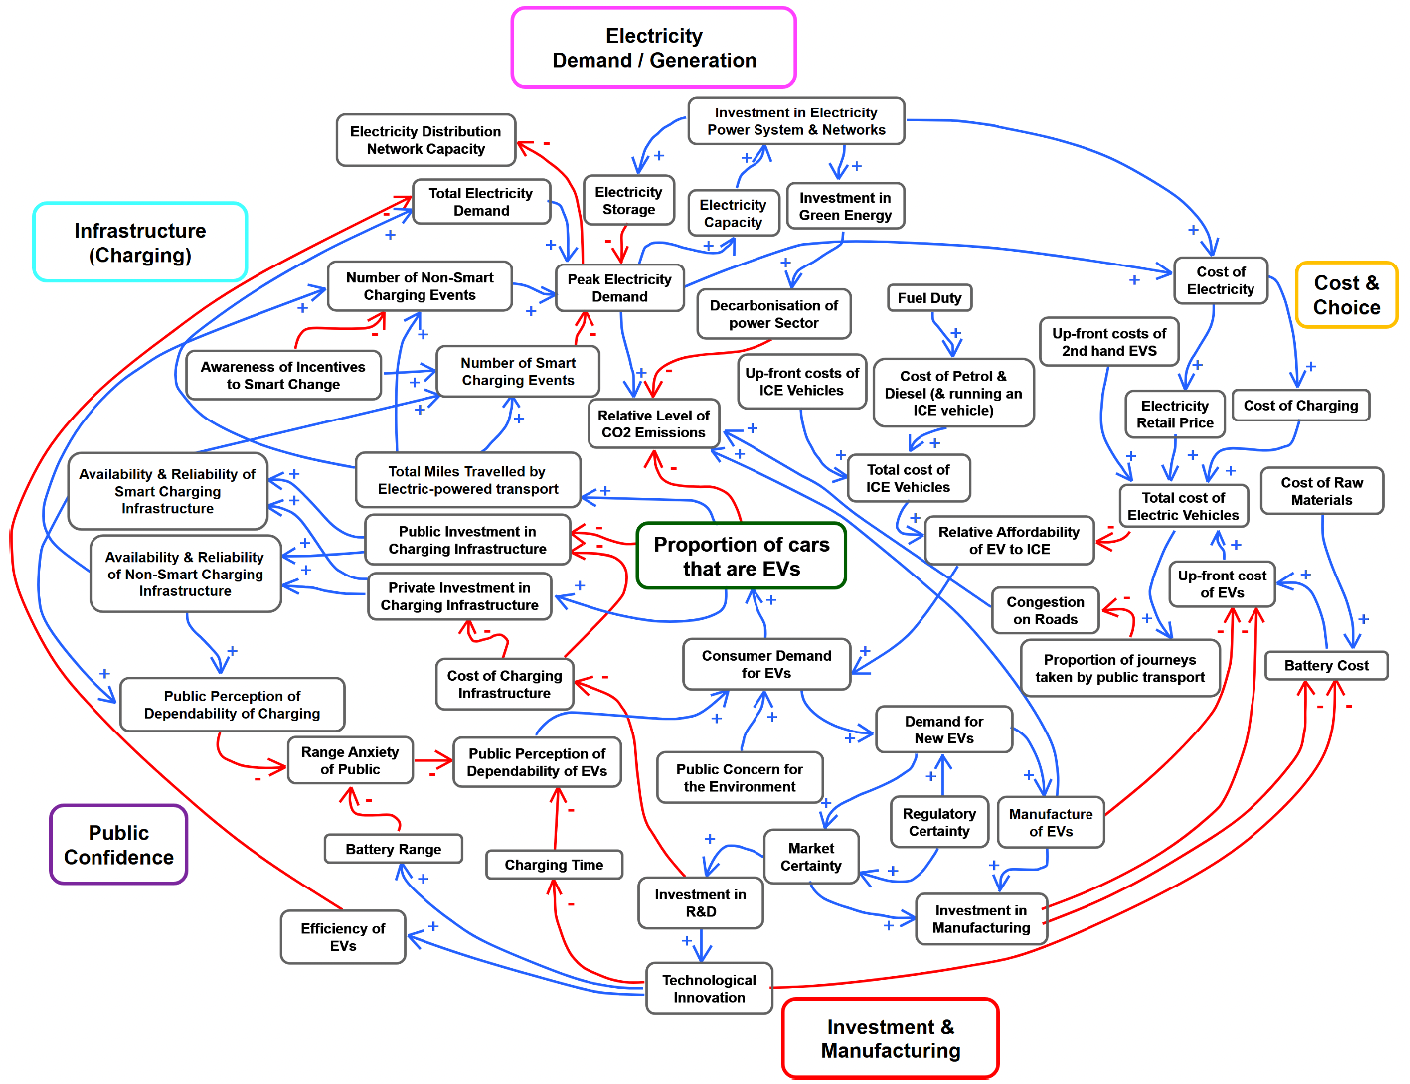
Figure 6 provides an example of a causal loop diagram showing interactions in the roll out of electric vehicles. It shows different "nodes", which correspond to drivers of demand (e.g. consumer demand for electric vehicles), and links these to other drivers (e.g. public concern for the environment). The relationships are typically in one direction (one thing causes another) but the mapping shows that loops typically start to form linking back to the original driver. The connections are also grouped in different categories (e.g. investment & manufacturing).
Source: Systems Thinking Toolkit for Civil Servants.
Step 3 – Define relationships and themes
Next, you should define the loops and group key themes. The System Thinking Toolkit suggests that you practice narrating your loops. In doing to, check them for logic and make note of any leaps or gaps you find. Add in new causes, effects or complete loops if you feel that things are missing.
Look at all your loops and spot loops that address similar issues and themes and try to arrange loops near others that logically fit together. Distinct groupings may begin to form.
Look for the deep structure that serves as the anchor point for most of the loops on your systems map. This is the story that ties different groupings together. It will emerge through stepping back to look at the loops you have created and noticing which loops link different themes together.
Step 4 – Building the narrative
Once you have developed a causal loop diagram or systems map, you can then start to build your narrative.
The Systems Thinking Toolkit suggests that, when additional research and loop building is not leading to new insights, factors, or dynamics, your team is probably ready to stop map building and start developing your narrative.
Where to find more information/ support
For further guidance on systems thinking, go to the Systems Thinking Toolkit for Civil Servants - An introductory systems thinking toolkit for civil servants - GOV.UK
Additional resources
For other examples of systems mapping in Scotland see
- Child poverty system map - gov.scot
- Systems Mapping of Scotland’s Built Environment and Energy Infrastructure Sectors | Zero Waste Scotland)
Preventative Budgeting and Outcomes
The first two sections of this toolkit have focussed on defining and mapping prevention.
This next section focuses on how to identify what is spent on prevention (preventative budgeting), and on what outcome (outcomes tagging)
This provides a basis for thinking about how spending on interventions targets some of the drivers considered in the previous section.
Contact
Email: PreventionUnit@gov.scot