Place-based policy approaches to population challenges: Lessons for Scotland
This report by the independent Expert Advisory Group on Migration and Population analyses a range of place-based policy approaches to population challenges (including zonal approaches), and sets out lessons for Scotland.
Annex 2: Using age structure to explore 2020-2021 change in the Small Area Population Estimates
In this annex we aim to show how the detailed age structure data in the SAPE can shed light on the striking change of trend in the data for 2021, which we interpret as a combination of behavioural changes during COVID lockdowns, partly in terms of temporary relocation, and partly as a consequence of a higher rate of registration with GP practices.
The striking change in the direction of population trend in the remote, very remote, and sparsely populated areas in 2021 is best understood through a comparison of age profiles for 2020 and 2021.
The National Records of Scotland Small Area Population Estimates (SAPE) data include a one-year age breakdown for all data-zones. Aggregation of these to the 2020 urban-rural categories allows us to explore a very detailed age profile of the changes in population between 2020 and 2021, and to compare that with the age profile of changes in previous years.
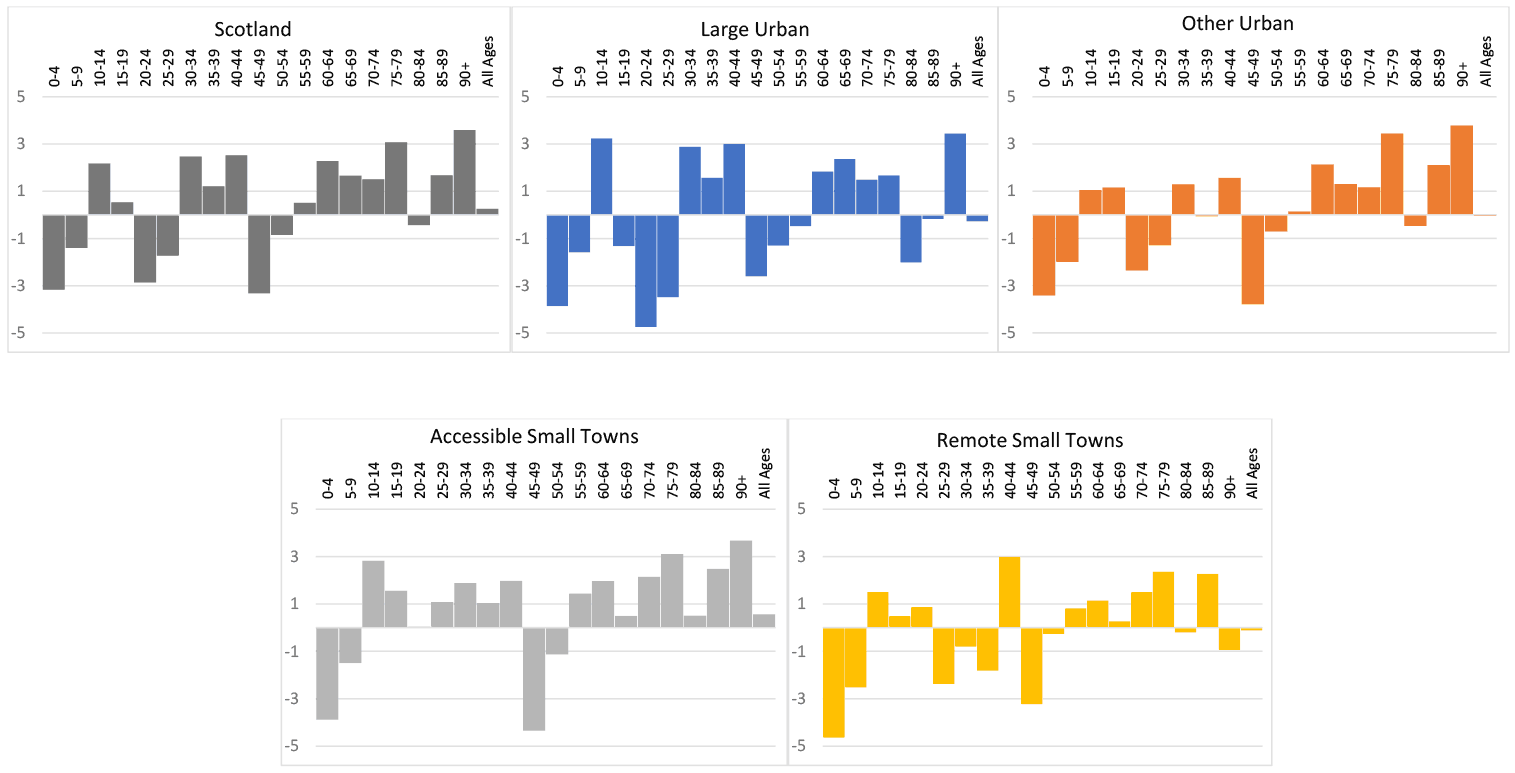
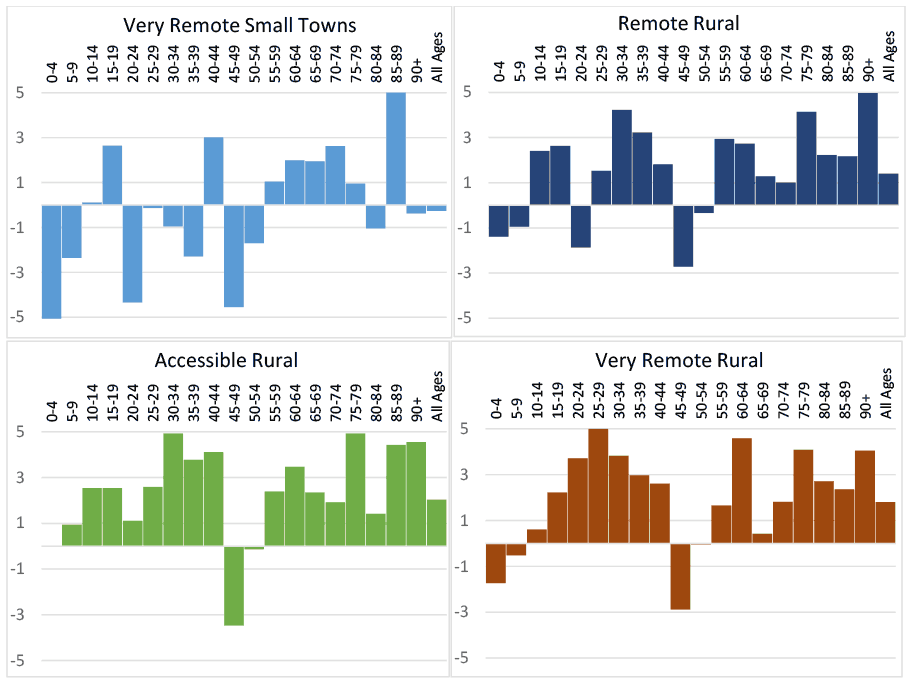
To increase clarity, it is also helpful to group the data into five-year cohorts. The graphs in Figure 2.1 show the age structure of change between 2019 and 2020 (the year prior to the trend reversal apparent in Figure 1) for each of the urban-rural categories. These graphs can be viewed as illustrative of the pre-COVID status quo, in which the age structure of population change (in each urban-rural category) was quite consistent from year to year. Where an age group has a bar above the horizontal axis that cohort has increased in size in 2020, compared to 2019. A bar below the line indicates a smaller population in 2020 than in 2019.
The profile of change for Scotland as a whole, and for the urban areas, can be interpreted as a broadly a product of the general process of ageing, with variations between individual cohorts reflecting past year-to-year fluctuations in fertility due to (among other things) the overall economic situation. In the bottom row of graphs, the pattern of change in the remote and very remote areas shows very clearly the out-migration induced deficits in the younger age groups, and the population increases in the over 50s, where natural ageing is boosted by return and retirement in-migration. The accessible rural areas show positive change in 17 out of the 20 age cohorts. These areas are a magnet for in-migrants of almost all ages and life-cycle stages. The age profile of change in the three small town categories is less clear, and seems to be intermediary between that of the urban areas and the corresponding type of rural area.
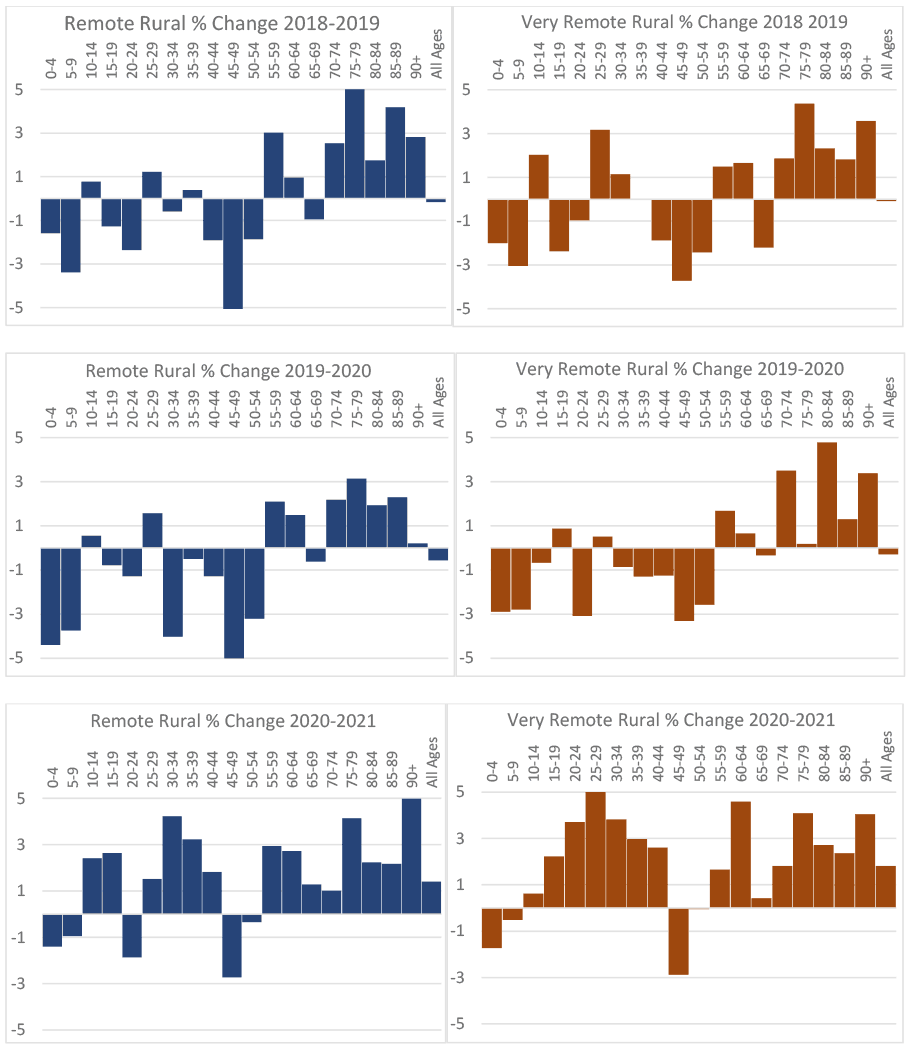
Figure 2.2 shows the profiles of change for the remote and very remote categories of rural data-zones for 2020-21 and for the two years prior to this. It is clear that the reason for the uptick in population in these areas in 2021 was a switch from negative to positive change in most of the younger cohorts. Thus the trend reversal between 2020 and 2021 in remote and very remote rural areas and small towns was a consequence of a transformation of the age structure of population change. In simple terms, in these areas, most of the cohorts younger than 45 flipped from the decline which had characterised them in previous years, to strong growth.
Interpretation of this finding needs to keep in mind the source of data which lies behind the small area population estimates – the locations associated with NHS Scotland Community Health Index (CHI) numbers. Presumably the change in the age structure of the population estimates reflects a change in the age profile of GP practice registrations. In other words, during 2021 (the year most affected by COVID-19 lockdowns) fewer people under the age of 45 were switching their GP registration from remote and very remote rural areas to practices in the city, and perhaps there were also some transfers in the opposite direction.
In the absence of any independent evidence, we can only speculate about the behaviours driving this change in CHI number location. An important element of this, accounting for the increased cohorts in the late-teens and early twenties, would have been associated with the switch to remote learning (often at the parental home), for higher and further education students. The apparent expansion of the late twenties, thirties and early forties cohorts reflect, perhaps, the fact that relocation to parental homes in rural areas was also a popular option for young professionals and others for whom distance working was a preferred option during lockdown. Others (of any age), with second homes, may have chosen to relocate to their country residence during lockdown, and registered with a local GP practice. Whether there has also been an element of permanent residential relocation of ‘footloose’ workers can only be established from anecdotal evidence.
Another possibility is that elevated health concerns, and vaccine eligibility, may have prompted non-registered people to make sure they were on a local GPs list. However, this effect would presumably have affected urban and rural areas alike. The 2022 Census results will presumably shed further light on these intriguing issues.
Contact
Email: population@gov.scot