Scottish Breast Screening Programme: major review
Major review of the Scottish Breast Screening Programme.
An Overview of Uptake of Breast Screening in Scotland
Uptake over time.
Over the past decade the general trend in overall uptake of breast screening has been a small but steady decline, as Figure 1 below shows. Average performance on uptake over the last 10-years now sits at 72% (range: 71.2% to 73.5%).
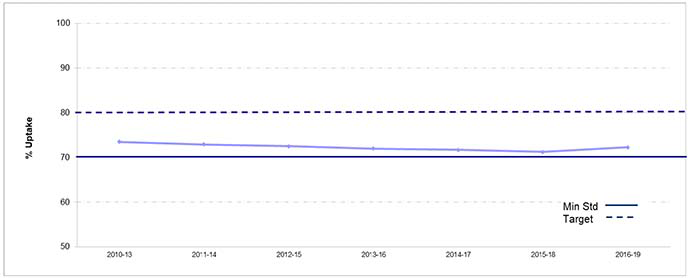
1 Routine appointments only, self /GP referral and early recall appointments are excluded.
2 Breast Screening year runs from 1 April to 31 March.
3 Women are invited to attend screening once every three years and NHS Boards are not necessarily screened evenly throughout the three-year period.
Source: Scottish Breast Screening Programme (SBSP) Information System - KC62 Returns
Within this pattern of steady decline, the overall level of performance of individual Breast Screening Centres is relatively consistent over time. Analysis of programme overall uptake across rolling three-year periods covering almost a decade from 2010 – 2019 shows this (Table 1).
| Rolling 3 year periods from 2010/11 - 2012/13 to 2016/17 - 2018/19 | % Uptake (Age 50-70) | ||
|---|---|---|---|
| Screening Programme | Min | Max | Average |
| South East of Scotland | 70.0 | 71.8 | 70.8 |
| East of Scotland | 75.9 | 77.2 | 76.6 |
| North East of Scotland | 78.9 | 81.3 | 80.1 |
| South West of Scotland | 73.4 | 75.6 | 74.3 |
| North of Scotland | 77.8 | 79.7 | 78.9 |
| West of Scotland | 67.2 | 70.1 | 68.5 |
| Scotland | 71.2 | 73.5 | 72.3 |
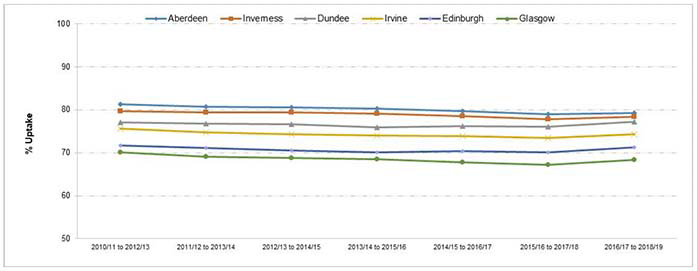
Breast Screening programmes in the North of Scotland perform well (North East usually near or meeting the upper achievable standard for uptake of 80%, and North of Scotland usually achieving uptake in the high 70% range close to the upper achievable standard). The East of Scotland Breast Screening programme and the South West of Scotland deliver uptake performance at the mid-70 percent level. The South East of Scotland programme delivers uptake on or just over the minimum standard of 70%, and the West of Scotland delivers a little under the minimum uptake standard. Using historical data over a longer period than ten years shows similar levels of typical performance for the centres, potentially suggesting social and population causes rather than service design (see appendix 1).
Figure 2 below details overall trends in uptake for this same time period, at Breast Screening Centre level.
Appendix 1 gives more detail of individual three-year rolling periods, shows long term trends in overall uptake for the programme, and shows min/max/avg. performance at Breast Screening Centre level analysed over a longer time period (2004-2019).
The two larger screening centres in the South East of Scotland (Edinburgh) and in the West of Scotland (Glasgow) are more challenged in delivering the minimum uptake standard for the programme. Notably, in postcode level uptake analysis undertaken as part of the review we observed that geographical areas with uptake below 50% participation are almost exclusively in the West of Scotland breast screening centre programme catchment area (Glasgow City, Renfrewshire, and North Lanarkshire) with only 1 other postcode area in Scotland, Leith EH6, falling into this category.
In line with the above, data from the Scottish Breast Screening Programme over the recent three-year period from 2016 to 2019 now shows a 72.2% all Scotland uptake for the programme overall (Table 2).
| Scottish Breast Screening Programme: REVISED KC62 Standards
|
||||||||
|---|---|---|---|---|---|---|---|---|
| Three Year Period Covering 2016/17 to 2018/19 | ||||||||
| Overall uptake (tables A, B, C1, C2) | Edinburgh | Dundee | Aberdeen | Irvine | Inverness | Glasgow | Scotland | |
| No of women screened (Age 50-70) | 133,682 | 54,124 | 63,697 | 59,356 | 33,708 | 201,812 | 546,379 | |
| No of women invited (Age 50-70) | 187,427 | 70,083 | 80,383 | 79,908 | 43,042 | 295,498 | 756,341 | |
| % Uptake (overall) (Age 50-70) | 71.3 | 77.2 | 79.2 | 74.3 | 78.3 | 68.3 | 72.2 | |
Uptake for newly eligible women (prevalent uptake, women age 50-52yrs) was 69.4% in this 2016/17 – 2018/19 period. Incident uptake (women age 53-70yrs) was 87.5%.
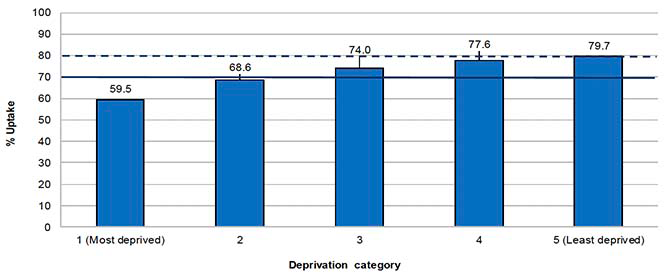
We know that women from more deprived areas are less likely to attend for breast screening, with under 6 in 10 women (59.5%) from the most deprived areas going for screening compared with almost 8 in 10 women (79.7%) living in the least deprived areas, a difference of over twenty percentage points (Figure 3)[2]. Appendix 1 also shows attendance data, by deprivation category, by NHS Board in Scotland.
Data visualisation
The review geographically mapped uptake of breast screening across Scotland by uptake level. The data-set used covered the period 2016 – 2019 and included NHS Board area of residence, Health and Social Care Partnership, Local Authority area, age group, and deprivation quintile. Data on the number of screens, number invited, number of cancers detected, and uptake were calculated to postcode sector level.
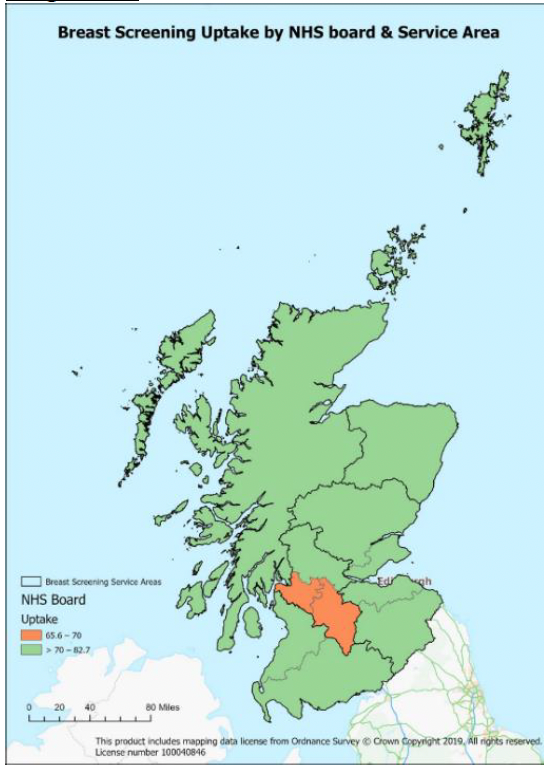
Public Health Scotland's Geospatial Service was subsequently requested to use this data to prepare geographical maps of breast screening uptake by datazone. These are shown below.
At the highest level of overview (figure 4) the map shows the concentration of NHS Board areas which fail to meet the minimum standard (70%) for breast screening uptake. These are NHS Greater Glasgow and Clyde and NHS Lanarkshire. Figure 5 shows an overview of uptake, by uptake level, across Scotland.
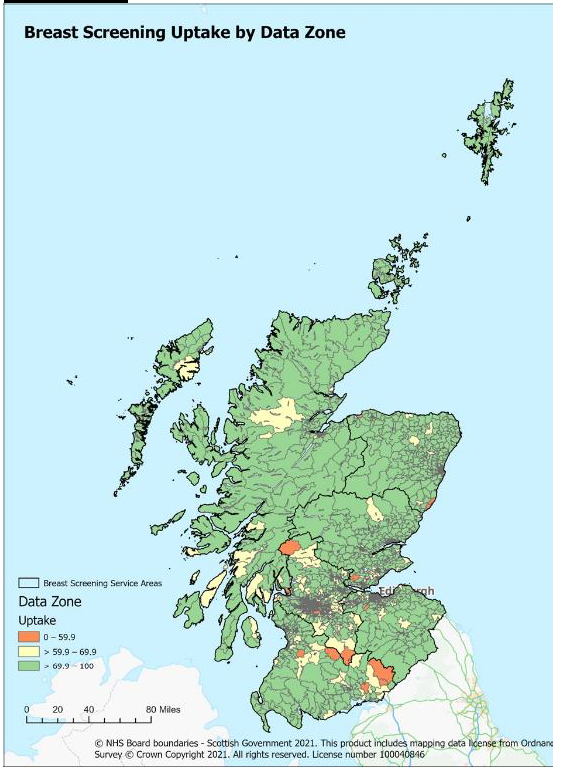
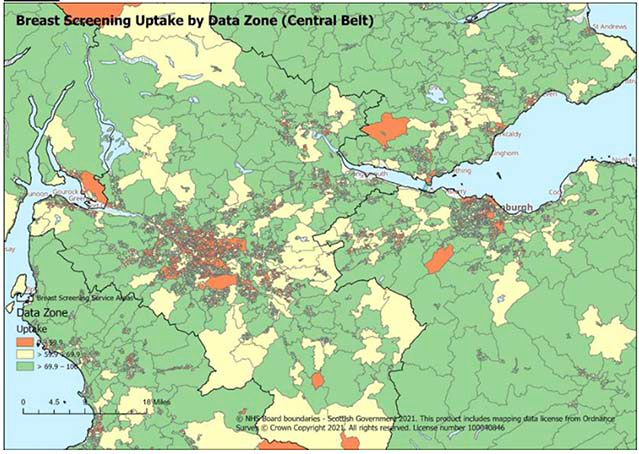
As indicated in figure 5 above, most areas meet or exceed the minimum uptake standard for the programme. Areas of under-target performance can be identified across Scotland, however the central belt of Scotland has by far the greatest concentration of areas of lower levels of uptake (see figure 6, below). Given population density, the central belt area has the largest share of the eligible population invited for breast screening in Scotland, with lower levels of uptake in the most deprived areas served.
Appendix 2 shows uptake by data-zone for each Breast Screening Centre in Scotland.
The geospatial maps shown have been developed as an interactive tool, with the ability to zoom in / out to individual geographical areas of varying sizes, for example drilling down to uptake data at individual datazone level. This functionality was developed to support the work of the review, and it built on the new availability of activity data at postcode level. However, the geographical information system capability should be developed further to support local Health Board screening leads and Health Promotion Specialists to further identify inequalities and areas of targeted opportunity. Such a tool would also assist Breast Screening Centres in planning the screening schedule, particularly the strategy for mobile location. For strategic planning, the same geospatial maps could be used to support demand modelling, including consideration of variables such as travel time and distance for various scenarios and potential screening delivery locations. Some initial exploratory work in this area has been undertaken with the Public Health Scotland Geospatial Service as part of the review process, however COVID constraints prevented full engagement and development of any site specific scenario planning or options development with individual sites.
Given the challenges noted above in the Central Belt of Scotland associated with inequalities in uptake, a specific focus and development of a central belt strategy on uptake maximisation and location of screening delivery would potentially support improvement. Improved use of local geographical data may also support the greater involvement of Health and Social Care Partnerships in community engagement and health promotion.
Contact
Email: screening@gov.scot