
Building regulations 2025 - new non-domestic buildings: energy standard improvements - modelling report
Research output to identify and assess potential improvements in energy and emissions performance for non-domestic buildings constructed in Scotland set via Section 6 of the Scottish Building Standards (energy). This was to inform the setting of targets within the next set of energy standards.
Part of
3. Objective 2: Develop Improved Notional Building Specification
The aim of this objective is to develop examples of improved notional building specification options, from which an overall target can be derived which the designer/developer then has the flexibility to meet in a variety of ways.
3.1 Identification of Potential Improved Specifications
The aim is to provide an evidence base for potential improvements to the future notional building specification, both in terms of fabric and services performance. The following section describes the steps taken to develop these specifications, which will support the development of an evidence-based, high but achievable specification for the notional building in Scotland.
Data for this review has been drawn from the following sources:
- The EPC database, provided by the Scottish Government, is the principal source of data for this review.
- Option 2 (high emissions savings) from the 2021 Scottish Energy Standards consultation (Scottish Government, 2021a).
- NCM modelling guide for England published as part of the consultation on the 2025 changes to Part L (Health and Safety Executive, 2023).
- Other industry sources:
- London Energy Transformation Initiative (LETI) Climate Emergency Design Guide (London Energy Transformation Initiative, 2020),
- Passivhaus guidance (Passivhaus Trust, 2015).
The EPC database has been analysed to find the distribution of buildings being constructed to different specifications. Specifications that would be representative of good practice could be taken as those around 75% of the distribution (i.e. only 25% of buildings have a better specification). Best practice has been taken to be those specifications around 90% of the distribution (i.e. only 10% of buildings have a better specification).
The other sources identified above have been reviewed to confirm the conclusions of the review of the EPC database and/or provide additional insights and context especially in areas where the EPC database is lacking detail.
A separate review of the Scottish EPC database has been undertaken to understand whether designers and developers typically choose different building specifications when using different heating sources, as detailed in Appendix A. This analysis showed that although the EPC database suggested that there are some elements where the buildings using different heating sources may use different specifications, for example it was found that buildings heated with district heating tended to have higher efficiency lighting, the sample sizes were insufficient to be able to draw robust conclusions on the trends observed. Therefore, all buildings, regardless of heating source, are proposed to use the same modelling specifications, as described in the following sections.
3.1.1 Building Fabric: U-values
Table 21 compares the 2023 Section 6 notional building U-values with those from other sources described above. The EPC database does not include U-values for individual building elements (wall, roof etc.) but rather includes the whole-building average U-value. The average U-value is a function of each individual element U-value and their relative areas; most importantly the glazed area varies significantly between different buildings and will be a strong influence on the whole-building U-value because glazing U-values are typically much higher than opaque elements.
Table 22, Table 23 and Table 24 shows U-values for each individual building element calculated on the basis of the percentage improvement in whole-building U-value; for mechanically ventilated, naturally ventilated and all buildings, respectively. This is effectively assuming that the glazed area in the actual building is the same as the notional in all cases; and consequently, this table should be used with caution but is helpful in sense-checking the other sources.
| Data Source | Wall (W/m²K) | Roof (W/m²K) | Floor (W/m²K) | Window (W/m²K) | Rooflight (W/m²K) | Average U-value change from notional |
|---|---|---|---|---|---|---|
| Section 6 (2022) notional | 0.15 | 0.11 | 0.13 | 1.20 | 1.90 | 0% |
| 2021 Scottish Energy Standards consultation [1] | 0.18 | 0.13 | 0.15 | 1.20 | 1.90 | +2% |
| Part L 2025 England Consultation: Side-lit [2] | 0.18 | 0.15 | 0.15 | 1.40 | 2.10 | +14% |
| Part L 2025 England Consultation: Top-lit [2] | 0.26 | 0.18 | 0.22 | 1.40 | 2.10 | +19% |
| LETI Climate Emergency Design Guide [3] | 0.12 – 0.15 | 0.10 – 0.12 | 0.10 – 0.12 | 1.00 – 1.20 | Not given | -64% |
| Passivhaus Rules of Thumb [4] | 0.10 – 0.15 | 0.10 – 0.15 | 0.10 – 0.15 | Not given | Not given | -88% |
| EPC Database MV & AC 50th percentile [2] | - | - | - | - | - | -9% |
| EPC Database MV & AC 75th percentile2 | - | - | - | - | - | -24% |
| EPC Database MV & AC 90th percentile2 | - | - | - | - | - | -37% |
| EPC Database NV 50th percentile [3] | - | - | - | - | - | -19% |
| EPC Database NV 75th percentile3 | - | - | - | - | - | -33% |
| EPC Database NV 90th percentile3 | - | - | - | - | - | -45% |
| EPC Database All buildings 50th percentile [4] | - | - | - | - | - | -14% |
| EPC Database All buildings 75th percentile4 | - | - | - | - | - | -29% |
| EPC Database All buildings 90th percentile4 | - | - | - | - | - | -42% |
[1] (Scottish Government, 2021b)
[2] (Health and Safety Executive, 2023)
[3] (London Energy Transformation Initiative, 2020)
[4] (Passivhaus Trust, 2015)
| Variable | Section 6 notional 2022 | 50th Percentile | 75th Percentile | 90th Percentile |
|---|---|---|---|---|
| Wall U-value (W/m²K) | 0.15 | 0.14 | 0.11 | 0.09 |
| Roof U-value (W/m²K) | 0.11 | 0.10 | 0.08 | 0.07 |
| Floor U-value (W/m²K) | 0.13 | 0.12 | 0.10 | 0.08 |
| Window U-value (W/m²K) | 1.20 | 1.09 | 0.91 | 0.75 |
| Rooflight U-value (W/m²K) | 1.90 | 1.73 | 1.44 | 1.19 |
| Variable | Section 6 notional 2022 | 50th Percentile | 75th Percentile | 90th Percentile |
|---|---|---|---|---|
| Wall U-value (W/m²K) | 0.15 | 0.12 | 0.10 | 0.08 |
| Roof U-value (W/m²K) | 0.11 | 0.09 | 0.07 | 0.06 |
| Floor U-value (W/m²K) | 0.13 | 0.11 | 0.09 | 0.07 |
| Window U-value (W/m²K) | 1.20 | 0.97 | 0.81 | 0.66 |
| Rooflight U-value (W/m²K) | 1.90 | 1.54 | 1.28 | 1.04 |
| Variable | Section 6 notional 2022 | 50th Percentile | 75th Percentile | 90th Percentile |
|---|---|---|---|---|
| Wall U-value (W/m²K) | 0.15 | 0.13 | 0.11 | 0.09 |
| Roof U-value (W/m²K) | 0.11 | 0.09 | 0.08 | 0.06 |
| Floor U-value (W/m²K) | 0.13 | 0.11 | 0.09 | 0.08 |
| Window U-value (W/m²K) | 1.20 | 1.03 | 0.85 | 0.70 |
| Rooflight U-value (W/m²K) | 1.90 | 1.64 | 1.35 | 1.11 |
Table 25 shows the proposed fabric standards for modelling analyses to support proposed changes to Section 6.
Previous work has identified tipping points in the costs and performance of building fabric elements. Key amongst these is the difference between double glazing and triple glazing. Double glazing can achieve U-values lower than 1.4 W/m²K, in the vertical plane; however, to achieve U-values better than this, triple glazing is typically a more cost-effective option. However, once triple glazing is adopted, there is a strong argument for specifying a significantly improved U-value of between 0.7 and 0.9 W/m²K at marginal extra cost relative to poorer performing triple glazing. On this basis, the proposed window U-values set out for analysis in Table 25 are 1.20 W/m²K for the low and medium scenarios, and 0.8 W/m²K for the high option. Achieving improved U-values for rooflights is more challenging and so the high option proposes a smaller proportional increase to 1.60 W/m²K, from 1.90 W/m²K in the low and medium options.
Reviewing Table 21, the opaque fabric (wall, roof and floor) U-values within the current Section 6 notional building are better than those proposed within the Part L 2025 consultation for England for both side-lit and top-lit buildings.
The values in Table 22, Table 23 and Table 24, should be used with caution, as previously noted; however, the figures suggest that many Scottish buildings may be achieving U-values that are significantly better than the current notional building specification. U-values have been selected for the high option by both taking account of the values in Table 24, noting the relative uncertainty associated with this data, and aligning with other industry sources (LETI Climate Emergency Design Guide and Passivhaus guidance). This results in the same U-value specification being used for the low and medium options, with improvements to all values, except for external walls, in the high option.
| Variable | Section 6 notional 2022 | Low | Medium | High |
|---|---|---|---|---|
| Wall U-value (W/m²K) | 0.15 | 0.15 | 0.15 | 0.15 |
| Roof U-value (W/m²K) | 0.11 | 0.11 | 0.11 | 0.10 |
| Floor U-value (W/m²K) | 0.13 | 0.13 | 0.13 | 0.12 |
| Window U-value (W/m²K) | 1.20 | 1.20 | 1.20 | 0.80 |
| Window G-value | 0.50 | 0.50 | 0.50 | 0.40 |
| Window light transmittance | 0.77 | 0.77 | 0.77 | 0.60 |
| Rooflight U-value (W/m²K) | 1.90 | 1.90 | 1.90 | 1.60 |
| Rooflight G-value | 0.50 | 0.50 | 0.50 | 0.40 |
| Rooflight light transmittance | 0.77 | 0.77 | 0.77 | 0.60 |
3.1.2 Building Fabric: Air tightness
A similar process as was undertaken for the U-values was undertaken for building air tightness, as shown in Table 26.
The current 2022 Section 6 notional value (4 m³/m².hr at 50Pa) aligns with the 75th percentile value for all buildings in the EPC database but is slightly poorer than is being proposed within the Part L 2025 Consultation for England.
The proposed low, medium and high modelling options align with the 50th, 75th and 90th percentile values, respectively, from all buildings in the EPC database. It is proposed to use an air tightness value of 5 m³/m².hr at 50Pa for the low option, 4 m³/m².hr at 50Pa for the medium option and 3 m³/m².hr at 50Pa for the high option.
| Data Source | Air tightness (m³/m².hr at 50Pa) | Change from notional |
|---|---|---|
| Section 6 (2022) notional | 4 | 0% |
| 2021 Scottish Energy Standards consultation [1] | 3 | -25% |
| Part L 2025 England Consultation: Side-lit [2] | 3 | -25% |
| Part L 2025 England Consultation: Top-lit [2] | 3 | -25% |
| LETI Climate Emergency Design Guide [3] | < 1 | -75% |
| EPC Database MV & AC 50th percentile | 5.0 | 24% |
| EPC Database MV & AC 75th percentile | 3.8 | -4% |
| EPC Database MV & AC 90th percentile | 2.2 | -45% |
| EPC Database NV 50th percentile | 5.0 | 24% |
| EPC Database NV 75th percentile | 4.0 | 0% |
| EPC Database NV 90th percentile | 3.0 | -25% |
| EPC Database All buildings 50th percentile | 5.0 | 24% |
| EPC Database All buildings 75th percentile | 3.9 | -3% |
| EPC Database All buildings 90th percentile | 2.8 | -31% |
[1] (Scottish Government, 2021b)
[2] (Health and Safety Executive, 2023)
[3] (London Energy Transformation Initiative, 2020)
| Variable | Section 6 notional 2022 | Low | Medium | High |
|---|---|---|---|---|
| Air tightness (m³/m².hr at 50Pa) | 4 | 5 | 4 | 3 |
3.1.3 Building Services: Space Heating and Domestic Hot Water
Table 28 and Table 29 compares the 2022 Section 6 notional building space heating and domestic hot water system performance with those from other sources, respectively.
The introduction of the New Build Heat Standard (NBHS) in April 2024, with updates in January 2025, prevents most new buildings from using fossil-fuelled main heating systems; with amendments permitting the use of bioenergy (including wood burners) and peat-burning systems in buildings in response to feedback from rural and island communities.
ASHPs are therefore increasingly seen as the ‘business as usual’ space and domestic hot water heating technology with other NBHS-compliant technologies, including direct electric and district heating, adopted in fewer buildings.
Table 28 shows that the efficiency of Air-to-Water ASHPs providing space heating as recorded in the EPC database are typically more efficient than the current Section 6 (2022) notional building. The proposed efficiency within the 2021 Scottish Energy Standards consultation lies between the 75th and 90th percentile values, indicating that this value is achievable, but representing higher performance than typical. Records from the EPC database show that the efficiency of Air-to-Air heat pumps, such as those used in Variable Refrigerant Flow systems, are higher than Air-to-Water heat pumps. However, as previously discussed, Air-to-Air heat pumps are unsuitable for some building types, and so the proposed modelling specification is based on the performance of Air-to-Water heat pumps, which are more readily suitable for all building types. The proposed values for the low, medium and high options align with the 50th, 75th and 90th percentile values for Air-to-Water heat pumps, respectively and are reported in Table 30.
The EPC database does not record the efficiency of the domestic hot water generator in the same way as for space heating generation; therefore, detailed analysis of the energy performance of installed DHW systems was not possible.
ASHPs can be used to meet space heating and domestic hot water demands, but they are generally most efficient when supplying lower water temperatures, typically less than 55ºC, which is lower than would typically be acceptable for domestic hot water to prevent legionella growth. Some heat pumps, often using CO2 as their refrigerant, can supply higher temperatures as required for DHW applications, whilst maintaining higher levels of efficiency. However, it is not always possible to accommodate separate DHW plant and therefore the proposed modelling specification for DHW, as reported in Table 29, is based on a heat pump raising the temperature of the water to 55ºC before being heated to 60ºC by a direct electric (immersion) heater. The efficiency of the heat pump for this scenario has been taken as the 50th percentile for Air-to-Water heat pumps (SCOP = 3.50), and results in an overall DHW generation efficiency of 3.25, which is proposed for low, medium and high options.
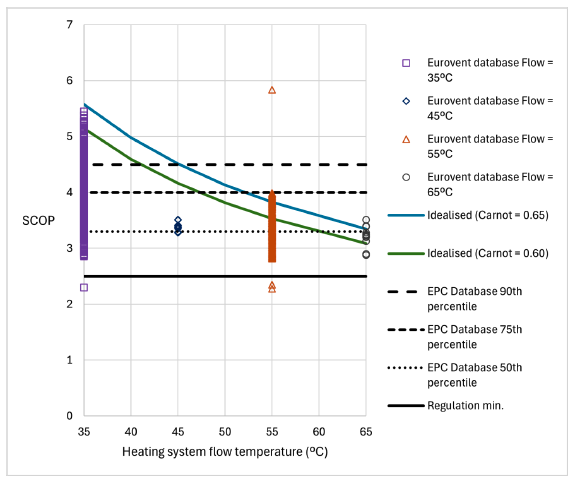
Figure 43 shows two curves and illustrates the relationship between heating flow temperature and seasonal coefficient of performance (SCOP); the red and turquoise curves illustrate the idealised theoretical relationship based on two different Carnot efficiencies.
The current 2022 Section 6 performance requirements (as well as the EU ErP and several other standard) for ASHPs are based on a product’s efficiency when measured in accordance with EN 14511. The standard makes assumptions about the ambient air temperature (i.e. the temperature of the source from which the heat pump extracts heat) and the heating system flow temperatures. These standard assumptions mean that the “official” efficiency will differ from that calculated using project-specific values such as the location weather data and system flow temperature. EN 14511 requires that performance is measured at least one of four heating system flow temperatures (35⁰C, 45⁰C, 55⁰C and 65⁰C). Figure 43 shows several thousand reported efficiencies from the Eurovent database measured at each of these temperatures; these broadly align with the curves described above (Eurovent Certified Performance, 2025).
Alongside the Eurovent data, Figure 43 shows three horizontal black dotted lines corresponding to the 50th, 75th and 90th percentiles reported in the EPC database (see Section 2.2.4). Comparing these dotted lines with the Eurovent data (and assuming that modellers are inputting the appropriate values in the EPC models) it can be inferred that many ASHP heating systems are being designed with flow temperatures below 55⁰C. The 75th percentile value appears to only be achieved by system operating at 52⁰C or lower, whilst the 90th percentile is only achieved by systems at 45⁰C or lower. As the EPC database does not report heating system flow temperature it is not possible to validate this.
| Data Source | Seasonal efficiency (SCOP): ASHP | Seasonal efficiency (SCOP): Direct Electric | Seasonal efficiency (SCOP): District Heating |
|---|---|---|---|
| Section 6 (2022) notional | 3.00 | Natural gas boiler – 93% | Natural gas boiler – 93% |
| 2021 Scottish Energy Standards consultation [1] | 4.35 | Natural gas boiler – 93% | Natural gas boiler – 93% |
| Part L 2025 England Consultation: Side-lit [2] | 2.64 | 100% | District heating 0.034kgCO2/kWh 0.694kWhPE/kWh |
| Part L 2025 England Consultation: Top-lit [2] | 100% (direct electric) | 100% | District heating 0.034kgCO2/kWh 0.694kWhPE/kWh |
| LETI Climate Emergency Design Guide [3] | ≥ 2.8 | Not recommended | Not recommended |
| EPC Database All buildings 50th percentile Air-to-Water ASHP | 3.50 | N/A | N/A |
| EPC Database All buildings 75th percentile Air-to-Water ASHP | 4.04 | N/A | N/A |
| EPC Database All buildings 90th percentile Air-to-Water ASHP | 4.55 | N/A | N/A |
| EPC Database All buildings 50th percentile Air-to-Air ASHP | 4.15 | N/A | N/A |
| EPC Database All buildings 75th percentile Air-to-Air ASHP | 4.60 | N/A | N/A |
| EPC Database All buildings 90th percentile Air-to-Air ASHP | 5.45 | N/A | N/A |
[1] (Scottish Government, 2021b)
[2] (Health and Safety Executive, 2023)
[3] (London Energy Transformation Initiative, 2020)
| Data Source | High demand: ASHP | High demand: Direct Electric | High demand: District Heating | Low demand: Direct Electric |
|---|---|---|---|---|
| Section 6 (2022) notional | 2.70 | Natural gas boiler – 93% | Natural gas boiler – 93% | 100% |
| 2021 Scottish Energy Standards consultation [1] | 2.70 | Natural gas boiler – 93% | Natural gas boiler – 93% | 100% |
| Part L 2025 England Consultation: Side-lit [2] | 2.86 | 2.86 | District heating 0.034kgCO2/kWh 0.694kWhPE/kWh | 100% |
| Part L 2025 England Consultation: Top-lit [2] | 2.86 | 2.86 | District heating 0.034kgCO2/kWh 0.694kWhPE/kWh | 100% |
| LETI Climate Emergency Design Guide [3] | ≥ 2.8 | Not recommended | Not recommended | ≥ 2.8 |
[1] (Scottish Government, 2021b)
[2] (Health and Safety Executive, 2023)
[3] (London Energy Transformation Initiative, 2020)
| Variable | Section 6 notional 2022 | Low | Medium | High |
|---|---|---|---|---|
| ASHP Space Heating SCOP (including 10% in-building delivery losses) | 3.00 | 3.15 | 3.63 | 4.10 |
| Direct Electric Space Heating SCOP | 93% (Natural gas) | 100% | 100% | 100% |
| District Heating Space Heating SCOP (including 10% in-building delivery losses) | 93% (Natural gas) | 90% | 90% | 90% |
| High DHW Demand: Heat Pump generator efficiency | 2.70 | 3.25 | 3.25 | 3.25 |
| High DHW Demand: Direct electric generator efficiency | 93% (Natural gas) | 100% | 100% | 100% |
| High DHW Demand: District heating generator efficiency | 93% (Natural gas) | 100% | 100% | 100% |
| Low DHW Demand: Direct electric generator efficiency | 100% | 100% | 100% | 100% |
3.1.4 Building Services: Cooling
Demand for cooling has increased significantly over the last two decades driven by higher comfort expectations of building occupants, warmer weather, reduced costs and economic forces encouraging the development of deep-plan mechanically ventilated buildings. Being closely related to ASHPs, chiller technology is also undergoing similar developments to improve efficiency and reduce the GWP of refrigerants used.
There are marked differences between the performance of Air-to-Air heat pumps, such as those in split or DX systems, and Air-to-Water heat pumps, which generate chilled water for distribution around the building. Air-to-Air heat pumps are typically more efficient but are not suitable for all building types and typically have a higher refrigerant charge, with resulting impacts on a building’s embodied carbon. Therefore, the proposed improvement options are based on the performance of Air-to-Water systems, which are generally feasible in all building types. This results in the values proposed for the future standard being slightly less efficient than the current standard. There was found to be negligible difference between the values indicated in the EPC database for the 50th and 75th percentiles, and so the low and medium values selected are both the same.
| Data Source | Cooling System (SEER) |
|---|---|
| Section 6 (2022) notional | 6.4 (SSEER = 5.1) |
| 2021 Scottish Energy Standards consultation [1] | 6.4 |
| Part L 2025 England Consultation [2] | 5.5 (SSEER = 4.4) |
| LETI Climate Emergency Design Guide [3] | ≥ 5.5 |
| EPC Database All buildings 50th percentile Air-to-Water Cooling | 5.5 |
| EPC Database All buildings 75th percentile Air-to-Water Cooling | 5.6 |
| EPC Database All buildings 90th percentile Air-to-Water Cooling | 6.0 |
| EPC Database All buildings 50th percentile Air-to-Air Cooling | 5.8 |
| EPC Database All buildings 75th percentile Air-to-Air Cooling | 6.7 |
| EPC Database All buildings 90th percentile Air-to-Air Cooling | 7.4 |
[1] (Scottish Government, 2021b)
[2] (Health and Safety Executive, 2023)
[3] (London Energy Transformation Initiative, 2020)
| Variable | Section 6 notional 2022 | Low | Medium | High |
|---|---|---|---|---|
| Cooling SEER (including 20% in-building delivery losses) | 6.4 | 5.5 | 5.5 | 6.0 |
3.1.5 Building Services: Lighting
The last few years have seen significant improvements in the efficacy of installed lighting systems through the increasing deployment of LED technology; to the extent that LED fittings are considered ‘business as usual’ for new buildings. Data suggests that since 2010, when LEDs were introduced to market, the average efficacy of LEDs has improved by approximately 4lm/W per year (International Energy Agency, 2023). However, whilst efficacy improvements continue, these are noted to have been slowing more recently, with increased efficacies resulting from improvements to small gains across all aspects, rather than one specific technology advancement (Ross, 2023). Figure 44 illustrates the improvements in different lighting technologies across the period 2010 to 2022, the latest date for which data was available, with the average LED efficacy reaching 111 lm/W in 2022.
The efficacy of luminaires in the 2022 Section 6 notional building is 95 llm/cW. Acknowledging sources suggesting that the future scope for improvement in LED technology may be plateauing, compared to improvements seen in the past 12 years, the proposed modelling options include a luminaire efficacy of 110 llm/cW for the medium option and 125 llm/cW for the high option (refer to Table 32).
These proposed values are lower than those proposed in the 2021 Scottish Energy Standards and English Part L 2025 consultations; however, the values proposed have been chosen as they reflect a challenging but achievable specification suitable for most, if not all, building types.
It is proposed to retain the current display lighting efficacy (95 llm/cW) in all modelling options, as the functional requirements associated with these types of fitting typically limit the efficacy they may achieve.
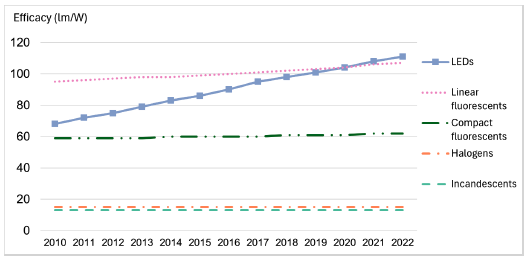
Source: IEA. Licence: CC BY 4.0 (International Energy Agency, 2023)
| Data Source | General Lighting efficiency | Display Lighting efficiency |
|---|---|---|
| Section 6 (2022) notional | 95 llm/cW | 95 llm/cW |
| 2021 Scottish Energy Standards consultation [1] | 125 llm/cW | 125 llm/cW |
| Part L 2025 England Consultation: Side-lit [2] | 150 llm/cW | 105 llm/cW |
| Part L 2025 England Consultation: Top-lit [2] | 170 llm/cW | 105 llm/cW |
| LETI Climate Emergency Design Guide [3] | 4.5 W/m² | Not given |
[1] (Scottish Government, 2021b)
[2] (Health and Safety Executive, 2023)
[3] (London Energy Transformation Initiative, 2020)
| Variable | Section 6 notional 2022 | Low | Medium | High |
|---|---|---|---|---|
| General lighting luminaire efficacy (llm/cW) | 95 | 95 | 110 | 125 |
| Automatic daylight lighting control | All rooms that receive daylight directly (i.e. have an external window) | All rooms that receive daylight directly (i.e. have an external window) | All rooms that receive daylight directly (i.e. have an external window) | All rooms that receive daylight directly (i.e. have an external window) |
| Automatic occupancy lighting control | Manual-On-Auto-Off | Manual-On-Auto-Off | Manual-On-Auto-Off | Manual-On-Auto-Off |
| Automatic control parasitic power (W/m²) | 0.1 | 0.1 | 0.1 | 0.1 |
| Display lighting luminaire efficacy (llm/cW) | 95 | 95 | 95 | 95 |
| Display lighting control | No time-switch control | Time-switch control | Time-switch control | Time-switch control |
3.1.6 Building Services: Ventilation
Where the 2022 Section 6 notional building uses central supply and extract ventilation, it has a specific fan power (SFP) of 1.8 W/l/s, heat recovery efficiency of 76% and fans controlled by gas (CO2) sensors.
The proposed modelling specifications do not include improved SFPs for fans, as these are typically challenging to improve on in larger buildings where longer duct runs and the associated pressure drops limit the potential for SFP reduction.
Ventilation heat recovery systems can achieve efficiencies in excess of 90%. For example, of the 1,235 plate heat exchanger entries in the Eurovent certified product directory, 124 have a heat recovery efficiency of greater than 90% (Eurovent Certified Performance, 2025).
Acknowledging that specific building requirements may restrict the use of the highest efficiency units, the medium and high options have been set at heat recovery efficiencies of 80% and 85% respectively.
| Data Source | Central AHU SFP (W/l/s) | Terminal Unit SFP (W/l/s) | Local Supply and Extract Ventilation SFP (W/l/s) | Ventilation heat recovery efficiency (%) |
|---|---|---|---|---|
| Section 6 (2022) notional | 1.80 | 0.30 | 0.90 | 76 |
| 2021 Scottish Energy Standards consultation [1] | 1.80 | 0.30 | 0.90 | 76 |
| Part L 2025 England Consultation [2] | 1.80 | 0.30 | 0.90 | 80 or 50 (where flagged) |
| LETI Climate Emergency Design Guide [3] | 1.20 – 1.50 | Not advised | Not advised | 90 |
[1] (Scottish Government, 2021b)
[2] (Health and Safety Executive, 2023)
[3] (London Energy Transformation Initiative, 2020)
| Variable | Section 6 notional 2022 | Low | Medium | High |
|---|---|---|---|---|
| Central AHU SFP (W/l/s) | 1.80 | 1.80 | 1.80 | 1.80 |
| Terminal Unit SFP (W/l/s) | 0.30 | 0.30 | 0.30 | 0.30 |
| Ventilation heat recovery efficiency (%) | 76 | 76 | 80 | 85 |
| Demand control ventilation | - | - | - | - |
[1] In all cases demand control of ventilation is provided through variable fan speed control based on CO₂ sensors
3.1.7 On-site Energy Generation
Table 37 compares the 2022 Section 6 notional photovoltaic (PV) array size with those from the other sources described above. Table 38 shows the proposed ‘Low’, ‘Medium’ and ‘High’ photovoltaic array sizes for modelling analyses to support proposed changes to Section 6.
The 2022 Section 6 notional building has a PV array sized to the lesser of 15% of the GIA and 30% of the foundation area (used as a proxy for roof area). This is reduced on a pro-rata basis where the space heating is met by an electric heat pump, such that if all of the space heating demand is met by an electric heat pump the notional building does not include any PV. Where the notional building benefits from a PV array, the benefit is limited by excluding any exported energy from the Target Emissions and Target Delivered Energy Rates.
The proposed ‘Low’ modelling option, as described in Table 38, aligns with the current Section 6 notional building, but removes the limiting factor where PV area is reduced when space heating demand is met by an electric heat pump. The ‘Medium’ and ‘High’ options are proposed to include a PV array covering 60% of the building’s roof area; with this metric chosen as it encourages the inclusion of on-site generation.
This PV area is towards the upper end of what could be practically included on a building, accounting for spacing requirements for maintenance and other roof top plant. This is an ambitious standard that explores the maximum potential for improvement, acknowledging that other improvements to a building’s design are more limited.
Note that the values in Table 38 are based on the same PV output as is currently used for the notional building under Section 6 2022 (i.e. 0.2 kWp/m², which is unshaded, facing South at 30º pitch from horizontal).
| Data Source | Maximum PV array size | Limiting factors |
|---|---|---|
| Section 6 (2022) notional | Lesser of: 15% of GIA or 30% of foundation area | Reduced proportionally with the percentage of space heating demand met by an electric heat pump and excluding exported energy |
| 2021 Scottish Energy Standards consultation [1] | 13% of floor area | Reduced proportionally with the percentage of space heating demand met by an electric heat pump and excluding exported energy |
| Part L 2025 England Consultation [2]: Option 1 | 40% of side-lit foundation area and 70% of top-lit foundation area | N/A |
| Part L 2025 England Consultation [2]: Option 2 | 20% of side-lit foundation area and 40% of top-lit foundation area | N/A |
| LETI Climate Emergency Design Guide [3] | To generate the annual energy requirement for at least two floors of the development on-site | N/A |
[1] (Scottish Government, 2021b)
[2] (Health and Safety Executive, 2023)
[3] (London Energy Transformation Initiative, 2020)
| PV Area lesser of: | Section 6 notional 2022 | Low | Medium | High |
|---|---|---|---|---|
| % of conditioned GIA | 15 | 15 | N/A | N/A |
| % of foundation area | 30 | 30 | 60 | 60 |
3.2 Selection of Improved Notional Buildings
Scottish Government requested that up to three options (low/medium/high) be taken forwards for modelling. These should be informed by the findings set out above.
The potential specifications set out in Sections 3.1 have been used to create three options for 2021 standards. Table 39Table 43 summarise the options shortlisted for modelling and agreed with the client.
The following table summarises the low, medium and high specifications for modelling; drawing together inputs previously reported in Sections 3.1.1 to 3.1.7.
| Variable | Section 6 2022 notional | Low | Medium | High |
|---|---|---|---|---|
| Wall U-Value (W/m²K) | 0.15 | 0.15 | 0.15 | 0.15 |
| Roof U-Value (W/m²K) | 0.11 | 0.11 | 0.11 | 0.10 |
| Floor U-Value (W/m²K) | 0.13 | 0.13 | 0.13 | 0.12 |
| Windows U-Value (W/m²K) | 1.20 | 1.20 | 1.20 | 0.80 |
| Windows G-value | 0.50 | 0.50 | 0.50 | 0.40 |
| Windows Light Transmittance | 0.77 | 0.77 | 0.77 | 0.60 |
| Rooflight U-Value (W/m²K) | 1.90 | 1.90 | 1.90 | 1.60 |
| Rooflight G-value | 0.50 | 0.50 | 0.50 | 0.401 |
| Rooflight Light Transmittance | 0.77 | 0.77 | 0.77 | 0.60 |
| Thermal Bridging | As per NCM guide paragraphs 106, 107 and table 9 | As per NCM guide paragraphs 106, 107 and table 9 | As per NCM guide paragraphs 106, 107 and table 9 | As per NCM guide paragraphs 106, 107 and table 9 |
| Air Tightness (m³/m².hr at 50Pa) | 4 | 5 | 4 | 3 |
| Variable | Section 6 2022 notional | Low | Medium | High |
|---|---|---|---|---|
| ASHP Heating SCOP Based on Air to Water (including 10% in-building delivery losses) | 3.00 | 3.15 Flow Temp @ 55°C | 3.63 Flow temp between 50°C and 55°C | 4.10 Flow temp @ 45°C |
| Direct Electric SCOP (no delivery losses) | Natural gas – 93% (including 10% in-building delivery losses) | 100% | 100% | 100% |
| District Heating Heating SCOP (including 10% in-building delivery losses) | Natural gas – 93% | 90% Flow Temp @ 55°C | 90% Flow Temp @ 55°C | 90% Flow Temp @ 55°C |
| Cooling SEER (20% in-building delivery losses) | 6.4 (SSEER = 5.1) | 5.5 (SSEER = 4.4) | 5.5 (SSEER = 4.4) | 6.0 (SSEER = 4.8) |
| Variable | Section 6 2022 notional | Low | Medium | High |
|---|---|---|---|---|
| High Demand: Heat Pump | 2.70 plus storage and circulation | 3.25 plus storage and circulation | 3.25 plus storage and circulation | 3.25 plus storage and circulation |
| High Demand: District Heating | Natural gas – 93% plus storage and circulation | 100% plus storage and circulation | 100% plus storage and circulation | 100% plus storage and circulation |
| High Demand: Direct Electric | Natural gas – 93% plus storage and circulation | 100% point-of-use | 100% point-of-use | 100% point-of-use |
| Low Demand: Direct Electric | 100% point-of-use | 100% point-of-use | 100% point-of-use | 100% point-of-use |
| Variable | Section 6 2022 notional | Low | Medium | High |
|---|---|---|---|---|
| Lighting Luminaire (llm/cW) | 95 | 95 | 110 | 125 |
| Daylight Lighting Control | All rooms that receive daylight directly (i.e. have an external window | All rooms that receive daylight directly (i.e. have an external window | All rooms that receive daylight directly (i.e. have an external window | All rooms that receive daylight directly (i.e. have an external window |
| Occupancy Lighting Control | Manual-On-Auto-Off | Manual-On-Auto-Off | Manual-On-Auto-Off | Manual-On-Auto-Off |
| Parasitic Power (W/m²) | 0.1 | 0.1 | 0.1 | 0.1 |
| Display Lighting (lm/cW) | 95 | 95 | 95 | 95 |
| Display Lighting Control | None | Time switch | Time switch | Time switch |
| Central ventilation SFP (W/l/s) | 1.80 | 1.80 | 1.80 | 1.80 |
| Terminal unit SFP (W/l/s) | 0.30 | 0.30 | 0.30 | 0.30 |
| Ventilation Heat Recovery (%) | 76 | 76 | 80 | 85 |
| Demand Control Ventilation | Demand control of ventilation through variable fan speed control based on CO2 sensors | Demand control of ventilation through variable fan speed control based on CO2 sensors | Demand control of ventilation through variable fan speed control based on CO2 sensors | Demand control of ventilation through variable fan speed control based on CO2 sensors |
| Variable speed pumping | Variable speed pumping with multiple pressure sensors in the system | Variable speed pumping with multiple pressure sensors in the system | Variable speed pumping with multiple pressure sensors in the system | Variable speed pumping with multiple pressure sensors in the system |
| PV Array Area Lesser of: | Section 6 2022 notional | Low | Medium | High |
|---|---|---|---|---|
| % of conditioned GIA | 15% | 15% | NA | NA |
| % of foundation area | 30% | 30% | 60% | 60% |
3.3 Delivered Energy Rate and Space Heating Demand
This section explores the relationship between delivered energy and space heating demand and evaluates the rationale for introducing a space heating demand limit, and whether this should have primacy over the current TDER.
Delivered energy refers to the energy supplied to a building from external sources. It is calculated as the total energy demand minus any offset from onsite renewable generation. Delivered energy totals for each fuel type are then used to derive primary energy and emissions figures.
The analysis below is based on SBEM modelling, as detailed in Section 4.1.
| Subtype | Heating | Cooling | Auxiliary | Lighting | Hot Water | Total |
|---|---|---|---|---|---|---|
| Shallow Office; DHN; NV | 25.9 | 0.0 | 1.0 | 8.3 | 2.7 | 37.9 |
| Deep Office AC; Elec; AC – HP | 1.7 | 6.1 | 14.9 | 10.6 | 2.6 | 35.9 |
| Heath centre; DHN; MV | 24.8 | 0.0 | 7.3 | 11.2 | 3.4 | 46.7 |
| Hotel; Elec; NV – DE | 81.7 | 0.0 | 2.2 | 8.7 | 172.6 | 265.3 |
| Retail; Elec; AC – HP | 2.9 | 33.5 | 18.4 | 15.6 | 1.6 | 72.1 |
| Retail; Elec; MV – HP | 6.1 | 0.0 | 7.9 | 15.6 | 1.6 | 31.2 |
| Secondary School; DHN; AC | 13.6 | 3.0 | 16.9 | 7.7 | 19.2 | 60.3 |
| Secondary School; Elec; MV – HP | 7.2 | 0.1 | 7.5 | 7.7 | 11.4 | 33.8 |
| Secondary School; Elec; NV – DE | 29.0 | 0.1 | 11.3 | 7.7 | 16.4 | 64.4 |
| Warehouse Distribution; Elec; AC – HP | 12.0 | 4.7 | 65.7 | 4.4 | 7.4 | 94.2 |
| Warehouse Distribution; Elec; MV – DE | 66.1 | 0.0 | 7.8 | 4.4 | 15.1 | 93.4 |
| Subtype | Heating | Cooling | Auxiliary | Lighting | Hot Water |
|---|---|---|---|---|---|
| Shallow Office; DHN; NV | 68% | 0% | 3% | 22% | 7% |
| Deep Office AC; Elec; AC – HP | 5% | 17% | 42% | 29% | 7% |
| Heath centre; DHN; MV | 53% | 0% | 16% | 24% | 7% |
| Hotel; Elec; NV - DE | 31% | 0% | 1% | 3% | 65% |
| Retail; Elec; AC - HP | 4% | 46% | 26% | 22% | 2% |
| Retail; Elec; MV - HP | 20% | 0% | 25% | 50% | 5% |
| Secondary School; DHN; AC | 23% | 5% | 28% | 13% | 32% |
| Secondary School; Elec; MV – HP | 21% | 0% | 22% | 23% | 34% |
| Secondary School; Elec; NV – DE | 45% | 0% | 18% | 12% | 25% |
| Warehouse Distribution; Elec; AC - HP | 13% | 5% | 70% | 5% | 8% |
| Warehouse Distribution; Elec; MV - DE | 71% | 0% | 8% | 5% | 16% |
Table 44 and Table 45 present delivered energy consumption by end use, revealing distinct patterns across building archetypes:
- Warehouse Distribution; Elec; MV - DE: Highest proportion of delivered energy attributed to space heating.
- Retail; Elec; AC - HP: Lowest space heating share; highest space cooling share.
- Retail; Elec; MV - HP: Highest energy share allocated to lighting.
- Hotel; Elec; NV - DE: Highest share allocated to hot water.
- Deep Office AC; Elec; AC - HP and Warehouse Distribution; Elec; AC - HP: Peak energy use directed toward auxiliary services (fans and pumps).
To assess correlations between delivered energy and space heating demand, Table 46 to Table 48 compare SBEM outputs across three specifications: BAU, Medium, and High, each incorporating the following performances:
- BAU: Baseline reflecting current standard practices.
- Medium: Improves heating system efficiency, lighting efficacy, ventilation heat recovery, and PV area. Building fabric remains unchanged.
- High: Builds on Medium with further upgrades to heating, lighting, ventilation, and building fabric.
Figure 45 and Figure 46 visualise these trends, where it is seen that across most archetypes, a linear correlation emerges as space heating demand decreases, delivered energy also declines.
| Subtype | Space Heating Demand ( kWh/m²) | Space Cooling Demand ( kWh/m²) | Delivered Energy Rate ( kWh/m²) |
|---|---|---|---|
| Shallow Office; DHN; NV | 23.3 | - | 35.2 |
| Deep Office AC; Elec; AC – HP | 5.4 | 26.7 | 34.4 |
| Heath centre; DHN; MV | 22.4 | - | 42.8 |
| Hotel; Elec; NV – DE | 81.7 | - | 262.6 |
| Retail; Elec; AC – HP | 9.3 | 147.4 | 68.1 |
| Retail; Elec; MV – HP | 19.2 | - | 27.3 |
| Secondary School; DHN; AC | 9.8 | 15.3 | 56.4 |
| Secondary School; Elec; MV – HP | 22.8 | - | 29.9 |
| Secondary School; Elec; NV – DE | 29.4 | - | 60.4 |
| Warehouse Distribution; Elec; AC – HP | 74.5 | 16.7 | 90.3 |
| Warehouse Distribution; Elec; MV – DE | 116.4 | - | 89.5 |
| Subtype | Space Heating Demand ( kWh/m²) | Space Cooling Demand ( kWh/m²) | Delivered Energy Rate ( kWh/m²) |
|---|---|---|---|
| Shallow Office; DHN; NV | 22.5 | - | 30.8 |
| Deep Office AC; Elec; AC – HP | 4.7 | 26.4 | 31.0 |
| Heath centre; DHN; MV | 21.2 | - | 34.8 |
| Hotel; Elec; NV – DE | 79.9 | - | 257.0 |
| Retail; Elec; AC – HP | 7.8 | 149.5 | 53.6 |
| Retail; Elec; MV – HP | 17.5 | - | 11.9 |
| Secondary School; DHN; AC | 8.6 | 15.2 | 49.6 |
| Secondary School; Elec; MV – HP | 22.3 | - | 23.2 |
| Secondary School; Elec; NV – DE | 28.9 | - | 54.4 |
| Warehouse Distribution; Elec; AC – HP | 73.1 | 16.3 | 75.3 |
| Warehouse Distribution; Elec; MV – DE | 115.7 | - | 77.2 |
| Subtype | Space Heating Demand ( kWh/m²) | Space Cooling Demand ( kWh/m²) | Delivered Energy Rate ( kWh/m²) |
|---|---|---|---|
| Shallow Office; DHN; NV | 19.0 | - | 26.4 |
| Deep Office AC; Elec; AC – HP | 2.8 | 25.3 | 28.2 |
| Heath centre; DHN; MV | 16.9 | - | 29.3 |
| Hotel; Elec; NV – DE | 72.2 | - | 248.8 |
| Retail; Elec; AC – HP | 5.9 | 152.2 | 49.0 |
| Retail; Elec; MV – HP | 15.1 | - | 9.8 |
| Secondary School; DHN; AC | 6.2 | 13.9 | 45.9 |
| Secondary School; Elec; MV – HP | 20.6 | - | 21.6 |
| Secondary School; Elec; NV – DE | 27.3 | - | 52.5 |
| Warehouse Distribution; Elec; AC – HP | 69.9 | 13.5 | 64.0 |
| Warehouse Distribution; Elec; MV – DE | 113.1 | - | 76.2 |
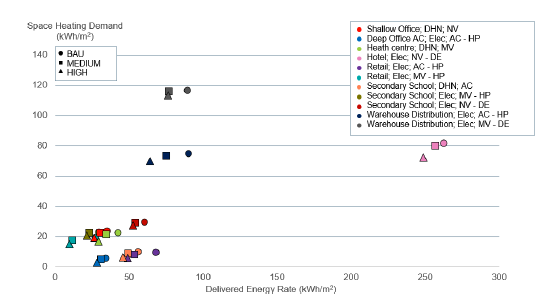
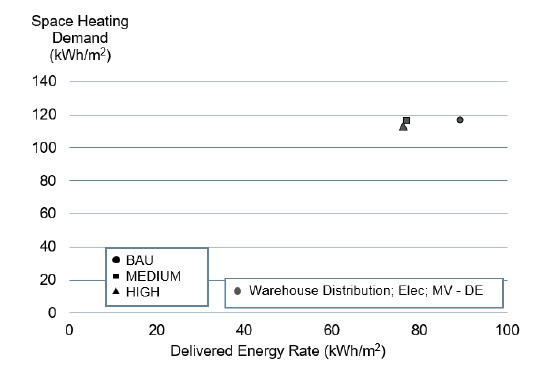
Analysing the data, it is seen that for the “Warehouse Distribution; Elec; MV - DE” archetype which shows the highest proportion of delivered energy attributed to space heating:
- The shift from BAU to the Medium Specification results in a 14% reduction in delivered energy rate, while space heating demand decreases only slightly by 1%. This discrepancy indicates that the majority of savings stem from system level efficiency improvements rather than reductions in thermal demand.
- Further upgrades to the High Specification, result in a further reduction in delivered energy rate, bringing total savings to 15% compared to BAU. However, the space heating demand remains largely unchanged, with only a further 2% reduction.
- These results, suggest that most energy savings within this archetype are driven by improvements in system efficiency, rather than reductions in space heating demand.
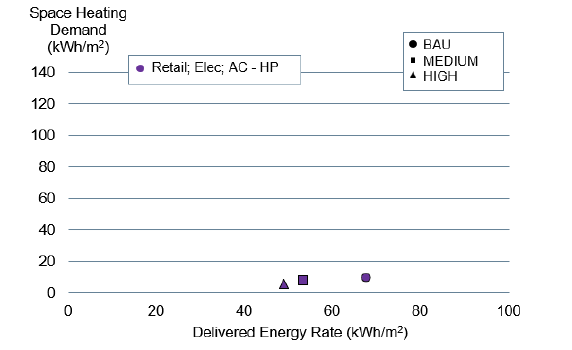
Focusing now on the “Retail; Elec; AC - HP” which has the lowest share of energy attributed to space heating and the highest to space cooling:
- Moving from BAU to the Medium Specification sees a 21% reduction in delivered energy rate, alongside a 16% reduction in space heating demand. Notably space cooling demand increases by 1%.
- The High specification enhances savings further where delivered energy rate drops by an additional 7% (28% total reduction relative to BAU) with space heating demand falling by another 20% (36% total reduction). Space cooling demand rises modestly again by 2% (3% relative to BAU).
- Here, reductions in delivered energy rate are closely tied to changes in space heating demand, demonstrating a higher sensitivity to thermal improvements.
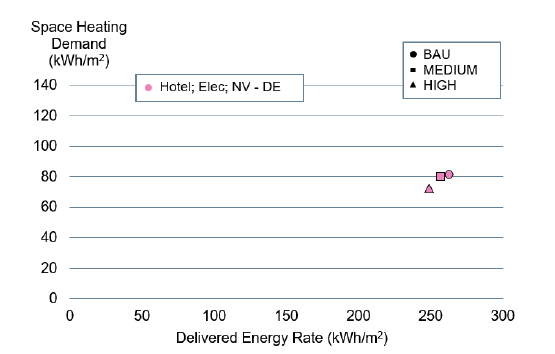
Looking at the Hotel; Elec; NV – DE which has the highest share allocated to Hot Water:
- Transitioning from the BAU scenario to the Medium Specification results in a 2% reduction in both delivered energy rate and space heating demand.
- Under the High Specification, delivered energy decreases by an additional 3% (total 5% reduction), while space heating demand drops by a further 10% (total 12% reduction).
- Although space heating demand shows significant improvement, the overall reduction in delivered energy is less pronounced. This is because hot water, the dominant end use, continues to account for the majority of delivered energy.
3.3.1 Implications and Observations
Comparing specifications across archetypes reveals that while delivered energy and space heating demand may be correlated for some building types, the relationship varies significantly depending on building type and system configuration.
- Fabric improvement measures typically reduce space heating requirements, but in climates where outdoor temperatures rarely exceed the cooling setpoints, these fabric measures can inadvertently increase space cooling demand. In the case of our Retail; Elec; AC - HP archetype, the reduction in space heating demand significantly outweighs any rise in cooling requirements.
- Furthermore, several energy performance enhancements, such as improvements to hot water system efficiency, fan efficiency, and on-site energy generation, have no impact on space heating demand. In buildings where these end uses dominate, focusing on space heating demand may not yield the greatest reductions in total delivered energy. Therefore, targeting other high-consumption systems could be more effective in maximising energy savings.
- As building standards continue to evolve and space heating requirements decline, the proportion of total energy use attributed to heating also decreases. Consequently, the correlation between delivered energy and space heating demand becomes progressively weaker, as other energy end uses dominate the overall demand.
3.3.2 Considerations for Implementing a Space Heating Demand Limit
The shifting relationship seen therefore has important implications for the introduction of a space heating demand limit as a secondary performance metric. Careful consideration must be given to how such limits are applied, as they may constrain design flexibility, particularly in buildings where fabric improvements have already been adopted.
In support of these reductions, LETI offers guidance aimed at achieving space heating demand levels of 15 kWh/m².yr across small-, medium- and large-scale housing, schools and commercial offices. Adopting a similar metric may offer a more practical and widely acceptable target, thereby expanding design options for design teams. PassivHaus Standards also sets an upper limit of 15 kWh/m².yr on space heating demand.
Modelling suggests that only three archetypes meet the LETI and PassivHaus space heating demand target of 15kWh/m² or less:
- Deep Office AC; Elec; AC – HP
- Retail; Elec; AC – HP
- Secondary School; DHN; AC.
Therefore, if this space heating demand target were to be adopted, further improvements in fabric performance, potentially through tightening fabric backstop values, would be required. This may not be feasible for all buildings to achieve.
In some building types, for example the Hotel; Elec; NV – DE archetype, although fabric measures can achieve significant savings in space heating demand, these do not result in similarly significant reductions to the overall energy demand as this is dominated by other end use (domestic hot water in this case). Therefore, setting a space heating demand metric as the primary compliance metric would not drive improvements in the end uses that contribute most significantly.
In addition to the space heating demand target, LETI also provides guidance on building form, specially through form factor ranges tailored to different building types:
- Small scale housing: Form factor of 1.7 - 2.5
- Medium and large-scale housing: Form factor of <0.8 - 1.5
- Commercial offices: Form factor of 1 - 2
- Schools: Form factor of 1 - 3
These form factor ranges reflect the relationship between a building’s surface area and its usable floor area, with lower values generally indicating more energy-efficient forms.
The following section explores how building form is currently addressed in the current building regulations.
3.4 Performance Target Modifier for Energy Efficient Design
Current notional building methodologies are limited to their ability to promote energy or carbon optimisation. Because the notional building uses the same built form and fuel type as the actual building design teams have little to no incentive to optimise architectural characteristics such as shape or orientation, since enhancements do not greatly affect compliance outcomes.
Introducing incentives linked to built form would be challenging to implement and risks unintended consequences. Such an approach would demand substantial further research into how design flexibility intersects with compliance metrics and urban planning constraints.
The geometry and location of buildings are shaped by site limitations, operational requirements and commercial viability. In dense urban settings, irregular plots often dictate the built form. Without considering these constraints, a new regulatory standard could unintentionally disadvantage urban developments, pushing growth towards out of town sites. This shift could increase car dependency, strain infrastructure, and accelerate habitat loss.
Operational requirements are a major influence on built form. Hospitals, schools, and factories, for example, require specific spatial arrangements to support their functions, such as the needs for infection control in hospitals, or the layout of storage racking and loading bay doors in warehouses. If regulations overlook these functional needs, buildings risk becoming oversized or spatially inefficient, leading to greater embodied carbon, higher construction costs and increased operational energy use. This challenge extends across all building types, as form directly affects the proportion of circulation and non-usable space.
Reducing energy demand remains a key objective in achieving regulatory compliance, yet built form impacts both regulated and unregulated energy consumption. One regulated aspect often overlooked is auxiliary energy, which is often underestimated by compliance tools. Less compact designs, typically lead to longer pipe and duct runs, increasing pressure losses and raising fan and pump energy use.
Lighting demand also varies with form. While less compact buildings can benefit from greater daylight penetration and reduced internal lighting loads, external lighting needs may rise due to longer perimeters. High-rise buildings with smaller floor plates may improve daylight access, further reducing internal demands.
The complex relationship between form and energy makes it challenging to incorporate built form parameters into Building Regulations as doing so may lead to unintended consequences. To mitigate suck risks it is recommended that built form not be directly incentivised within the target-setting framework. Instead, focused education and training for building designers, especially regarding the impact of façade design and form on energy efficiency and regulatory compliance should be prioritised.