Building regulations 2025 - new non-domestic buildings: energy standard improvements - modelling report

Research output to identify and assess potential improvements in energy and emissions performance for non-domestic buildings constructed in Scotland set via Section 6 of the Scottish Building Standards (energy). This was to inform the setting of targets within the next set of energy standards.


Appendix E PHPP Results

E.1 ShOffice NV
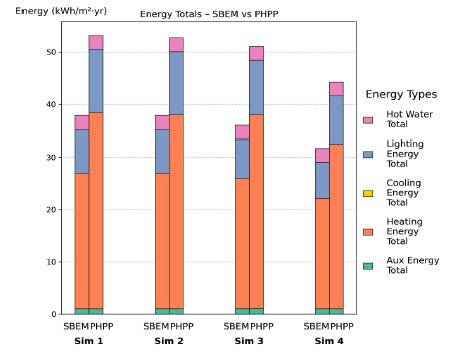
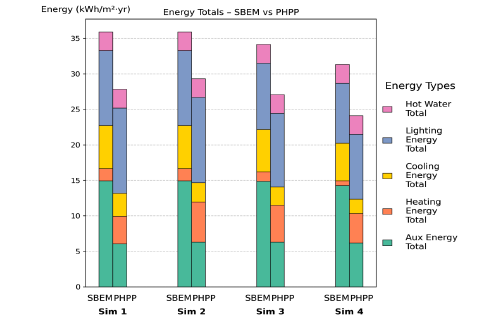
Figure 74: Simulations 1- 4: Energy comparison between SBEM and PHPP for 01 ShOffice NV (Total Floor Area: 2,160 m²).
Figure 74: Simulations 1–4 – Stacked bar chart comparing total annual energy use between SBEM and PHPP for 01 ShOffice (total floor area: 2,160 m²). Results are broken down into auxiliary, heating, cooling, lighting, and hot water energy components. Across all simulations (1-4), PHPP shows higher total energy use than SBEM, largely due to greater heating energy demand.
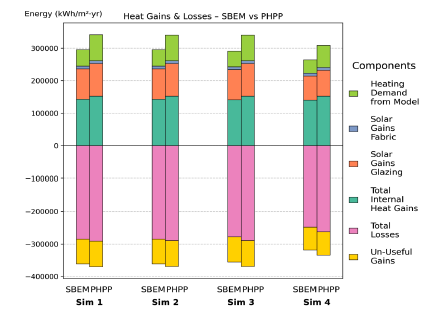
Figure 75: Energy Balance Comparison: PHPP vs SBEM – 01 ShOffice NV (Total Floor Area: 2,160 m²).
Figure 75: Simulations 1–4 – Energy balance comparison between SBEM and PHPP for 01 ShOffice NV (total floor area: 2,160 m²). The stacked bars show total internal heat gains, solar gains (glazing and fabric), total losses, un-useful gains, and heating demand from the model. Across all simulations, PHPP has slightly higher total gains and losses compared with the SBEM model, though the overall values are similar.
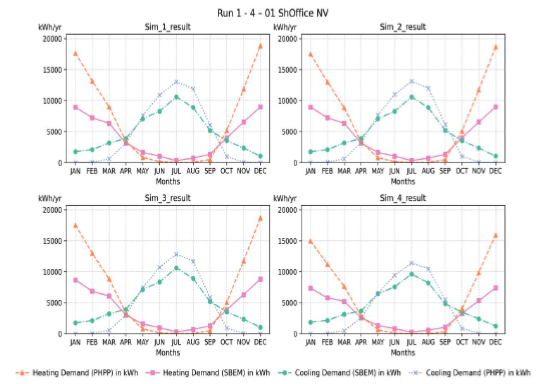
Figure 76: Monthly Heating & Cooling Demand for Simulations 1 - 4: 01 ShOffice NV (Total Floor Area: 2,160 m²).
Figure 76: Monthly heating and cooling demand for Simulations 1–4 – 01 ShOffice NV (total floor area: 2,160 m²). The graphs compare SBEM and PHPP results, showing seasonal patterns with higher heating demand in winter and higher cooling demand in summer. PHPP generally predicts higher cooling demand compared to SBEM from May to September.

E.2 DpOffice AC HP

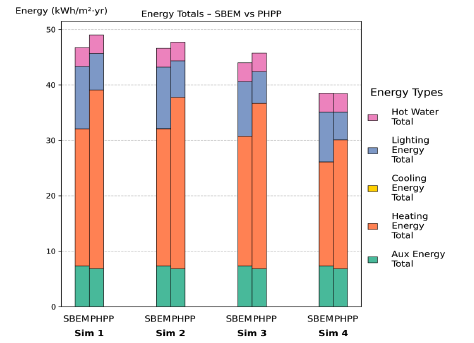
Figure 77: Simulations 1- 4: Energy comparison between SBEM and PHPP for 02 DpOffice AC HP (Total Floor Area: 12,000 m²).
Figure 77: Simulations 1–4 – Stacked bar chart comparing total annual energy use between SBEM and PHPP for 02 DpOffice AC HP (total floor area: 12,000 m²). Results are broken down into auxiliary, heating, cooling, lighting, and hot water energy components. Across all simulations (1-4), SBEM shows higher total energy use than PHPP, largely due to greater auxiliary, lighting and cooling energy totals.
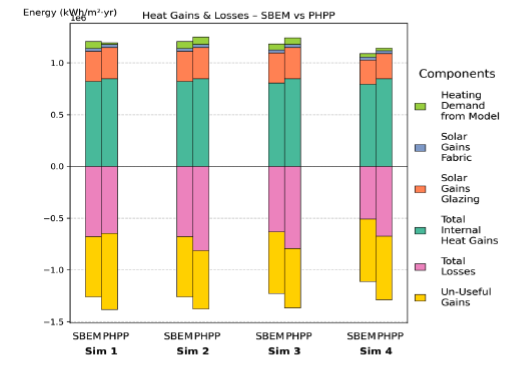
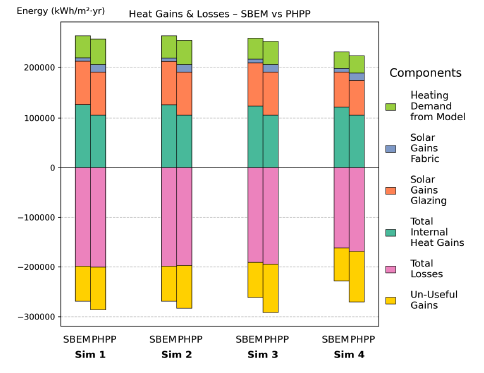
Figure 78: Energy Balance Comparison: PHPP vs SBEM – 02 DpOffice AC HP (Total Floor Area: 12,000 m²).
Figure 78: Simulations 1–4 – Energy balance comparison between SBEM and PHPP for 02 DpOffice AC HP (total floor area: 12,000 m²). The stacked bars show total internal heat gains, solar gains (glazing and fabric), total losses, un-useful gains, and heating demand from the model. Across all simulations, PHPP has slightly higher total gains and losses compared with the SBEM model, though the overall values are similar.
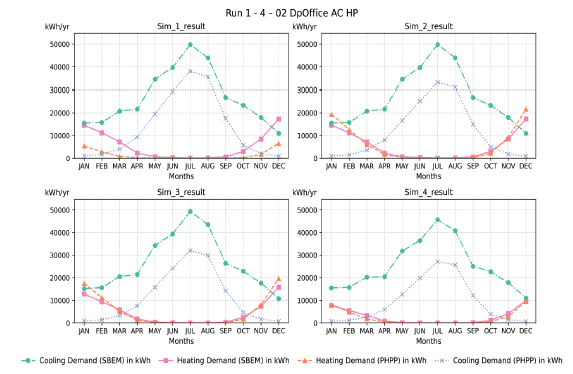
Figure 79: Monthly Heating & Cooling Demand for Simulations 1 - 4: 02 DpOffice AC HP (Total Floor Area: 12,000 m²).
Figure 79: Monthly heating and cooling demand for Simulations 1–4 – 02 DpOffice AC HP (total floor area: 12,000 m²). The graphs compare SBEM and PHPP results, showing seasonal patterns with higher heating demand in winter and higher cooling demand in summer. PHPP generally predicts lower cooling demand. The heating demand aligns closely.

E.3 HealthCtr MV

Figure 80: Simulations 1- 4: Energy comparison between SBEM and PHPP for 03 HealthCtr MV (Total Floor Area: 1,995.03 m²).
Figure 80: Simulations 1–4 – Stacked bar chart comparing total annual energy use between SBEM and PHPP for 03 HealthCtr MV (total floor area: 1,995.03 m²). Results are broken down into auxiliary, heating, cooling, lighting, and hot water energy components. Across all simulations (1-4), PHPP shows higher total energy use than SBEM, largely due to greater heating energy demand.
Figure 81: Energy Balance Comparison: PHPP vs SBEM – 03 HealthCtr MV (Total Floor Area: 1,995.03 m²).
Figure 81: Simulations 1–4 – Energy balance comparison between SBEM and PHPP for 03 HealthCtr MV (total floor area: 1,995.03 m²). The stacked bars show total internal heat gains, solar gains (glazing and fabric), total losses, un-useful gains, and heating demand from the model. Across all simulations, SBEM has slightly higher total gains and losses compared with the PHPP model, though the overall values are similar.
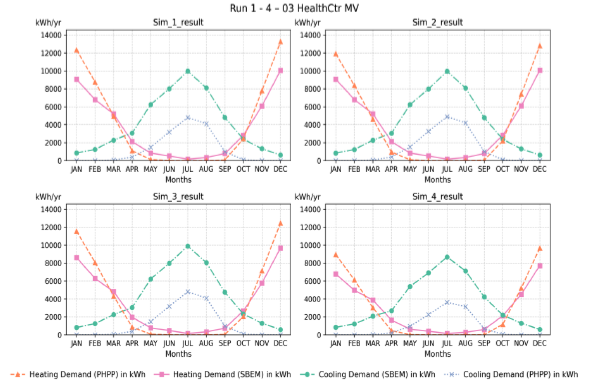
Figure 82: Monthly Heating & Cooling Demand for Simulations 1 - 4: 03 HealthCtr MV (Total Floor Area: 1,995.03 m²).

Figure 82: Monthly heating and cooling demand for Simulations 1–4 – 03 HealthCtr mv (total floor area: 1,995.03 m²). The graphs compare SBEM and PHPP results, showing seasonal patterns with higher heating demand in winter and higher cooling demand in summer. PHPP generally predicts lower cooling demand.

E.4 Hotel NV DE

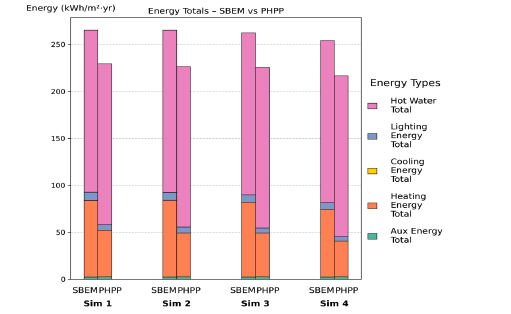
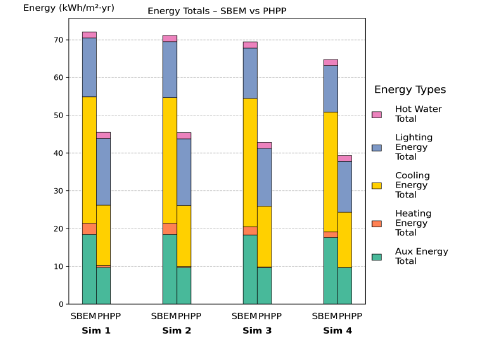
Figure 83: Simulations 1- 4: Energy comparison between SBEM and PHPP for 04 Hotel NV DE (Total Floor Area: 1,062.75 m²).
Figure 83: Simulations 1–4 – Stacked bar chart comparing total annual energy use between SBEM and PHPP for 04 Hotel NV DE (total floor area: 1,062.75 m²). Results are broken down into auxiliary, heating, cooling, lighting, and hot water energy components. Across all simulations (1-4), SBEM shows higher total energy use than PHPP, largely due to greater hot water energy and heating energy demand.
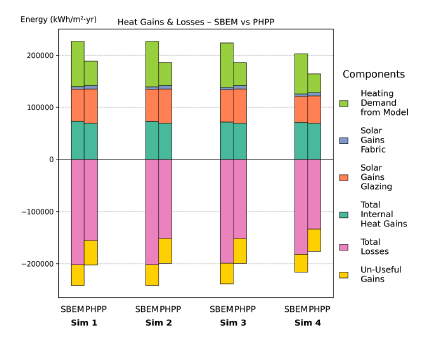
Figure 84: Energy Balance Comparison: PHPP vs SBEM – 04 Hotel NV DE (Total Floor Area: 1,062.75 m²).
Figure 84: Simulations 1–4 – Energy balance comparison between SBEM and PHPP for 04 Hotel NV DE (total floor area: 1,062.75 m²). The stacked bars show total internal heat gains, solar gains (glazing and fabric), total losses, un-useful gains, and heating demand from the model. Across all simulations, SBEM has slightly higher total gains and losses compared with the PHPP model, though the overall values are similar.
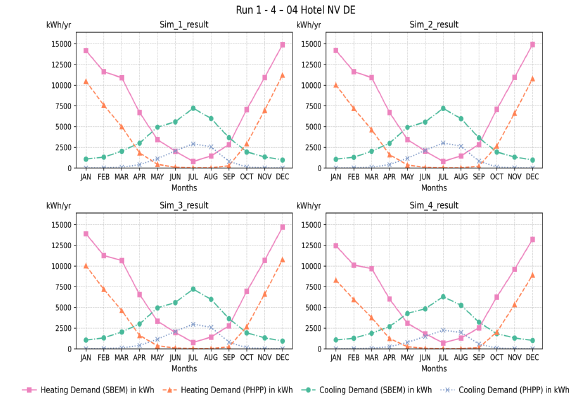
Figure 85: Monthly Heating & Cooling Demand for Simulations 1 - 4: 04 Hotel NV DE (Total Floor Area: 1,062.75 m²).
Figure 85: Monthly heating and cooling demand for Simulations 1–4 – 04 Hotel NV DE (total floor area: 1,062.75 m²). The graphs compare SBEM and PHPP results, showing seasonal patterns with higher heating demand in winter and higher cooling demand in summer. PHPP generally predicts lower cooling demand and heating demand profiles compared to SBEM.

E.5 Retail AC

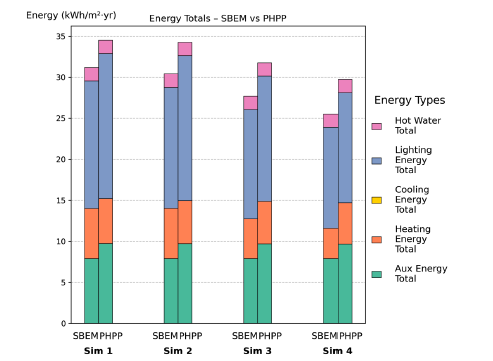
Figure 86: Simulations 1- 4: Energy comparison between SBEM and PHPP for 05 Retail AC (Total Floor Area: 1,250 m²).
Figure 86: Simulations 1–4 – Stacked bar chart comparing total annual energy use between SBEM and PHPP for 05 Retail AC (total floor area: 1,250 m²). Results are broken down into auxiliary, heating, cooling, lighting, and hot water energy components. Across all simulations (1-4), SBEM shows higher total energy use than PHPP, largely due to greater cooling and auxiliary energy.
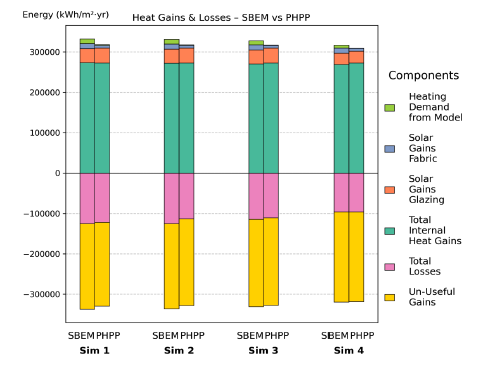
Figure 87: Energy Balance Comparison: PHPP vs SBEM – 05 Retail AC (Total Floor Area: 1,250 m²).
Figure 87: Simulations 1–4 – Energy balance comparison between SBEM and PHPP for 05 Retail AC (total floor area: 1,250 m²). The stacked bars show total internal heat gains, solar gains (glazing and fabric), total losses, un-useful gains, and heating demand from the model. Across all simulations, SBEM has slightly higher total gains and losses compared with the PHPP model, though the overall values are similar.
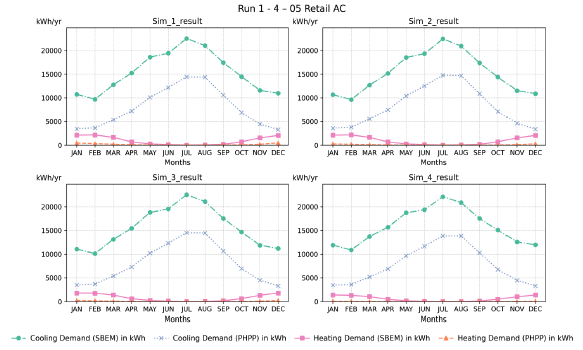
Figure 88: Monthly Heating & Cooling Demand for Simulations 1 - 4: 05 Retail AC (Total Floor Area: 1,250 m²).
Figure 88: Monthly heating and cooling demand for Simulations 1–4 – 05 Retail AC (total floor area: 1,250 m²). The graphs compare SBEM and PHPP results, showing seasonal patterns with higher heating demand in winter and higher cooling demand in summer. PHPP generally predicts lower cooling and heating demand profiles compared to SBEM.

E.6 Retail MV

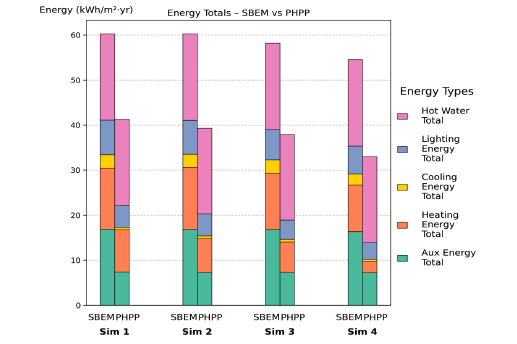
Figure 89: Simulations 1- 4: Energy comparison between SBEM and PHPP for 06 Retail MV (Total Floor Area: 1,250 m²).
Figure 89: Simulations 1–4 – Stacked bar chart comparing total annual energy use between SBEM and PHPP for 06 Retail MV (total floor area: 1,250 m²). Results are broken down into auxiliary, heating, cooling, lighting, and hot water energy components. Across all simulations (1-4), PHPP shows higher total energy use than SBEM, largely due to greater lighting energy.

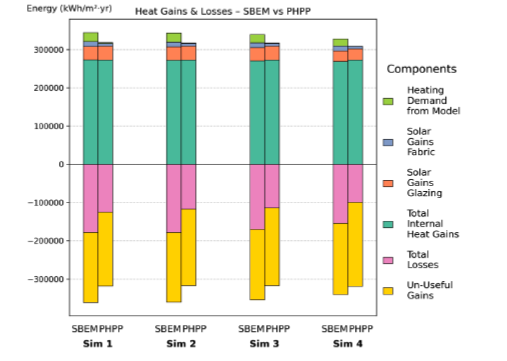
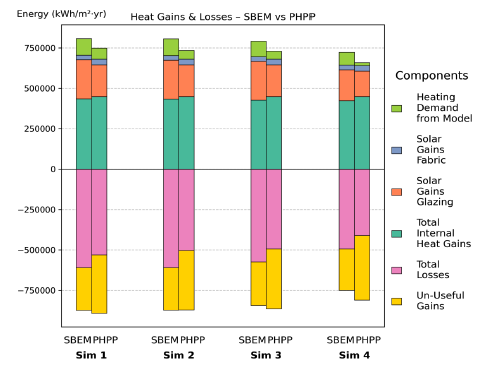
Figure 90: Energy Balance Comparison: PHPP vs SBEM – 06 Retail MV (Total Floor Area: 1,250 m²).
Figure 90: Simulations 1–4 – Energy balance comparison between SBEM and PHPP for 06 Retail MV (total floor area: 1,250 m²). The stacked bars show total internal heat gains, solar gains (glazing and fabric), total losses, un-useful gains, and heating demand from the model. Across all simulations, SBEM has slightly higher total gains and losses compared with the PHPP model, though the overall values are similar.
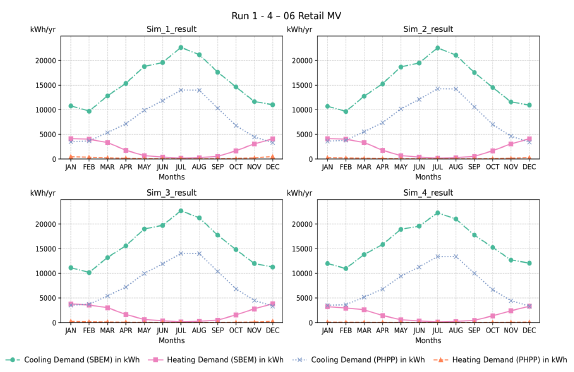
Figure 91: Monthly Heating & Cooling Demand for Simulations 1 - 4: 06 Retail MV (Total Floor Area: 1,250 m²).
Figure 91: Monthly heating and cooling demand for Simulations 1–4 – 06 Retail MV (total floor area: 1,250 m²). The graphs compare SBEM and PHPP results, showing seasonal patterns with higher heating demand in winter and higher cooling demand in summer. PHPP generally predicts lower cooling and heating demand profiles compared to SBEM.

E.7 SecSchool AC

Figure 92: Simulations 1- 4: Energy comparison between SBEM and PHPP for 07 SecSchool AC (Total Floor Area: 8,012.55 m²).
Figure 92: Simulations 1–4 – Stacked bar chart comparing total annual energy use between SBEM and PHPP for 07 SecSchool (total floor area: 8,012.55 m²). Results are broken down into auxiliary, heating, cooling, lighting, and hot water energy components. Across all simulations (1-4), SBEM shows higher total energy use than PHPP, largely due to greater auxiliary energy and heating energy demand.
Figure 93: Energy Balance Comparison: PHPP vs SBEM – 07 SecSchool AC (Total Floor Area: 8,012.55 m²).
Figure 93: Simulations 1–4 – Energy balance comparison between SBEM and PHPP for 07 SecSchool AC (total floor area: 8,012.55 m²). The stacked bars show total internal heat gains, solar gains (glazing and fabric), total losses, un-useful gains, and heating demand from the model. Across all simulations, SBEM has slightly higher total gains and losses compared with the PHPP model, though the overall values are similar.
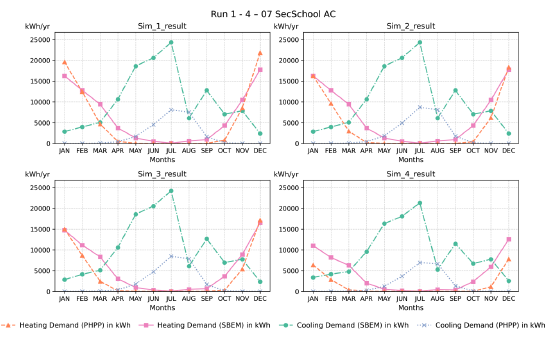
Figure 94: Monthly Heating & Cooling Demand for Simulations 1 - 4: 07 SecSchool AC (Total Floor Area: 8,012.55 m²).
Figure 94: Monthly heating and cooling demand for Simulations 1–4 – 07 SecSchool AC (total floor area: 8,012.55 m²). The graphs compare SBEM and PHPP results, showing seasonal patterns with higher heating demand in winter and higher cooling demand in summer. PHPP generally predicts lower cooling and heating demand profiles compared to SBEM.

E.8 SecSchool MV

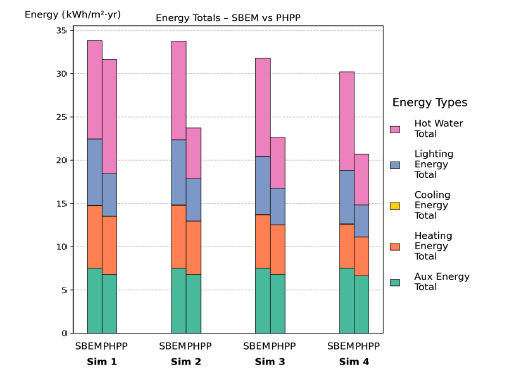
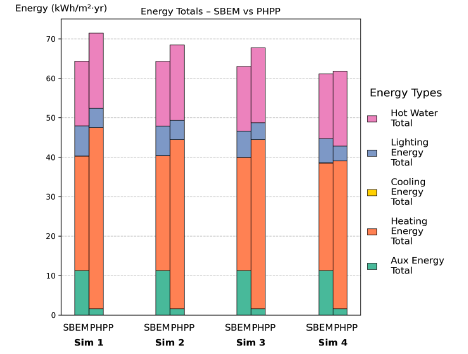
Figure 95: Simulations 1- 4: Energy comparison between SBEM and PHPP for 08 SecSchool MV (Total Floor Area: 8,012.55 m²).
Figure 95: Simulations 1–4 – Stacked bar chart comparing total annual energy use between SBEM and PHPP for 08 SecSchool MV (total floor area: 8,012.55 m²). Results are broken down into auxiliary, heating, cooling, lighting, and hot water energy components. Across all simulations (1-4), SBEM shows higher total energy use than PHPP, largely due to greater auxiliary and lighting energy.
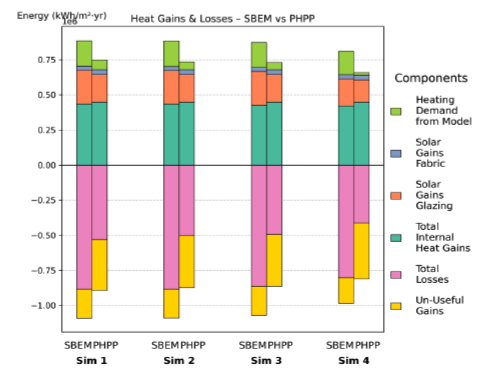
Figure 96: Energy Balance Comparison: PHPP vs SBEM – 08 SecSchool MV (Total Floor Area: 8,012.55 m²).
Figure 96: Simulations 1–4 – Energy balance comparison between SBEM and PHPP for 08 SecSchool MV (total floor area: 8,012.55 m²). The stacked bars show total internal heat gains, solar gains (glazing and fabric), total losses, un-useful gains, and heating demand from the model. Across all simulations, SBEM has slightly higher total gains and losses compared with the PHPP model, though the overall values are similar.
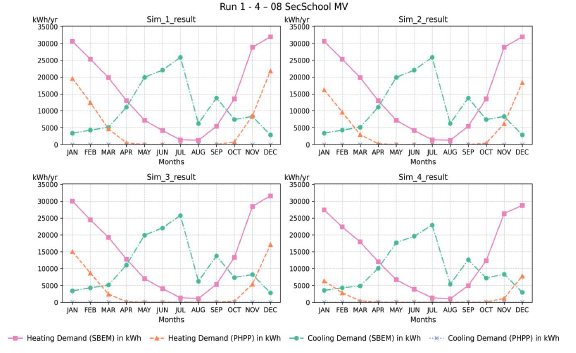
Figure 97: Monthly Heating & Cooling Demand for Simulations 1 - 4: 08 SecSchool MV (Total Floor Area: 8,012.55 m²).
Figure 97: Monthly heating and cooling demand for Simulations 1–4 – 08 SecSchool MV (total floor area: 8,012.55 m²). The graphs compare SBEM and PHPP results, showing seasonal patterns with higher heating demand in winter and higher cooling demand in summer. PHPP generally predicts lower cooling and heating demand profiles compared to SBEM.

E.9 SecSchool NV

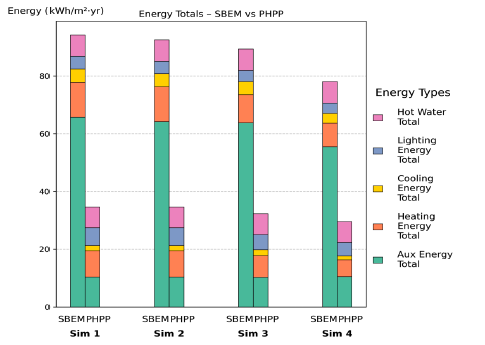
Figure 98: Simulations 1- 4: Energy comparison between SBEM and PHPP for 09 SecSchool NV (Total Floor Area: 8,012.55 m²).
Figure 98: Simulations 1–4 – Stacked bar chart comparing total annual energy use between SBEM and PHPP for 09 SecSchool NV (total floor area: 8,012.55 m²). Results are broken down into auxiliary, heating, cooling, lighting, and hot water energy components. Across all simulations (1-4), PHPP shows higher total energy use than PHPP, largely due to greater heating energy demand.
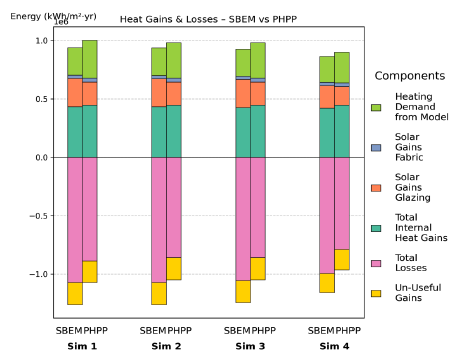
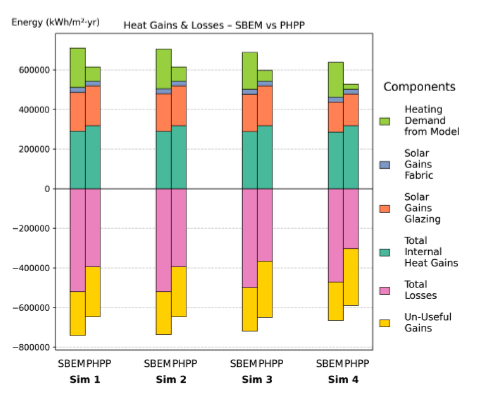
Figure 99: Energy Balance Comparison: PHPP vs SBEM – 09 SecSchool NV (Total Floor Area: 8,012.55 m²).
Figure 99: Simulations 1–4 – Energy balance comparison between SBEM and PHPP for 09 SecSchool NV (total floor area: 8,012.55 m²). The stacked bars show total internal heat gains, solar gains (glazing and fabric), total losses, un-useful gains, and heating demand from the model. Across all simulations, PHPP has slightly higher total gains and losses compared with the PHPP model, though the overall values are similar.
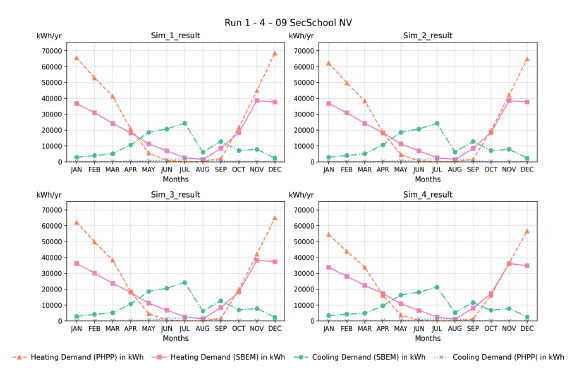
Figure 100: Monthly Heating & Cooling Demand for Simulations 1 - 4: 09 SecSchool NV (Total Floor Area: 8,012.55 m²).
Figure 100: Monthly heating and cooling demand for Simulations 1–4 – 09 SecSchool NV (total floor area: 8,012.55 m²). The graphs compare SBEM and PHPP results, showing seasonal patterns with higher heating demand in winter and higher cooling demand in summer.

E.10 DWare AC

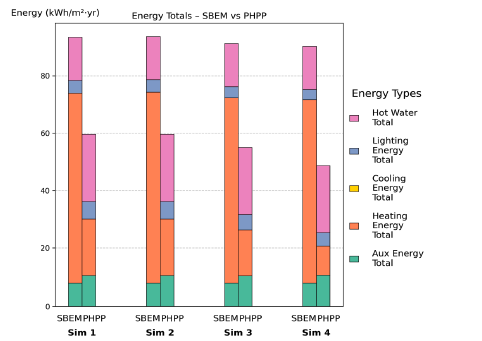
Figure 101: Simulations 1- 4: Energy comparison between SBEM and PHPP for 10 Dware AC (Total Floor Area: 5,261.67 m²).
Figure 101: Simulations 1–4 – Stacked bar chart comparing total annual energy use between SBEM and PHPP for 10 DWare AC (total floor area: 5,261.67 m²). Results are broken down into auxiliary, heating, cooling, lighting, and hot water energy components. Across all simulations (1-4), SBEM shows higher total energy use than PHPP, largely due to greater auxiliary energy total.
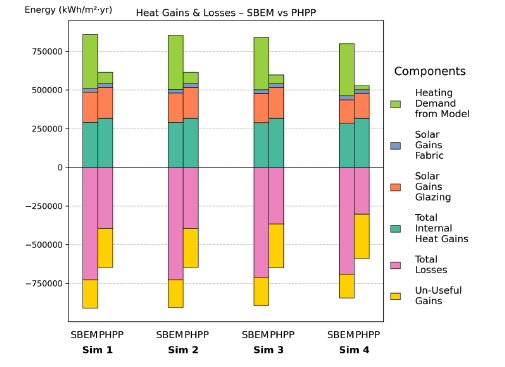
Figure 102: Energy Balance Comparison: PHPP vs SBEM – 10 Dware AC (Total Floor Area: 5,261.67 m²).
Figure 102: Simulations 1–4 – Energy balance comparison between SBEM and PHPP for 10 DWare AC (total floor area: 5,261.67 m²). The stacked bars show total internal heat gains, solar gains (glazing and fabric), total losses, un-useful gains, and heating demand from the model. Across all simulations, SBEM has slightly higher total gains and losses compared with the PHPP model, though the overall values are similar.
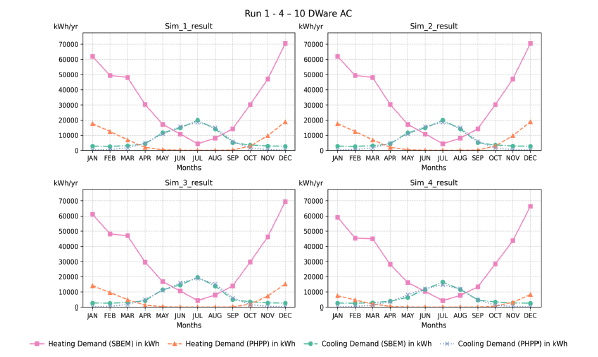
Figure 103: Monthly Heating & Cooling Demand for Simulations 1 - 4: 10 Dware AC (Total Floor Area: 5,261.67 m²).
Figure 103: Monthly heating and cooling demand for Simulations 1–4 – 10 DWare AC (total floor area: 5,261.67 m²). The graphs compare SBEM and PHPP results, showing seasonal patterns with higher heating demand in winter and higher cooling demand in summer. PHPP generally predicts lower heating demand and similar cooling demand compared to SBEM model.

E.11 DWare MV

Figure 104: Simulations 1- 4: Energy comparison between SBEM and PHPP for 11 Dware MV (Total Floor Area: 5,261.67 m²).
Figure 104: Simulations 1–4 – Stacked bar chart comparing total annual energy use between SBEM and PHPP for 11 DWare MV (total floor area: 5,261.67 m²). Results are broken down into auxiliary, heating, cooling, lighting, and hot water energy components. Across all simulations (1-4), SBEM shows higher total energy use than PHPP, largely due to greater heating energy demand.
Figure 105: Energy Balance Comparison: PHPP vs SBEM – 11 Dware MV (Total Floor Area: 5,261.67 m²).
Figure 105: Simulations 1–4 – Energy balance comparison between SBEM and PHPP for 11 DWare MV (total floor area: 5,261.67 m²). The stacked bars show total internal heat gains, solar gains (glazing and fabric), total losses, un-useful gains, and heating demand from the model. Across all simulations, SBEM has slightly higher total gains and losses compared with the PHPP model, though the overall values are similar.
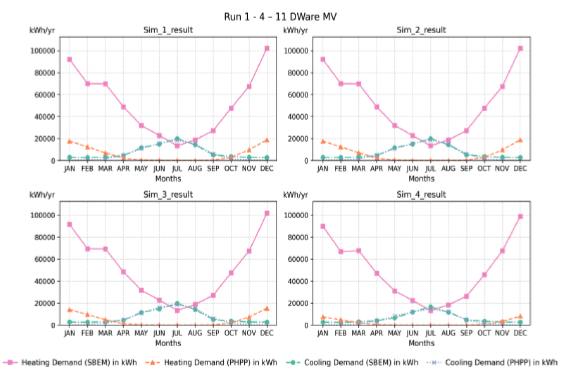
Figure 106: Monthly Heating & Cooling Demand for Simulations 1 - 4: 11 Dware MV (Total Floor Area: 5,261.67 m²).
Figure 106: Monthly heating and cooling demand for Simulations 1–4 – 11 DWare MV (total floor area: 5,261.67 m²). The graphs compare SBEM and PHPP results, showing seasonal patterns with higher heating demand in winter and higher cooling demand in summer. PHPP generally predicts lower cooling and heating demand profiles compared to SBEM.

Contact

Email: bsdenergystandardsreview@gov.scot

Back to top