
Building regulations 2025 - new non-domestic buildings: energy standard improvements - modelling report
Research output to identify and assess potential improvements in energy and emissions performance for non-domestic buildings constructed in Scotland set via Section 6 of the Scottish Building Standards (energy). This was to inform the setting of targets within the next set of energy standards.
Part of
Appendix A Step ii1: Review of Building Specifications using different Principal Heat Sources
Designers and developers are free to meet the energy performance standards of Section 6 in any way that they choose. The following analysis was undertaken to evaluate whether the choice of principal heat source effected other aspects of the building’s design; for example, if using a lower efficiency heat source, was this offset by using better performing building fabric.
This analysis was undertaken on the EPC database provided by the Scottish Government and therefore has been constrained by the availability of data. When drawing conclusions, the size of the dataset has been considered.
A.1 Prevalence of different Heat Sources
The EPC database shows the following distribution of heating fuel use for the 1,174 buildings. The distribution has been analysed both in terms of floor area (m²) and number of buildings served by each heating fuel source.
| Main heating fuel | Floor Area (m²) | Floor Area (%) | Number of Buildings | Number of Buildings (%) | Average building floor area (m²) |
|---|---|---|---|---|---|
| Natural Gas | 773,806 | 41.3% | 306 | 26.1% | 2,529 |
| District Heating | 96,662 | 5.2% | 39 | 3.3% | 2,479 |
| Grid Supplied Electricity - Heat pump | 663,294 | 35.4% | 542 | 46.2% | 1,224 |
| Grid Supplied Electricity - Direct electric | 158,597 | 8.5% | 170 | 14.5% | 933 |
| Grid Supplied Electricity - Other | 99,800 | 5.3% | 30 | 2.6% | 3,327 |
| LPG | 36,022 | 1.9% | 38 | 3.2% | 948 |
| Biomass | 32,320 | 1.7% | 16 | 1.4% | 2,020 |
| Oil | 4,068 | 0.2% | 17 | 1.4% | 239 |
| Waste Heat | 1,041 | 0.1% | 2 | 0.2% | 521 |
| Other | 6,625 | 0.4% | 14 | 1.2% | 473 |
| Total | 1,872,235 | 100% | 1,174 | 100% | 1,595 |
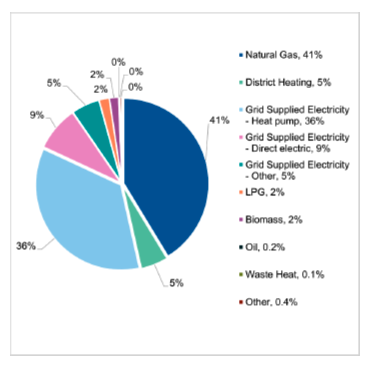
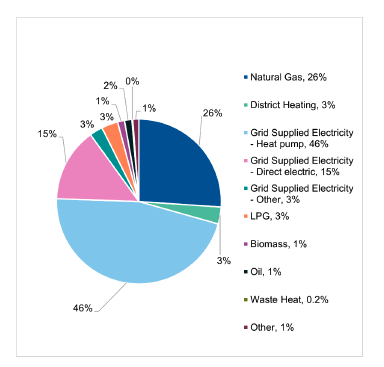
The analysis shows that natural gas and grid supplied electricity are the most common heating fuels, both in terms of building floor area and number of buildings served.
This analysis shows that generally for fuels that are less commonly used, LPG, oil, waste heat and other, the average floor area of the buildings served are smaller than the EPC database average. This is not the case for district heating and biomass which are less commonly used but typically serve buildings with a floor area greater than the EPC database average.
Considering the prevalence of direct electric, biofuel and district heating within the EPC database; both direct electric (8.5% of floor area and 3.3% of buildings) and district heating (5.2% of floor area and 14.5% of buildings) serve more than 5% of the total recorded building floor area. Therefore, there is deemed to be sufficient data to enable further detailed analysis of buildings served by direct electric and district heating, as described in the following sections.
Biofuel (biomass) serves less than 2% of the buildings, both in terms of floor area and number of buildings served. Therefore, it is deemed that there is insufficient data to allow for further analysis of the performance of buildings served by biofuels.
A.2 Building types by Heat Source
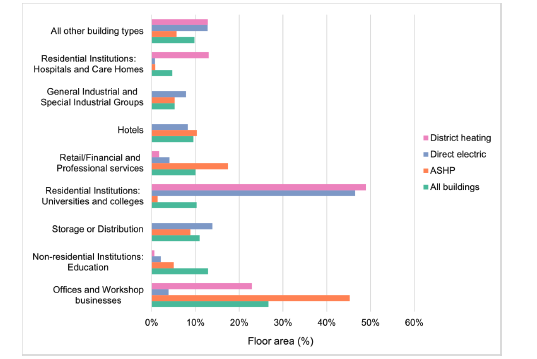
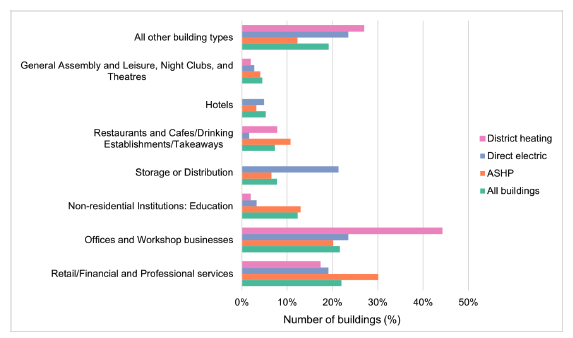
Further analysis of the types of building served by each heat source under consideration has been made, as illustrated in Figure 61. Building types making up less than 5% of the total floor area contained in the EPC database have been grouped together (“All other building types” on Figure 61-Figure 62), as these are deemed to be very minor contributors to the overall build mix.
The proportion of building types served by different heating fuels are broadly similar, with the following key differences noted:
- ASHPs are more frequently used in office and workshop businesses than in other building types.
- Direct electric and district heating are each more frequently used in university and college residential buildings (student accommodation) than in other building types.
A.3 Building fabric performance: U-values
The EPC database reports the building average U-value (W/m²K) which can allow for some overall insight into performance but does not allow for detailed analysis into elemental performance and cannot account for building form or glazing proportion.
Figure 63 illustrates the distribution of average U-value for all buildings in the EPC database, compared to the sub-sets of buildings served by direct electric and district heating. Table 114 shows the floor area weighted building average U-value across the total EPC database, those served by ASHP, direct electric and district heating.
| Result | All buildings (1,174 buildings) | ASHP (542 buildings) | Direct electric (170 buildings) | District heating (39 buildings) |
|---|---|---|---|---|
| Floor area weighted average | 0.401 | 0.439 | 0.404 | 0.427 |
| 90th percentile | 0.579 | 0.471 | 0.875 | 0.767 |
| 75th percentile | 0.348 | 0.345 | 0.390 | 0.409 |
| 50th percentile | 0.282 | 0.287 | 0.313 | 0.271 |
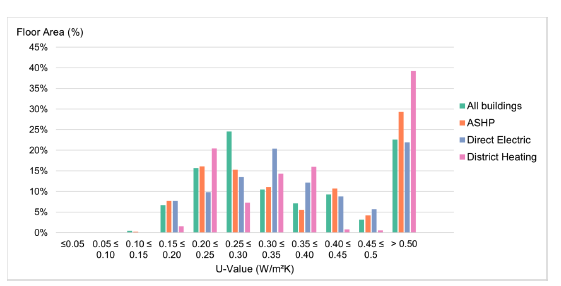
Compared to all buildings in the EPC database, those served by direct electric and district heating generally have a slightly poorer (higher) building average U-value. This relationship is slightly more pronounced for those buildings served by district heating.
Further analysis has been undertaken to understand whether the poorer average building U-value relates to poorer elemental U-values, or other factors.
Review of the building types served by district heating shows that approximately 25% of the building floor area heated by district heating are offices, retail buildings, and restaurants. This would be expected since district heating networks are prevalent in urban areas where heat demand density is high, and these building types are likely to be concentrated. These building types (offices, retail and restaurants) typically have a greater proportion of glazing, and it is this factor that is believed to contribute to the slightly higher average U-value for buildings heated by district heating compared to the EPC database average.
A.3.1 Conclusions regarding U-values
The data available from the EPC database does not support using a different fabric specification in the modelling of buildings using direct electric or district heating.
A.4 Building fabric performance: Infiltration
Figure 64 illustrates the distribution of infiltration rates for all buildings in the EPC database, compared to the sub-sets of buildings served by ASHP, direct electric and district heating. Table 115 shows the floor area weighted building average infiltration rates across the total EPC database and for those buildings served by ASHP, direct electric and district heating, alongside the 25th, 50th and 75th percentiles.
| Parameter | All buildings (1,174 buildings) | ASHP (542 buildings) | Direct electric (170 buildings) | District heating (39 buildings) |
|---|---|---|---|---|
| Floor area weighted average | 5.72 | 5.95 | 6.74 | 5.01 |
| 90th percentile | 15.00 | 10.28 | 25.00 | 9.99 |
| 75th percentile | 9.97 | 9.16 | 15.00 | 9.20 |
| 50th percentile | 6.06 | 5.50 | 7.27 | 7.00 |
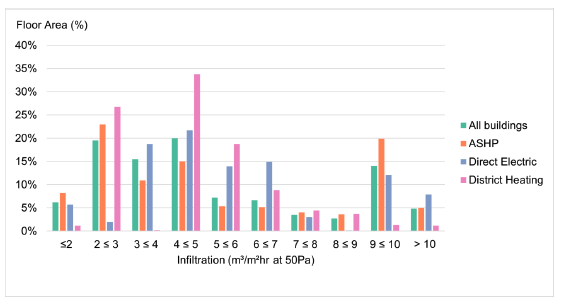
Compared to all buildings in the EPC database:
- Buildings served by direct electric and district heating generally have poorer (higher) air tightness results.
- Buildings served by ASHP generally have slightly better (lower) air tightness results.
The data does not suggest a clear reason for this pattern. As noted in Section A.2, the proportion of building types using the heating types considered are broadly similar, therefore building function is unlikely to have a meaningful impact on the achieved air permeability results.
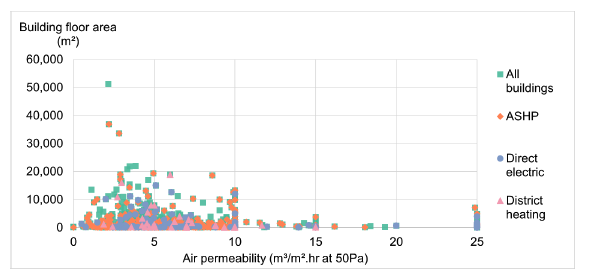
The following graph illustrates that there is not a strong correlation between building floor area and air permeability; however, it is noted that buildings that have poorer (higher) air permeability results, notably those worse than 10 m³/m².hr at 50Pa, tend to be smaller buildings. These buildings tend to have a slightly higher prevalence of direct electric heating.
There is some evidence to show that larger buildings (>20,000m²) generally achieve better (lower) air permeability results. There is not a distinct prevalence of buildings served by the heating types under consideration, therefore there are no clear conclusions that can be drawn here.
A.4.1 Conclusions regarding infiltration
Following review of the data available in the EPC database, this shows that buildings served by direct electric or district heating tend to have a poorer air permeability performance compared to buildings overall.
However, permitting buildings using certain servicing types to use a poorer air permeability does not align with intended policy direction, and therefore it is not proposed to use alternative air permeability values for buildings served by direct electric or district heating.
A.5 Building Services: Cooling
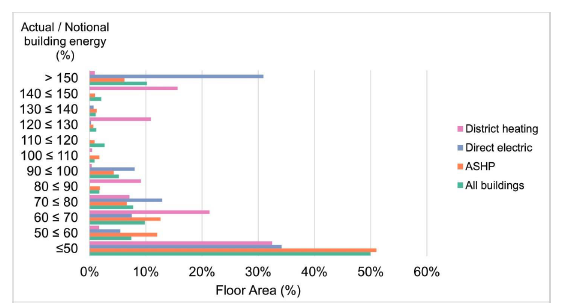
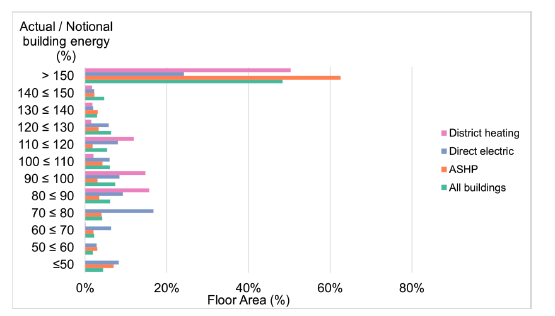
The EPC database has limited data available demonstrating building services’ performance; this analysis has predominantly been completed by dividing the actual energy consumption by the notional energy consumption; where the building achieves a ratio of less than 100% this means that the actual building has a lower energy demand than the notional building and vice-versa for ratios greater than 100%.
Unlike other building services, the EPC database does record the cooling SEERs and so these have also been analysed to provide further insight.
This analysis considered the energy performance of cooling in buildings in the EPC database, including buildings where air conditioning is not the predominant HVAC strategy, for example a cooled server room in an otherwise non-cooled building. One data point with a very high cooling energy performance ratio, owing to a very low notional building cooling energy, has been removed from this analysis as it was significantly skewing the results.
Buildings with direct electric and district heating are found to have better cooling energy performance ratios than the average for all buildings in the EPC database, although are generally slightly poorer than the average performance for buildings heated by ASHP.
| Result | All buildings (646 buildings) | ASHP (445 buildings) | Direct electric (43 buildings) | District heating (32 buildings) |
|---|---|---|---|---|
| Floor area weighted average | 92.45% | 62.4% | 88.1% | 87.4% |
In addition to analysing the ratio of cooling energy in the actual and notional buildings, further detailed analysis of the SEER of the cooling systems used is possible from the data in the EPC database.
| Result | All buildings (646 buildings) | ASHP (445 buildings) | Direct electric (43 buildings) | District heating (32 buildings) |
|---|---|---|---|---|
| 90th percentile | 7.40 | 7.40 | Not possible to calculate | 12.56 |
| 75th percentile | 6.60 | 6.70 | 7.31 | 5.58 |
| 50th percentile | 5.58 | 5.76 | 6.70 | 5.58 |
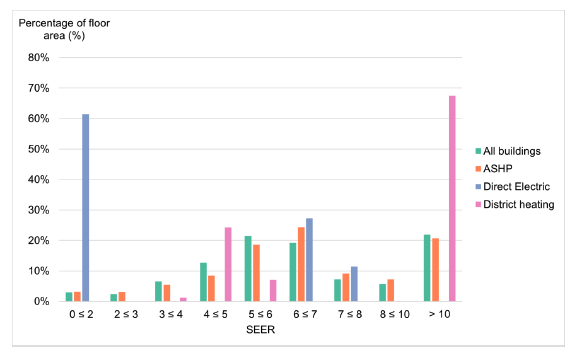
The cooling SEER data shows the following key features:
- The selected cooling SEER percentile values are similar for buildings using ASHP heating to all buildings in the EPC database.
- There are larger differences between the reported SEER percentile values for all buildings in the EPC database when compared to buildings heated via direct electric and district heating. However, due to the limited number of datapoints available for buildings using direct electric and district heating, confidence in these results is low.
| Category | Regulated energy (%) | Regulated and unregulated energy (%) |
|---|---|---|
| All buildings (646 buildings) | 2.33% | 1.65% |
| ASHP (445 buildings) | 4.71% | 2.88% |
| Direct electric (43 buildings) | 0.46% | 0.37% |
| District heating (32 buildings) | 6.78% | 4.40% |
Alongside considering the relative performance of the actual versus notional buildings, further analysis to understand the relative importance of cooling energy consumption within the overall energy mix, as shown in
Table 118, has shown that cooling is not a significant proportion.
A.5.1 Conclusions regarding cooling energy
Although the analysis demonstrates that there are differences between cooling SEERs applied in buildings served by direct electric and district heating, when compared to all buildings in the EPC database, it is not proposed to model different specifications for these buildings because:
- The conclusions are based on a very small number of data points.
- It would not align with policy direction to permit buildings using direct electric or district heating to use chillers (cooling) with poorer efficiencies.
Therefore, it is not proposed to use alternative cooling specifications for buildings using direct electric or district heating.
A.6 Building Services: Auxiliary energy
Compared to all buildings in the EPC database, buildings served by district heating and direct electric heating generally have better auxiliary energy performance (lower energy ratios).
| Results | All buildings (1,174 buildings) | ASHP (542 buildings) | Direct electric (170 buildings) | District heating (39 buildings) |
|---|---|---|---|---|
| Floor area weighted average | 167.61% | 191.4% | 115.1% | 145.3% |
| 90th percentile | 35.0% | 27.6% | 0.0% | 96.8% |
| 75th percentile | 78.0% | 75.0% | 56.4% | 108.3% |
| 50th percentile | 119.4% | 116.0% | 82.5% | 129.4% |
| Category | Regulated energy (%) | Regulated and unregulated energy (%) |
|---|---|---|
| All buildings (1,174 buildings) | 9.07% | 6.43% |
| ASHP (542 buildings) | 12.27% | 7.50% |
| Direct electric (170 buildings) | 3.18% | 2.61% |
| District heating (39 buildings) | 12.85% | 8.35% |
Alongside considering the relative performance of the actual versus notional buildings, further analysis to understand the relative importance of auxiliary energy consumption within the overall energy mix, as shown in Table 120, has shown that auxiliary energy is less important in buildings using direct electric heating, but slightly more important in buildings using ASHP and district heating.
A.6.1 Conclusions regarding auxiliary energy
Although the data suggests that buildings using direct electric heating generally have improved auxiliary energy performance compared to those using other heating types, it is also seen that auxiliary energy is much less significant in the overall energy performance for buildings heated via direct electric heating.
Improving the auxiliary energy performance of the building could be achieved by:
- Reducing pumping energy through the adoption of variable speed controls.
- Reducing ventilation energy by:
- Improving ventilation specific fan powers (W/l/s), and/or
- Implementing demand control ventilation.
In the case of pumping energy, the proposed modelling specification includes “variable speed pumping with multiple pressure sensors in the system” which is the most energy efficient option available within the Section 6 modelling methodology and therefore cannot be improved upon.
The proposed specification already includes demand control ventilation in the form of variable fan speed control based on CO2 sensors. This could be improved by implementing speed control based on occupancy density; however, this is an unusual strategy and experience suggests that this is not often implemented.
The proposed modelling specification includes a specific fan power of 1.8W/l/s for central (AHU) ventilation and 0.3W/l/s for terminal units. Whilst it may be possible to improve upon these in some scenarios, for example smaller buildings where ventilation ductwork runs are shorter or buildings using many zonal units, it is not universally achievable. SFPs achieved by fans are also limited by the available technology, and marked improvements are not anticipated. Therefore, it is concluded that buildings using direct electric and district heating will use the same specification as proposed for all buildings.
A.7 Building Services: Domestic hot water
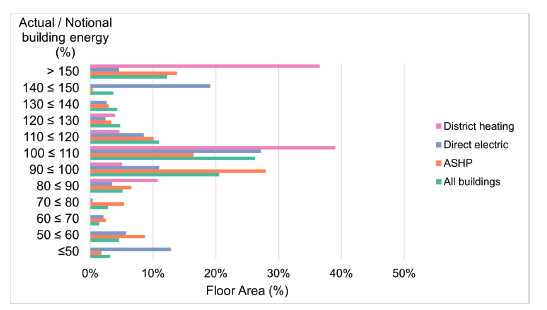
Compared to all buildings in the EPC database, buildings served by direct electric heating have a slightly better energy performance, whilst those using district heating have slightly poorer energy performance.
It is anticipated, although there is no data available to prove this, that buildings using direct electric heating would likely use direct electric DHW. It is likely that this would be point of use (POU) and therefore would have small storage volumes with little to no secondary circulation. It is hypothesised that it is this that improves the energy performance of these systems. By comparison, buildings using district heating would most likely use a centralised DHW system with storage and circulation. This results in poorer overall DHW energy performance compared to the notional.
| Result | All buildings (1,174 buildings) | ASHP (542 buildings) | Direct electric (170 buildings) | District heating (39 buildings) |
|---|---|---|---|---|
| Floor area weighted average | 111.9% | 105.4% | 106.2% | 125.7% |
| 90th percentile | 72.2% | 56.9% | 76.9% | 92.6% |
| 75th percentile | 95.0% | 86.4% | 95.0% | 100.0% |
| 50th percentile | 101.0% | 98.1% | 103.3% | 105.3% |
A.7.1 Conclusions regarding DHW
As it is hypothesised that the differences between the DHW energy performance of building using direct electric and district heating result from constraints associated with the system, it is not proposed to use different inputs to model DHW in buildings with direct electric or district heating.
A.8 Building Services: Lighting
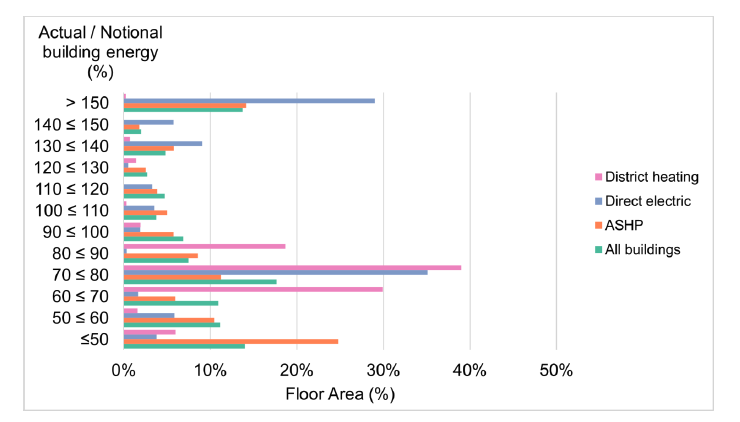
All buildings in the EPC database, regardless of heat source, are shown to have a similar 90th percentile lighting energy performance ratio, where the lighting energy in the actual building is approximately 55% of that in the notional building. This suggests that lighting energy performance is limited by the availability of higher efficacy luminaires.
| Result | All buildings (1,174 buildings) | ASHP (542 buildings) | Direct electric (170 buildings) | District heating (39 buildings) |
|---|---|---|---|---|
| Floor area weighted average | 99.4% | 96.2% | 133.7% | 75.5% |
| 90th percentile | 53.4% | 52.3% | 57.9% | 54.4% |
| 75th percentile | 66.1% | 65.8% | 79.6% | 59.1% |
| 50th percentile | 88.4% | 87.5% | 142.1% | 70.1% |
| Category | Regulated energy (%) | Regulated and unregulated energy (%) |
|---|---|---|
| All buildings (1,174 buildings) | 15.92% | 11.29% |
| ASHP (542 buildings) | 24.42% | 14.93% |
| Direct electric (170 buildings) | 11.89% | 9.77% |
| District heating (39 buildings) | 16.41% | 10.66% |
A.8.1 Conclusions regarding lighting
The data available in the EPC database suggests that buildings using direct electric heating would typically use poorer performing lighting than buildings on average. However, it is not a desirable policy direction to permit buildings using less efficient heat sources (direct electric) to also use less efficient lighting, therefore it is proposed to use the same modelling specification for buildings using direct electric heating.
In the case of district heating, the 90th percentile value is similar to all buildings across the EPC database, suggesting that the maximum lighting performance is limited by external factor(s); however, buildings with district heating typically tend to have slightly better lighting performance as demonstrated by the lower ratios reported for the 75th and 50th percentiles.
Although the data suggests that buildings with district heating may typically use more efficient lighting, the sample size (39 buildings) is very small. Therefore, it is concluded that all buildings will use the same lighting inputs.
A.9 Conclusion
The EPC database has been reviewed to understand whether the choice of heating source affects other aspects of the building’s design.
Owing to the limited number of buildings in the EPC database, it was not possible to undertake analysis of buildings using biomass (biofuel) heating. However, trends for buildings using ASHP, direct electric and district heating were analysed as a larger number of datapoints were available.
Although the database showed some differences in the adopted specifications used for buildings with different heating sources, most notably in lighting performance, the trends identified were not very strong and were based on a limited number of datapoints. Therefore, it was concluded that all buildings within subsequent analyses would use the same modelling specification.