Small Business Bonus Scheme: evaluation
This report presents the results of an evaluation of the Small Business Bonus Scheme (SBBS), and provides recommendations in relation to the SBBS and non-domestic rates relief more broadly.
6. Analysing survey responses
The survey (included in Appendix A) contains three sections: the first section asked questions on business details (that we already discussed in Section 5); the second section sought responses on business outcomes (turnover and employment) and business operations; and the third section asked explicit questions on perceptions and beliefs about the SBBS. In this section we undertake an analysis of the business outcomes, operations and the perceptions of respondents on SBBS.
6.1 Business outcome questions
As outlined in our description of its design, several questions were included in the survey that would allow us to analyse differences in outcomes, on average, across different types of business. For example, we were interested in whether or not low-RV businesses (defined relative to SBBS thresholds) have higher/lower turnover or more/less employees than high-RV businesses. This served two overall purposes: to first of all understand the different characteristics of businesses across the RV distribution (since it determines SBBS eligibility), and second to perhaps examine whether any of these differences might be attributable to differences in associated SBBS relief.
Given the limitations outlined so far – small sample size, limited information on RV, mis-categorisation of businesses – it is difficult to make these comparisons robustly. To highlight why, in this section we first make some simple comparisons of basic outcomes across business category and RV. This allows us to try to understand how businesses might differ in these outcomes across two important dimensions, whilst also making transparent their shortcomings. We then move on to evaluate responses on wider business activity with these shortcomings in mind. The responses to the questions in this section should be unaffected by key dates since they focus on historical as opposed to present business activity.[33]
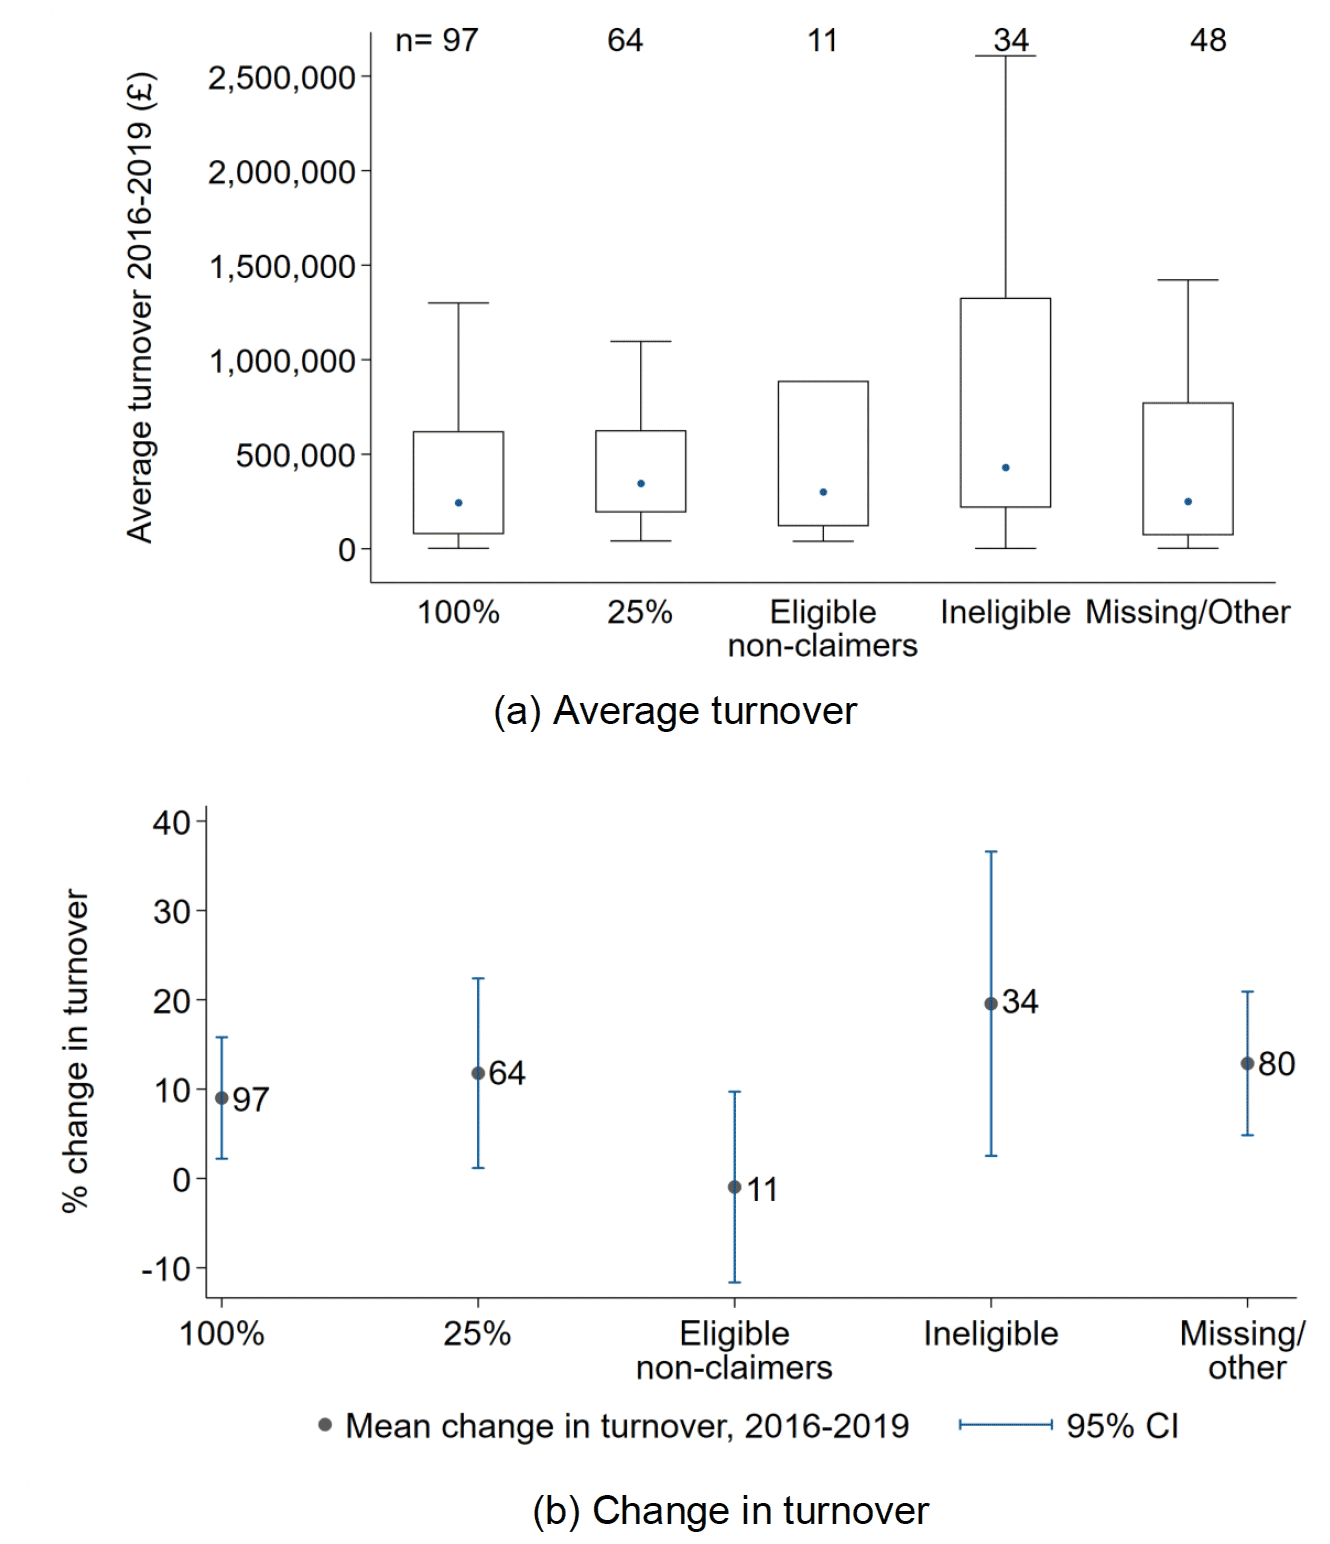
Here, we first compare the turnover and employment information reported in order to assess – to the extent it is possible – how businesses differ on average across claim status or RV. Doing so can help us understand the extent to which RV acts as an appropriate means by which to categorise businesses as similar; by using RV as the primary criterion to determine eligibility for NDR relief, the SBBS implicitly assumes that this is the case. Figure 6.1 shows the distribution of reported turnover from 2016-2019 (panel (a)), and the average change in turnover over the same period (panel (b)) across business categories, derived from the survey responses. These graphs show, by proxy of turnover, how different businesses within the sample might be.
Panel (a) shows that when categorised by their relief level, the respondents vary a great deal in terms of business size (using turnover as a proxy): whilst median turnover (represented by the dot) is broadly similar across categories, it varies a great deal within each category (the box represents the interquartile range, and the whiskers represent the range (excluding outliers), within each category). Panel (b) in the figure highlights a similar pattern in average changes in turnover from 2016-2019. The red bars in panel (b) of Figure 4.5 show the 95% confidence intervals (CI) of the means of groups – roughly speaking the degree of variability in the average changes in turnover.
One crude way to infer whether changes in turnover – or any other outcome – in different groups are statistically different is to examine the extent to which these confidence intervals (1) overlap; and (2) contain averages of others. Doing so allows us to infer whether, based on the variability within groups, their average outcomes systematically differ. In this case, although the average change does vary across groups (black dots), it is not possible to infer that the groups differ statistically.
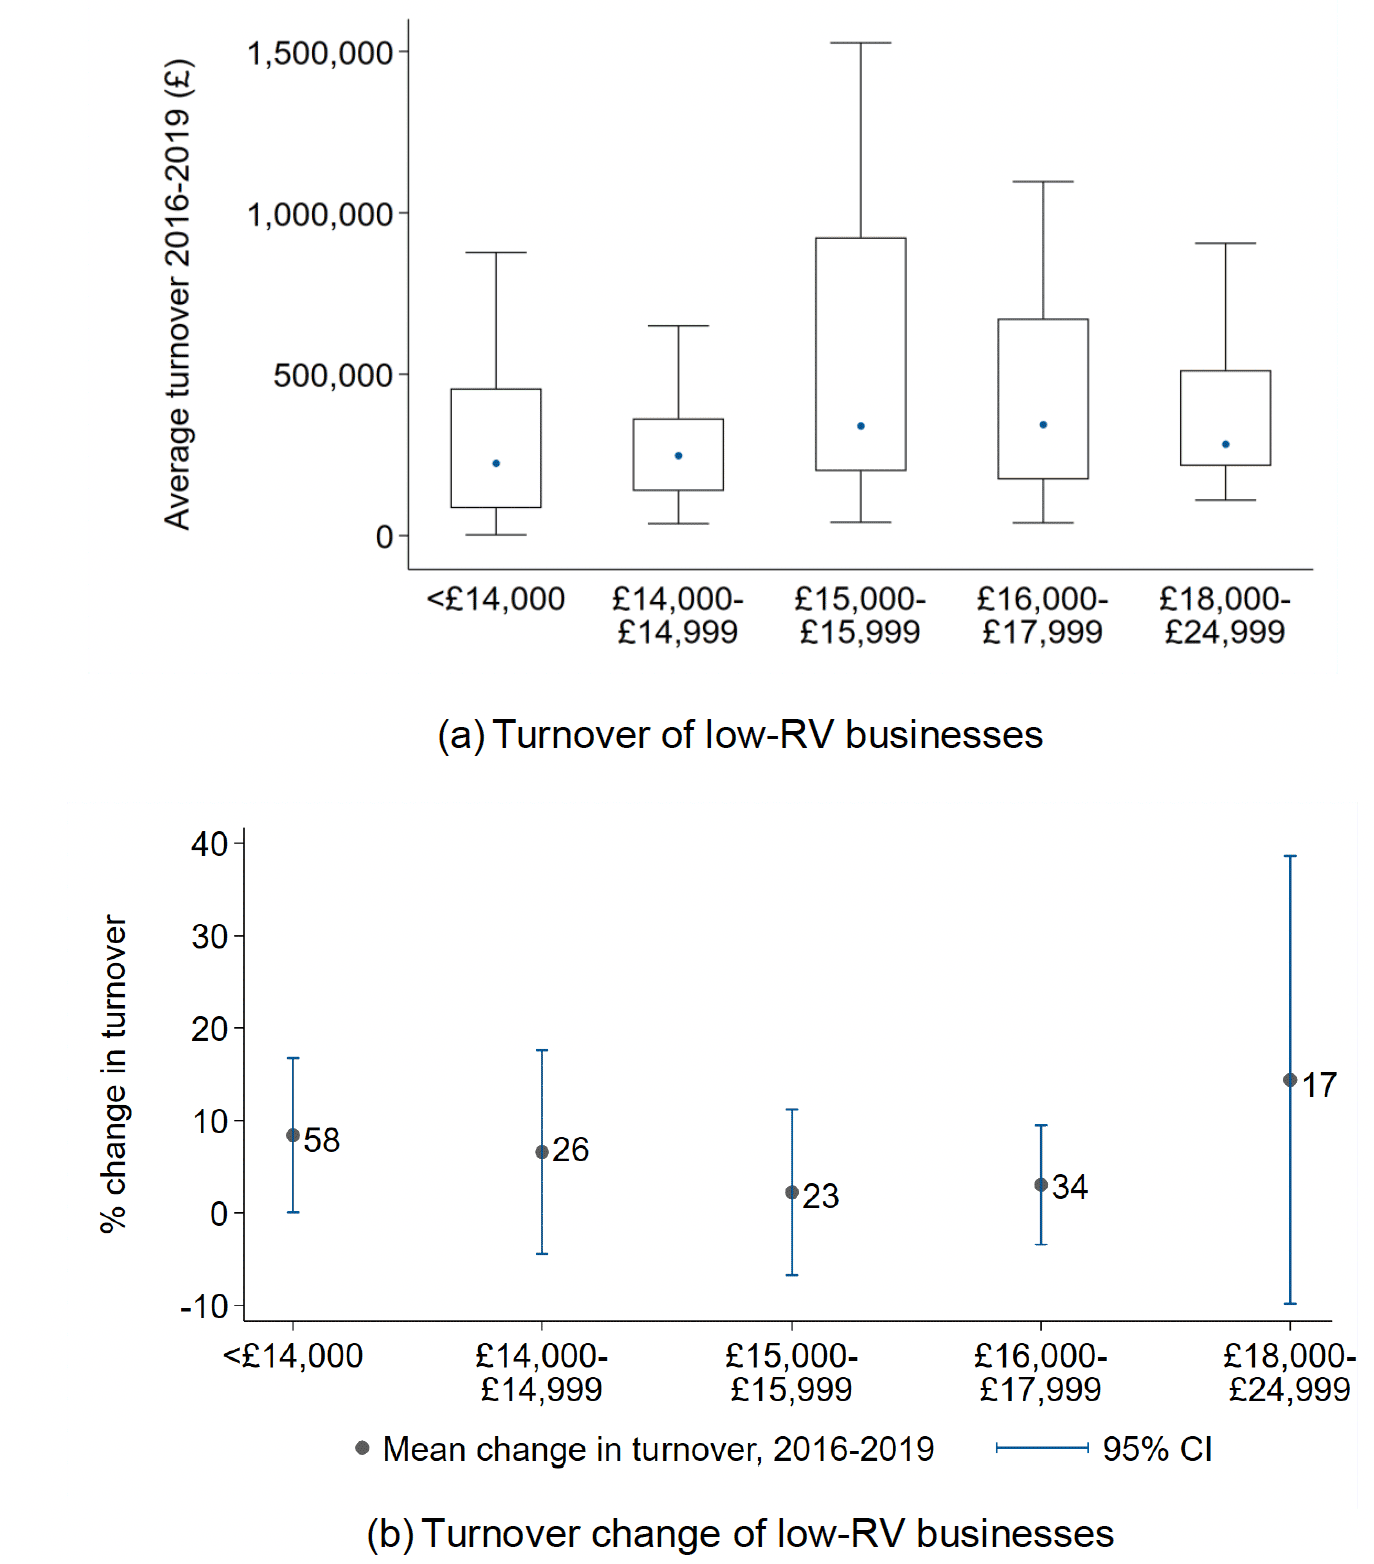
The conclusions are broadly similar when comparing across RV, particularly for high-RV businesses. Panels (a) and (b) of Appendix Figure C.1 show that the level and variability of both turnover and its recent growth is large for businesses at the upper end of the RV distribution. Focusing on lower-RV businesses, Figure 6.2 below shows that while these businesses are more similar in terms of their median turnover and average growth, again there is substantial variability within RV groupings.
In particular, there is very little difference in median reported turnover around the 100% SBBS threshold. Median turnover is almost identical for those with an RV between £14,000 and £14,999 and for those with an RV between £15,000 and £15,999. There is, however, much less variation in turnover for those valued between £14,000 and £14,999 than for those valued between £15,000 and £15,999. Panel (b) shows that although recent growth was slightly higher among the former group, it was not statistically different from that of those just above the threshold.
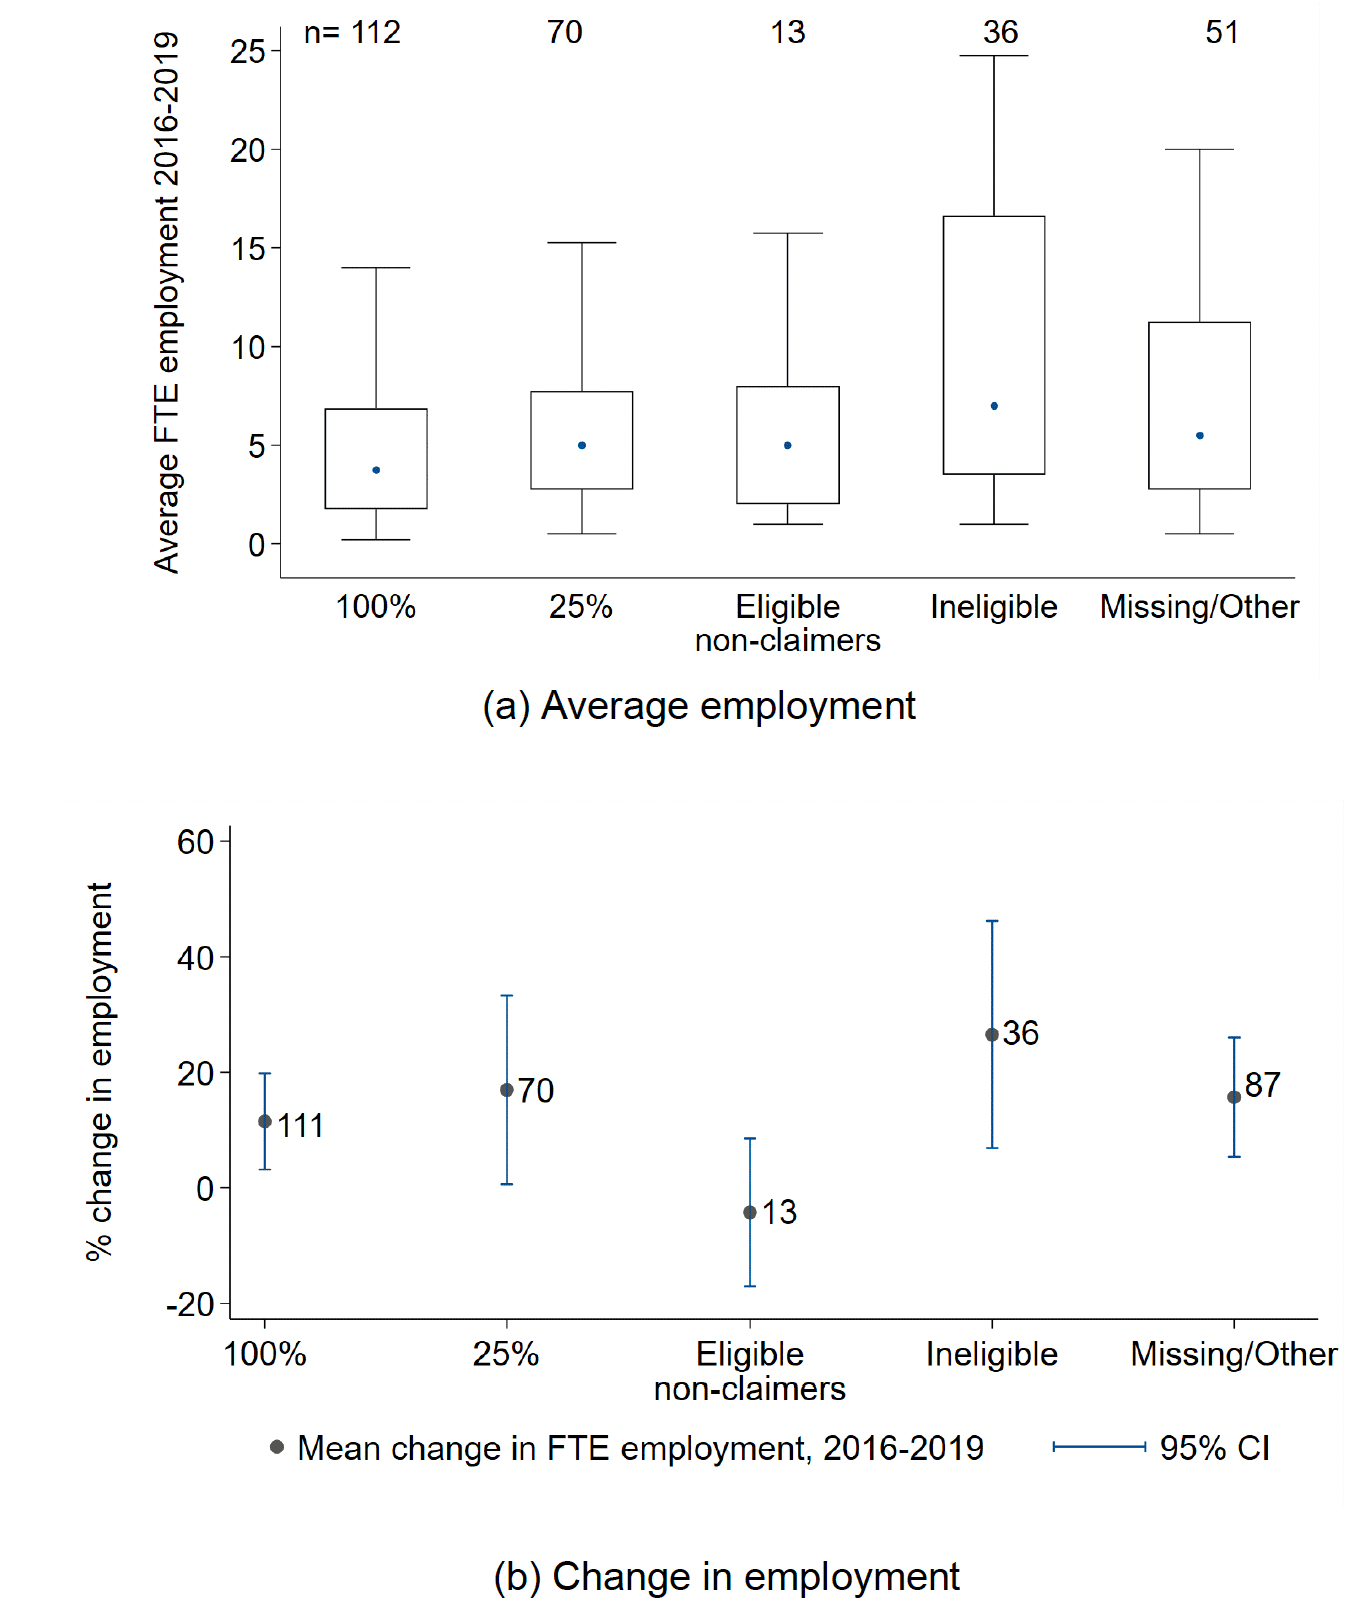
Perhaps unsurprisingly, patterns in employment across business categories and RV follow those in turnover. Panel (a) of Figure 6.3 shows that median FTE employment is similar across SBBS categories, but that, again, there is variability within these groups. Panel (b) also highlights the variability in employment changes, and that those who report to be eligible non-claimers actually reduced employment on average over the past three years.
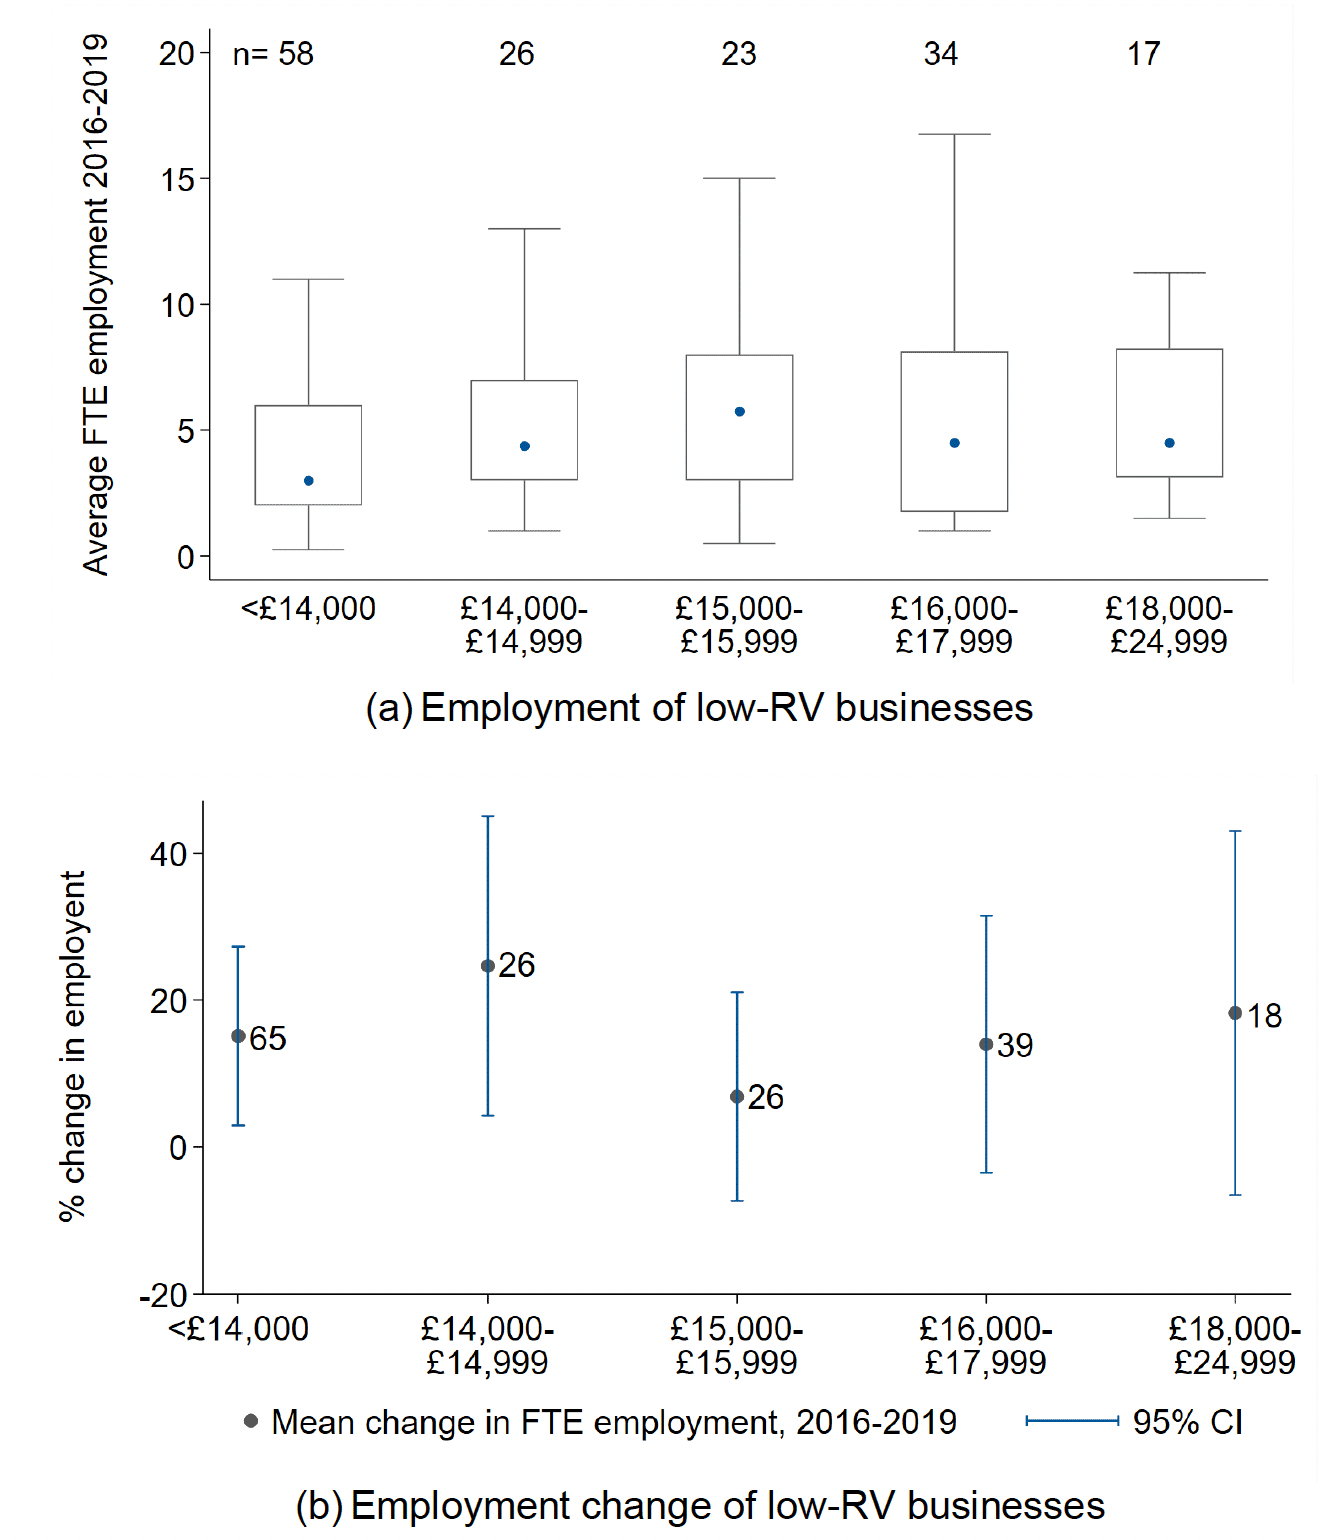
In Appendix Figure C.2, businesses that report to have the highest RVs again also report to have more employees on average, and vary the most in terms of their answer to this question (Panel (a)). Similarly, their recent employment growth was much higher (Panel (b)). Again, focusing on low-RV businesses in Figure 6.4, median employment is similar across RV groups, but they are reasonably varied. Panel (b) shows that recent employment growth is also similar across these groups.
Comparing simple differences in turnover and employment in the way we have here highlights that businesses vary a great deal within both the reported claim status and the RV groupings, and that differences between the groupings we consider are not large. Both of these facts suggest that respondents differ at least as much within claim status categories/RV groups as they do between them. Our analysis of the survey responses therefore does not provide any evidence that SBBS relief promotes favorable business outcomes in terms of turnover or employment, nor does it provide any evidence that the reverse might be true.
The difficulties in making such comparisons when businesses are so varied and sample sizes are small should be noted, however. These two features of the sample make it difficult to make reliable comparisons of performance or outcomes. If the response rates to the survey and questions themselves were higher, it might have been possible to disaggregate businesses even more in order to make like-for-like comparisons and limit the extent to which businesses vary within groups. The small sample size limits the extent to which comparisons are informative.
Our deductions here also suggest that RV might be a poor metric with which to class businesses as "small", and so define eligibility for the SBBS. If turnover and employment constitute good proxies for business size, and business size is related to business need for support, then basing eligibility for support on RV alone should be brought into question.
The last question in this portion of the survey enquired about recent outcomes, asking respondents about their current business position – whether they were growing, stable or contracting. About 66% of businesses reported being stable or growing, however there were some slight differences across business categories. Roughly 74% and 72% of those in receipt of 100% and 25% SBBS relief reported being stable or growing respectively, compared with 69% of those who were ineligible and 56% of those who did not report a relief level or recorded "other" as a response. Thus, those businesses in receipt of SBBS relief were slightly more likely to report being stable or growing, although the differences (particularly compared to those that are ineligible) are very small. As such, any conclusion that the SBBS supports growth should be tentative, particularly given our sample size. In terms of RV, low-RV businesses were more likely to report being stable or growing, although those just below the 100% threshold were less likely to report this.
Note: For comparison, Appendix Figures B.1-B.3 show charts analogous to these (as well as those in Figure 6.4 below), but using RV from the VR (which should be interpreted in light of our discussion of this in Section 5). They show that grouping businesses in this way results in more varied turnover and employment within groups for businesses just below the 100% threshold and those valued from £18,000-£24,000.
Unsurprisingly there were some slight differences in this response across key dates. For example, responses that were received before the UK Budget were more likely to report stability or recent growth (77%) than those that came after (61%). However, they were equally likely to report they were contracting moderately or rapidly (22%). This is, in part, a result of the high non-response rate to this question among those who returned the survey after the budget. This could be a result of businesses not recording an answer for this question due to the exceptional circumstances – we in fact had several responses that noted as much next to this question.
Larger differences in responses begin to emerge at later key dates. For example, only 18% of those who responded before the Prime Minister's lockdown announcement reported to be contracting moderately or rapidly, compared with 29% of those who responded at some point between the announcement and September 2020 (when we regained access to the university campus to retrieve the survey responses).
The largest differences are in fact among those responses that we did not receive until we regained university access – only 18% of these respondents reported to be growing, whereas 34% reported to be contracting. Given that the majority of our sample is in accommodation and food services and/or retail, this is unsurprising in light of events: this batch of surveys was returned when these sectors were completely shut down due to national Covid-19 restrictions.[34]
6.2 Business operations questions
Questions 8-14 of the survey asked various questions about businesses' costs and expenditures. For example, these questions asked how recent expenditures had changed (question 8), the impact of potential cost changes on their spending (questions 11 and 12), and how important they deemed certain types of government spending to their business (question 13). Given that we know very little about the actual businesses operating in properties, these questions were included to ascertain whether perceptions of government spending or the impacts of cost changes vary across the RV distribution, and ultimately levels of SBBS relief.
Again, as we outline in Section 5.7.2, where we make comparisons across RV and claim status, we rely on reported information. This means that responses from those who did not record answers to the questions on RV and claim status are not used in our analysis. Rather than discard them completely, we group these responses into one "missing" category.
6.2.1 Real Living Wage
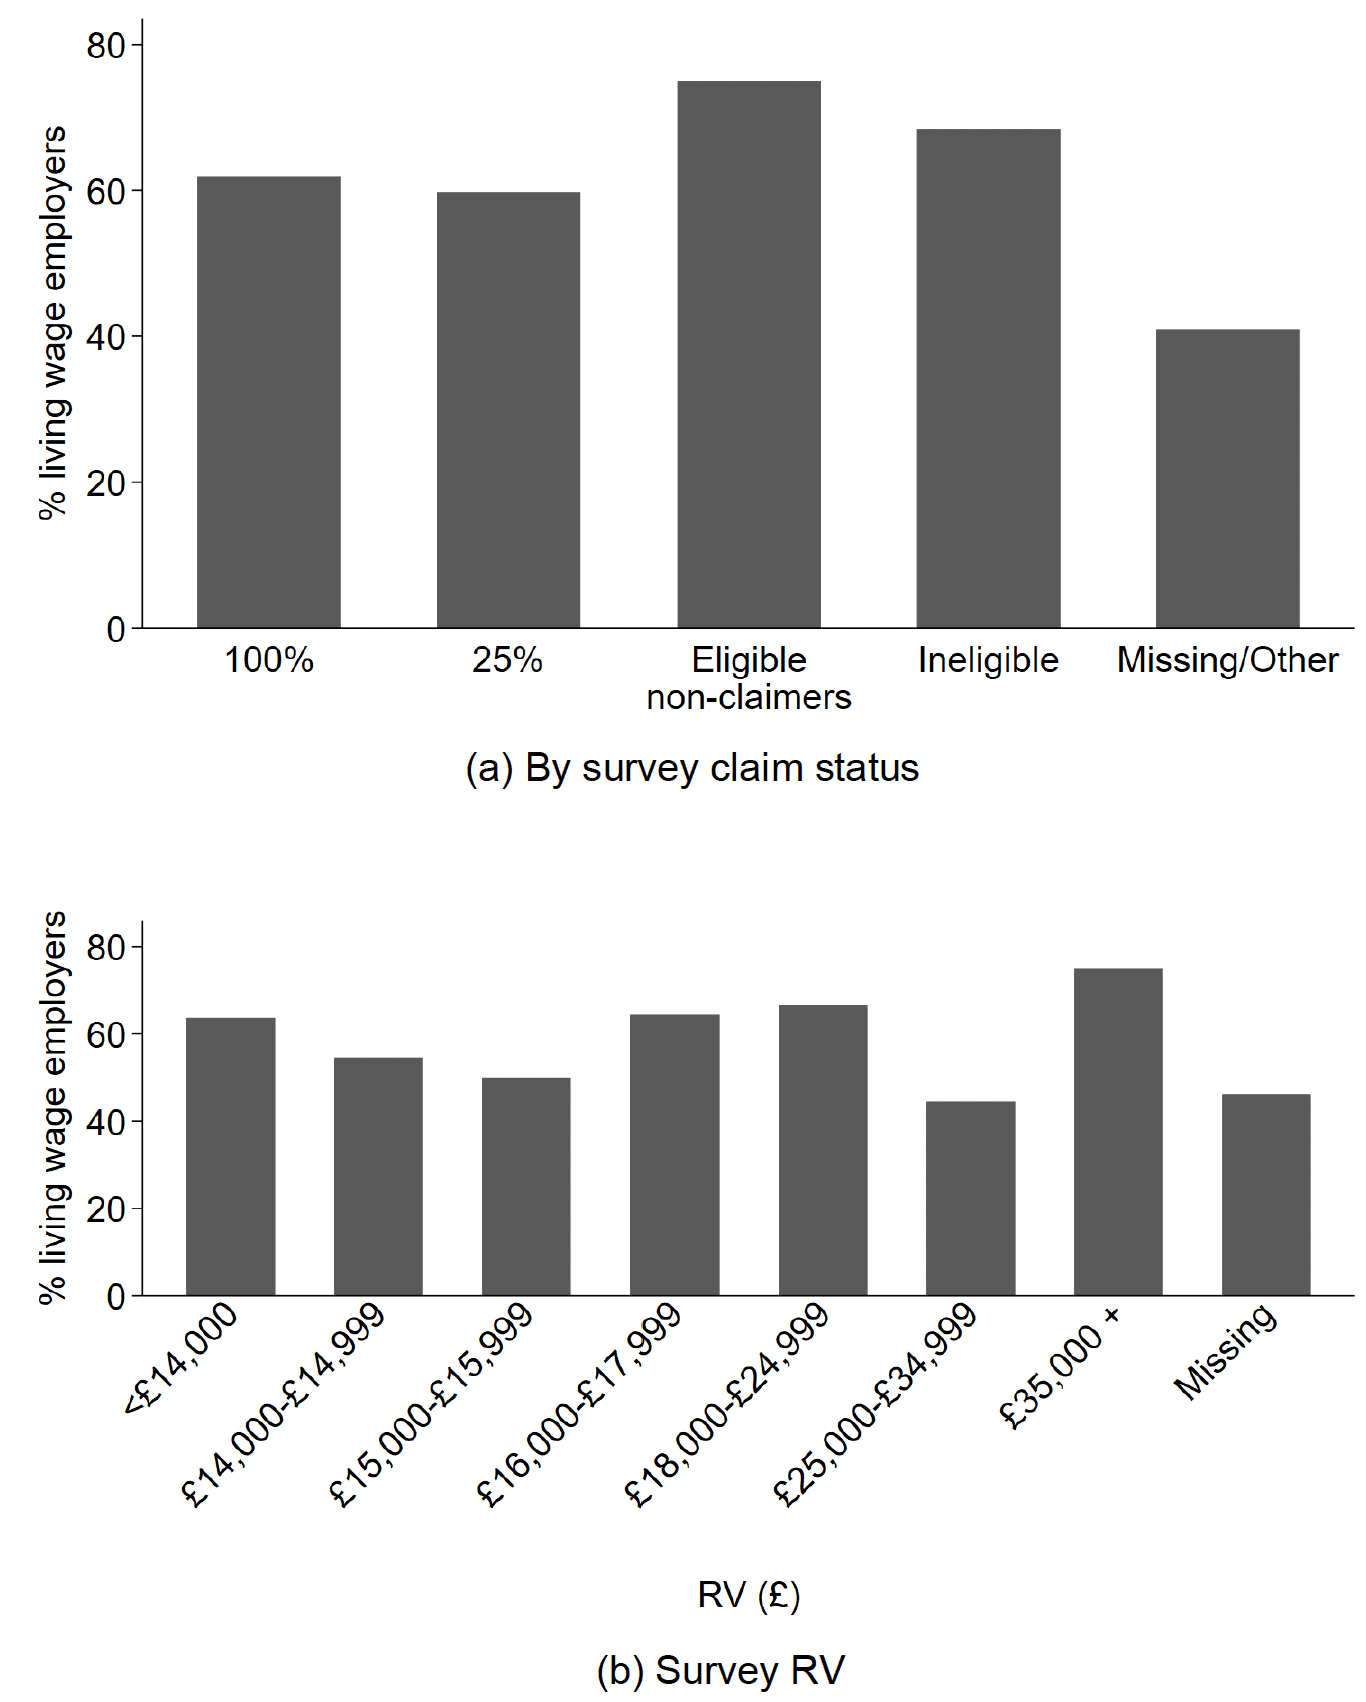
Overall, roughly 54% of respondents said that they paid all of their staff aged over 25 the Real Living Wage (question 9). About 25% reported that they did not, and about 20% did not answer the question. The proportion who recorded a positive answer for this question was broadly similar across claim status, although slightly higher among those who received 100% relief compared to those who received 25% relief (Figure 6.5 Panel (a)). A lower proportion of recipients of SBBS relief reported to pay the Real Living Wage than those businesses that are ineligible, however.
There were also slight differences across RV – those just below the 100% SBBS threshold were more likely, on average, to report that they were real living wage employers than those just above (panel (b)), as were respondents with an RV of less than £14,000. The proportion of respondents who report to be real living wage employers in both of these groups is lower than those with an RV between £16,000 and £24,000 or above £35,000, however. This could perhaps be a result of larger businesses having the means to pay the Real Living Wage. There is therefore some, but rather weak, evidence to suggest that the SBBS may support businesses to pay the Real Living Wage.
6.2.2 Business costs and investment
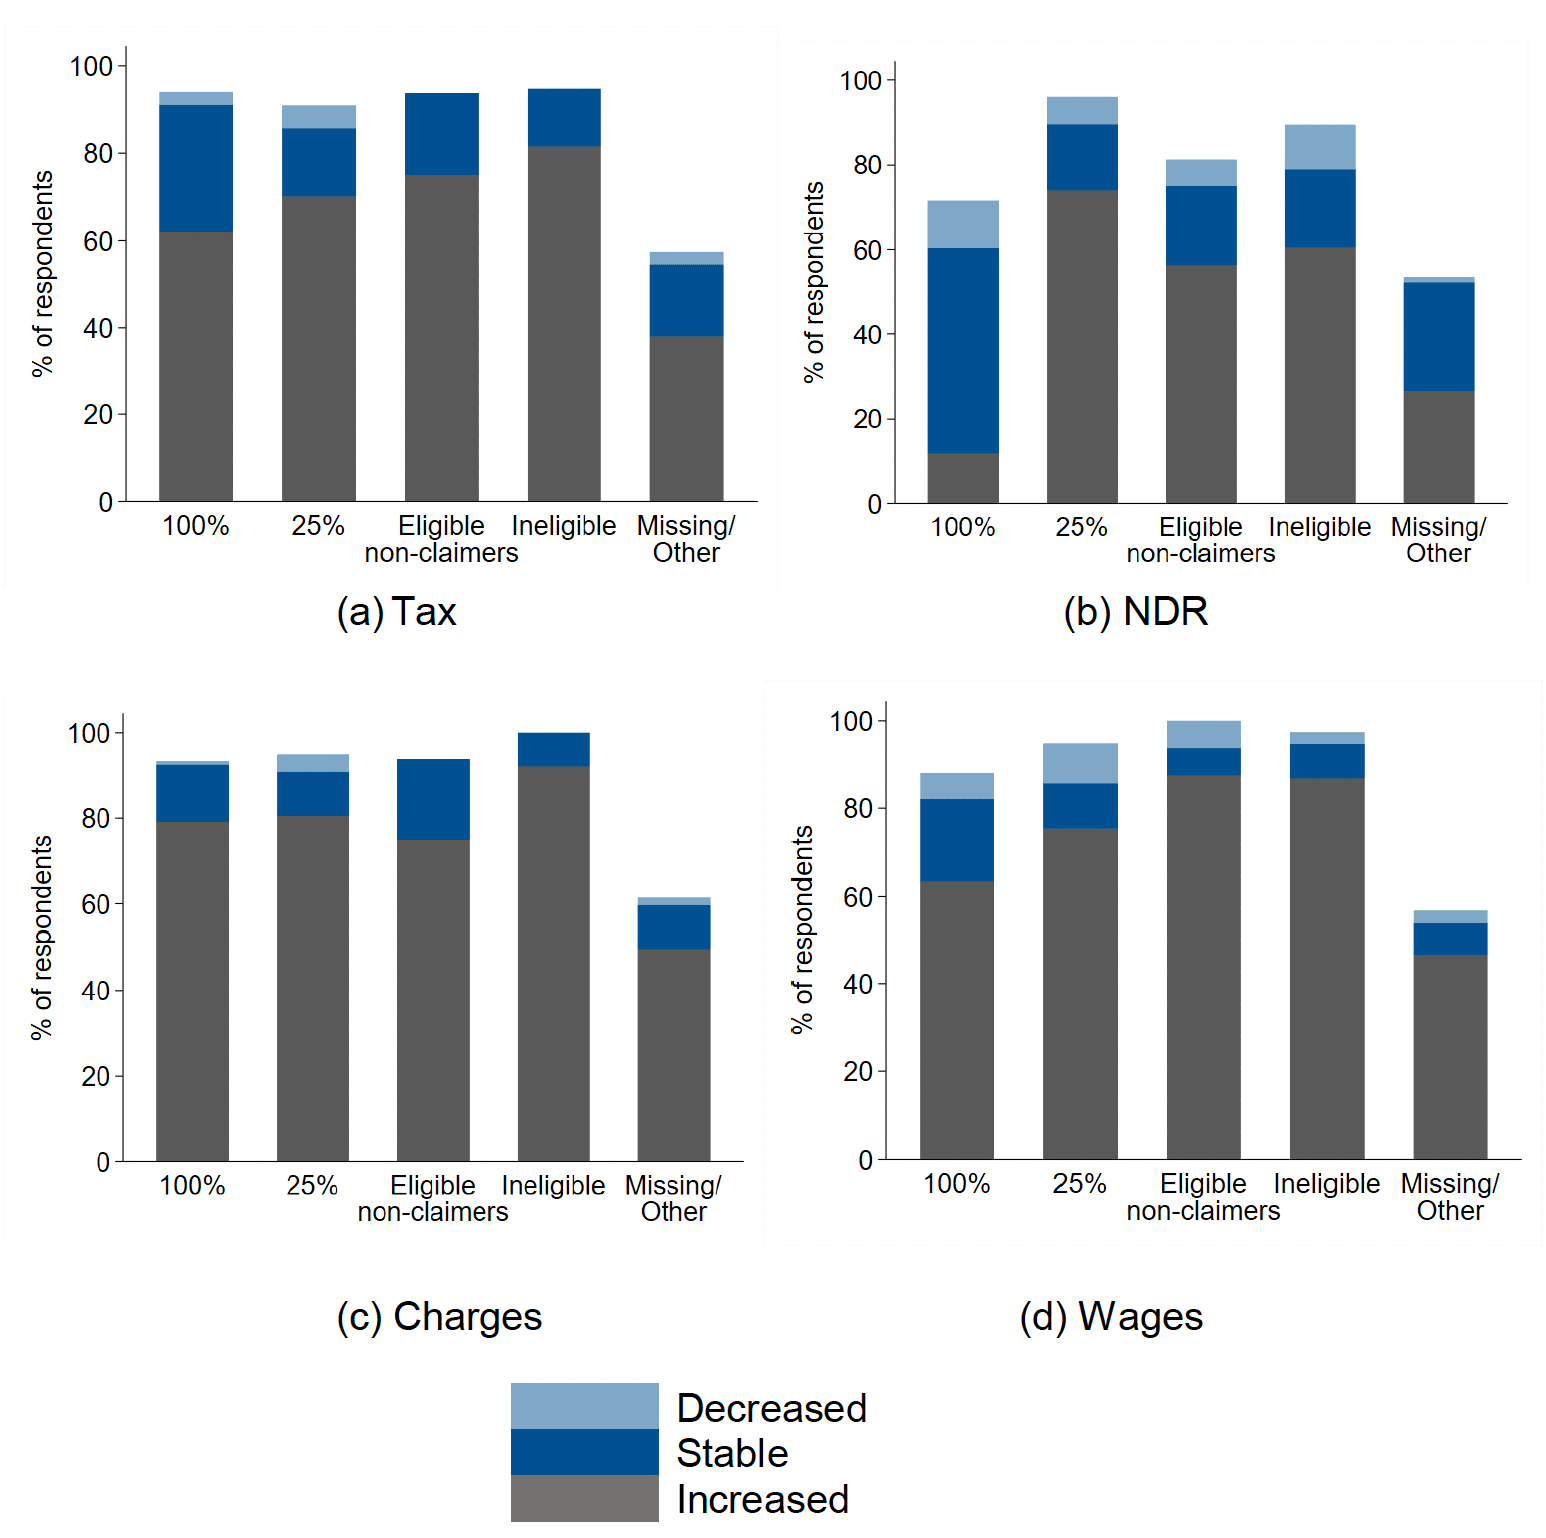
Respondents were asked (in question 8) how their expenditure on ten business costs had changed between 2017 and 2019 – wages, training, investment in equipment, R&D, business charges such as water and waste collection, advertising, capital expenditure, NDR, rent and taxes. There were three possible responses: they had increased, been stable or decreased.
For all of these expenditures, by far the most common answer was that expenditures had increased or remained stable. Wages, business charges, NDR and taxes were most commonly reported to have increased over the period. This was true whether disaggregating answers by RV or business category – Figure 6.6 shows the percent of each category reporting each answer for these four business costs across business categories. The one stand-out difference is that those in receipt of 100% relief were far more likely to respond that their NDR bill had been stable than all others (as we would expect).
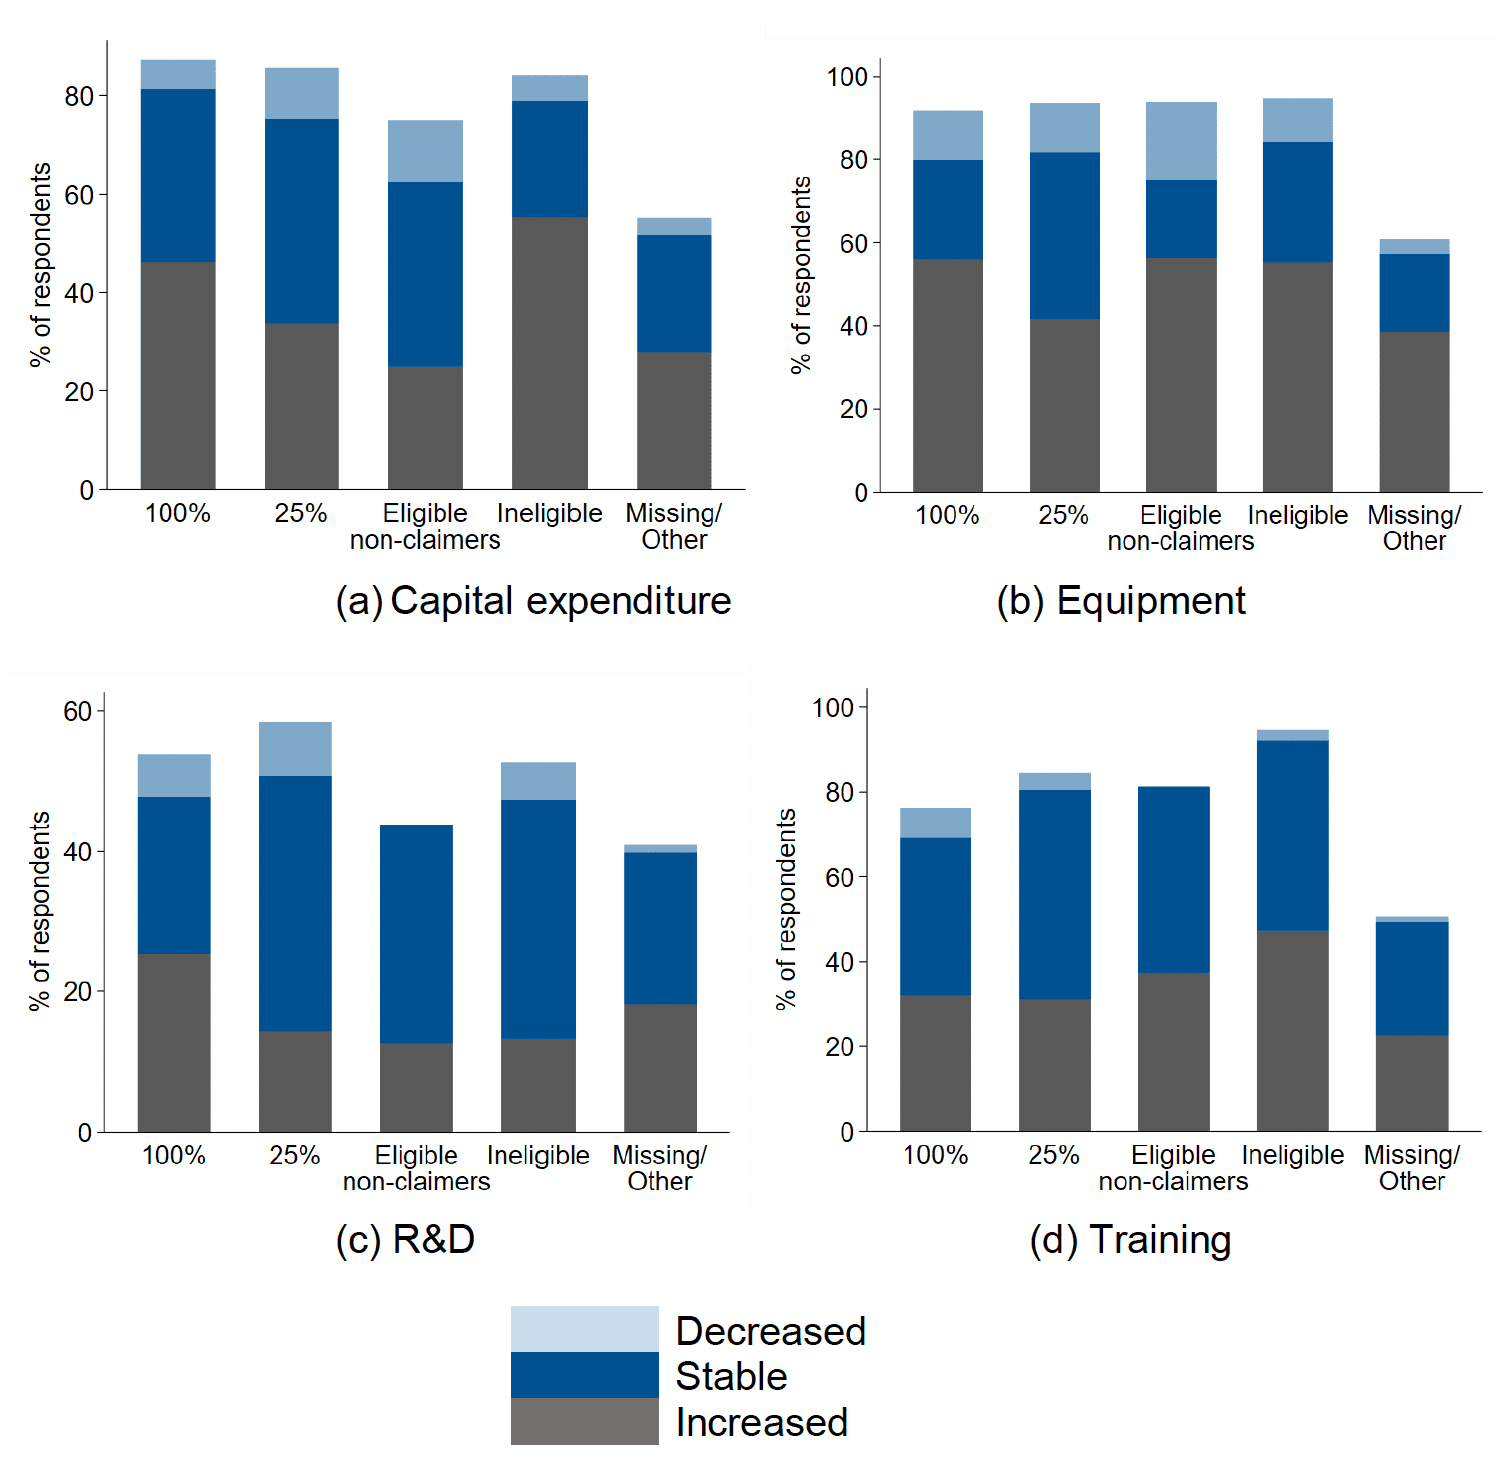
Figure 6.7 below focuses on investment expenditures and considers how they have changed across SBBS claim status. There is no clear pattern across the sub-figures to suggest that the SBBS is supporting investment by businesses. A slightly higher proportion of businesses that receive 100% support do report to have increased their capital expenditure (on property), equipment expenditure and R&D expenditure than those with 25% support, but the same is not true of training expenditure. Moreover, the same or a higher proportion of ineligible businesses claim to have increased their expenditure compared with those in receipt of 25% relief in all but one category (R&D). With the caveats surrounding self-reporting and our small sample size considered, this presents some weak evidence that the SBBS supports investment but the differences are small.
Three questions then sought to ascertain the extent to which these business costs were important in determining operations. The first of these (question
10) simply asked how important nine costs were: rent, stock, wages, equipment, utilities, transport, NDR, VAT or other taxes. There were three possible answers: very important, important or unimportant. The idea behind this question was to gain an understanding of the importance of NDR relative to other business costs.
Only transport costs were reported to be generally unimportant, with all other costs most commonly ranked as very important or important to operations. The most frequently reported response to these questions is that costs are very important (as opposed to important, or unimportant), particularly for wages, equipment, utilities and NDR. The same is true whether looking at responses to this question across category or RV – businesses appear to view the same costs as important to their operation.
Note: Bars are shares of respondents in each business category. They do not add to 100% due to non-responses.
Focusing particularly on the importance of NDR costs, Figure 6.8 disaggregates the responses to this question by business category and RV. Panel (a) shows that those who received 25% relief were slightly more likely to rank the cost as important/very important compared to those who receive 100% relief. This is echoed in panel (b), where a higher proportion of those just above the threshold report NDR costs to be important/very important.
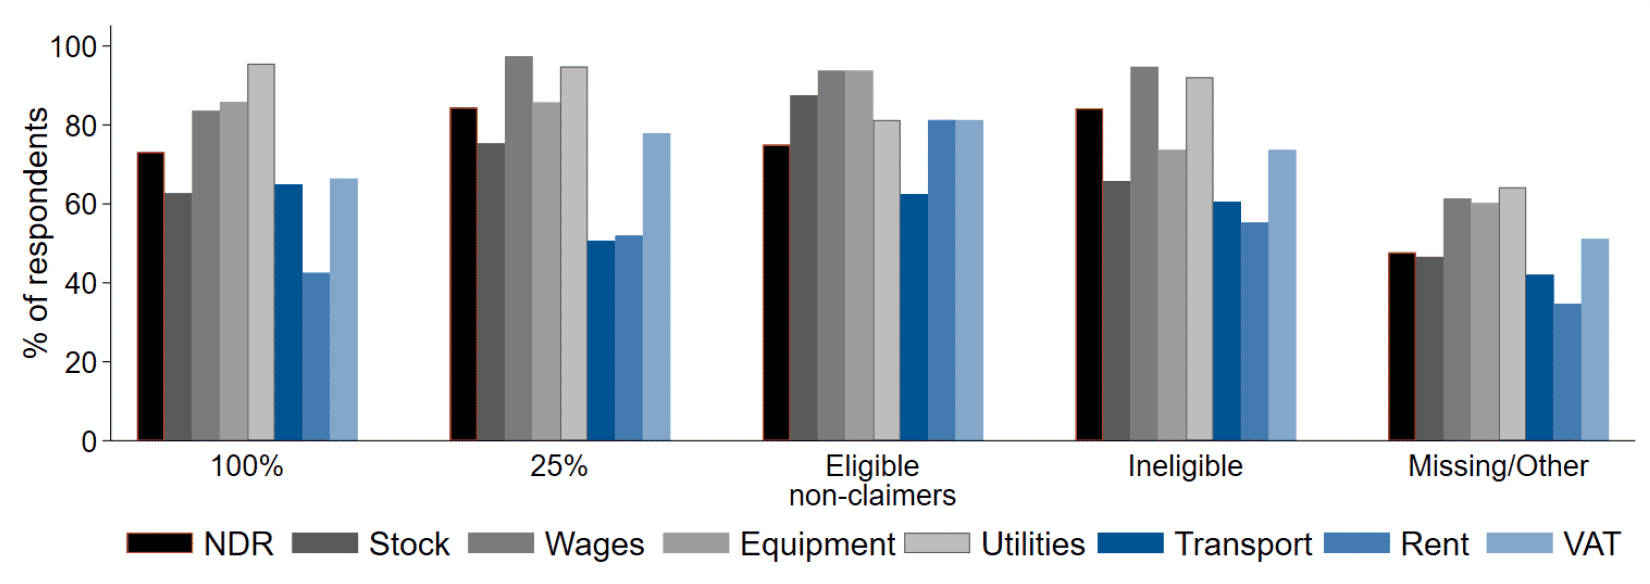
Figure 6.9 below presents the proportion of respondents for each claim status that ranked each cost as important or very important. As can be seen, NDR rank relatively highly for all businesses among other elements of their cost base, particularly for those that only receive 25% relief or are ineligible. Perhaps surprisingly, 100% recipients also report NDR as an important part of their cost base.
Note: Bars are shares of respondents in each business category. They do not add to 100% due to non-responses.
Note: bars are % of all respondents in each category. They do not add to 100% due to non-responses.
6.2.3 The effect of changing business costs
We also asked businesses about the implications in terms of business activity of an increase or decrease in their business costs. Without specifically asking: "what would be the effect of you receiving SBBS if you do not already?" (i.e. business costs reducing); and "what would be the effect of you not receiving SBBS and therefore having to pay non-domestic rates?" (i.e. business costs increasing) – which would likely provoke a single response – this question was designed to ascertain the likely effect of changing the SBBS thresholds.
Specifically, in questions 11 and 12 we asked how a £300 increase or decrease in monthly costs would impact on their spending. Figure 6.10 shows the proportion of respondents who reported each possible impact for both an increase and decrease in costs.
Overall, it was most commonly reported that changes in costs would impact business viability (both when costs increase and decrease). At the other extreme, it was common to report that these changes would have no, or almost no impact. This suggests considerable heterogeneity among the respondents to the survey: either they would be considerably affected by this (relatively small) change in costs, or they would be largely unaffected.
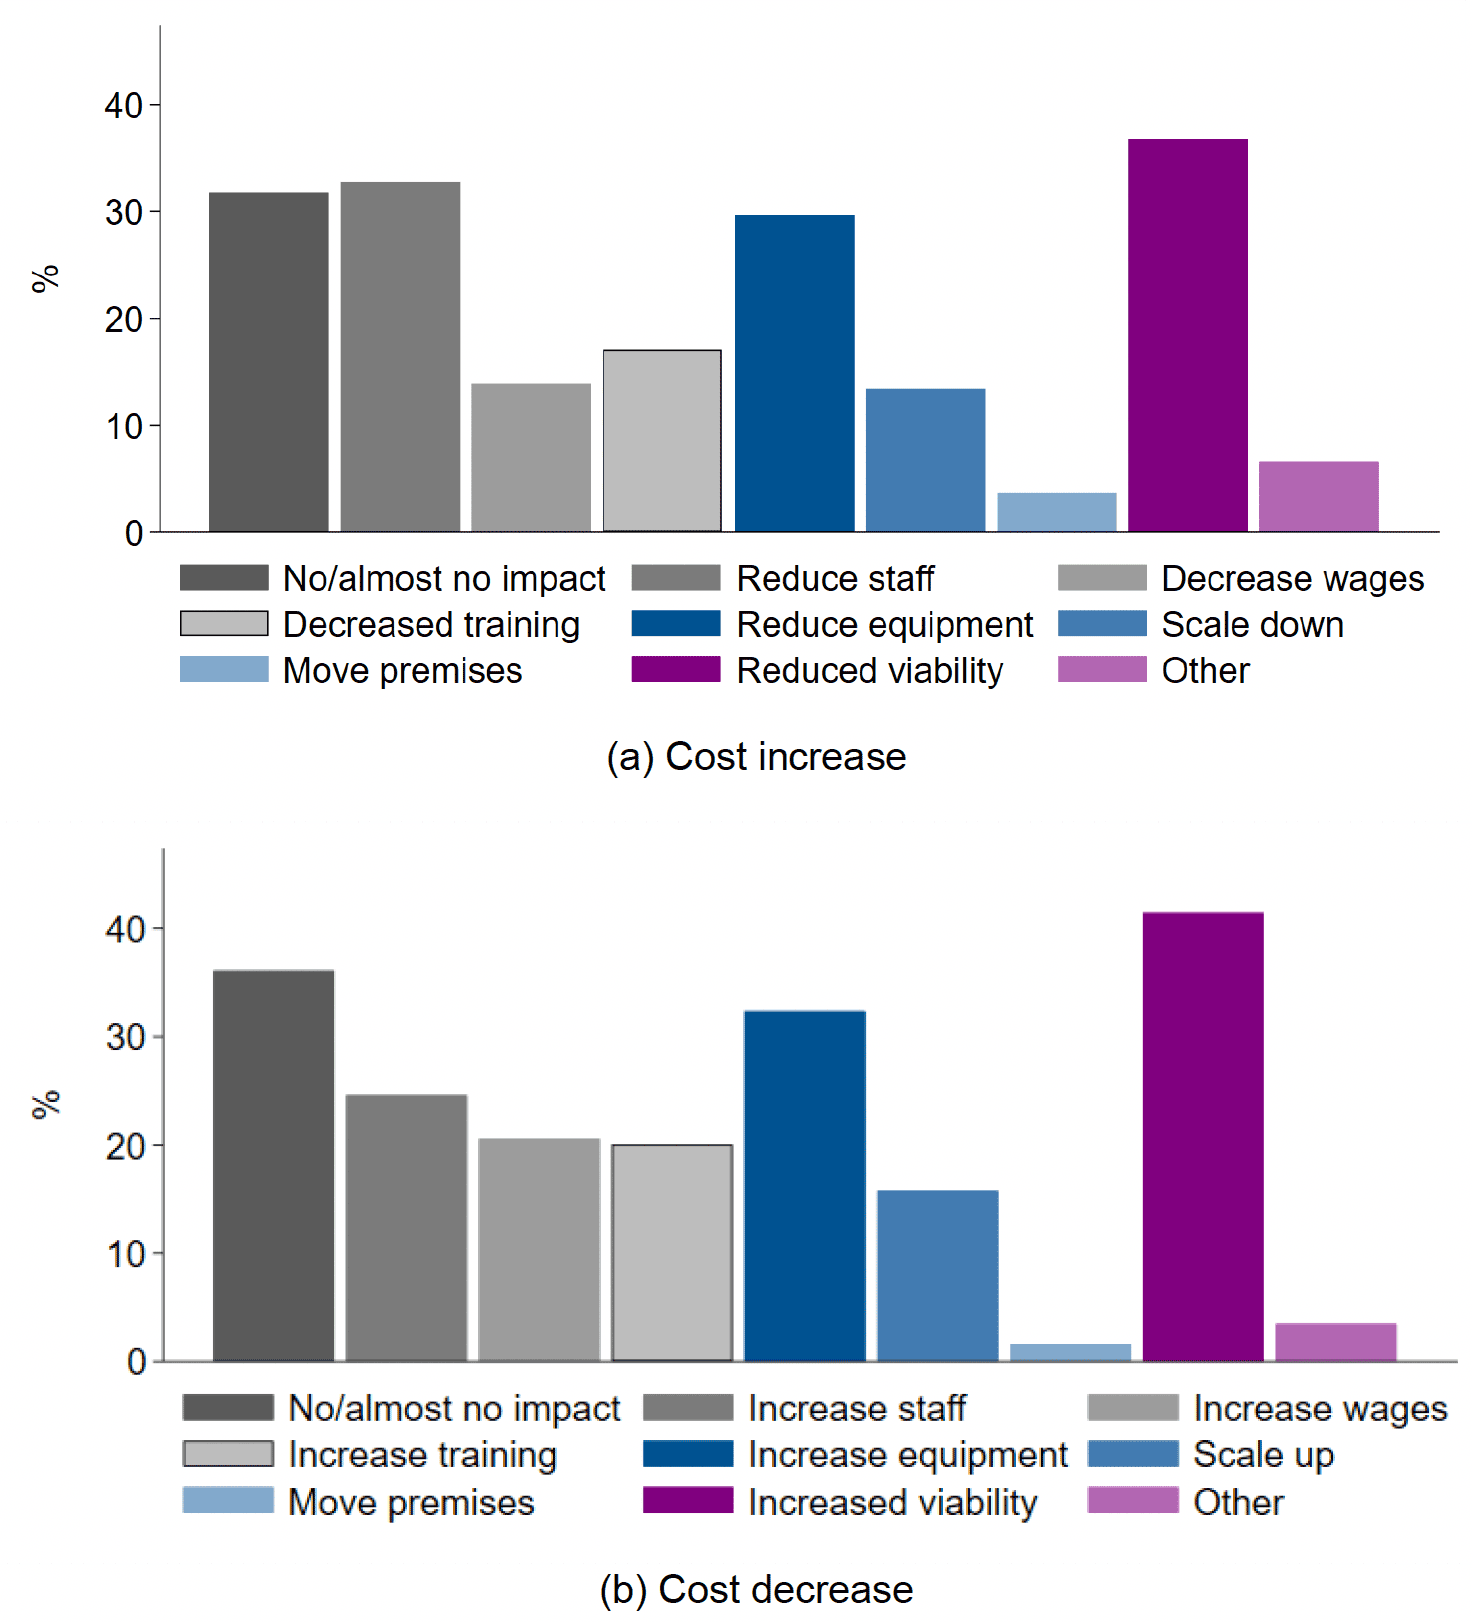
It was also frequently reported that both increases and decreases in monthly costs would affect investment in staffing, training and equipment. Staffing was reported to be more affected by cost increases relative to decreases, whereas a higher proportion of respondents reported that they would meet cost decreases with increased wages than reported they would cut wages if costs increased: the suggestion is thus that businesses would be more likely to cut jobs if costs increased, but increase wages rather than hire staff if costs decreased.
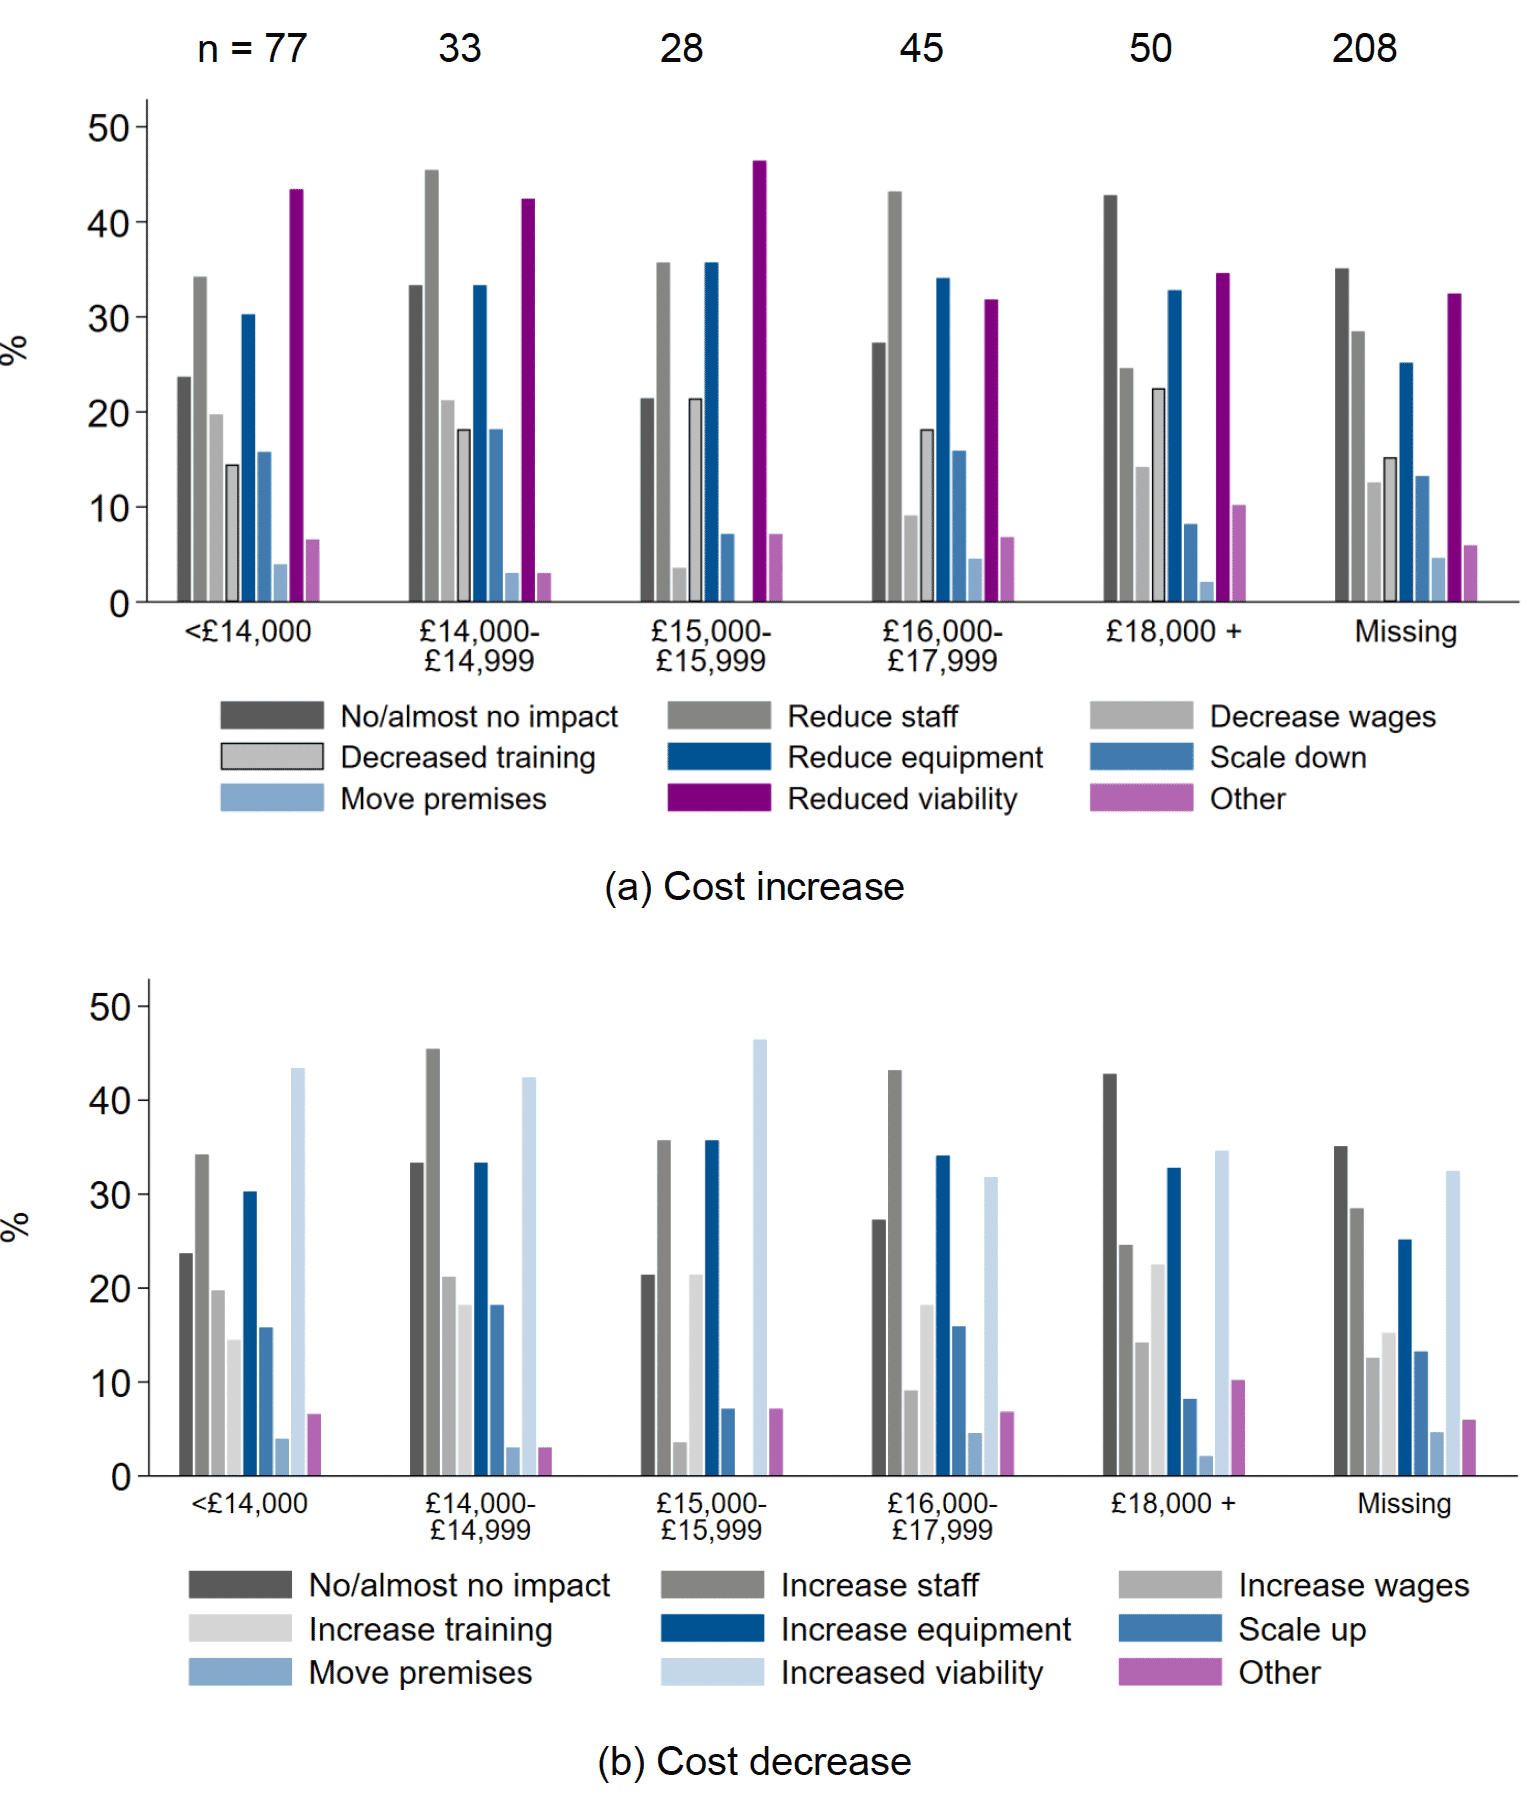
There are some differences in the reported impacts across the RV distribution.[35] Figure 6.11 shows that whilst the broad patterns in responses are the same across RV groupings, smaller businesses were less likely to respond that cost changes would have less or no impact, and slightly more likely to report that they would affect viability.
These differences were most pronounced with respect to the impact on staffing and wages among those just below and above the 100% SBBS threshold. The reported sensitivity of these types of spending is somewhat in line with the higher proportion of respondents below this threshold reporting to be real living wage employers. Those just below the threshold were also more likely to report that the cost increase/decrease would have little or no impact compared to those just above, perhaps highlighting the cushion 100% SBBS relief affords them. Again, we note the reduced sample sizes when making these comparisons.
The data from this question allows something of an understanding to be gained of the effect of a change in the SBBS policy that, for example, reduced the threshold for 100% relief from £15,000 to £14,000. Those businesses in the £14,000 to £14,999 RV band would then face an increase in business costs as they would only receive 25% SBBS relief, all else being equal.[36] The effect of this would seem to be heterogeneous: 33% of businesses report they would be unaffected; while 42% would suffer from reduced viability and 46% said they would reduce their number of staff.
Likewise, we can gain an understanding of the effect of increasing the threshold from £15,000 to £16,000: those businesses with an RV between £15,000 and £15,999 would have 100% rather than 25% relief, and so would see a reduction in their business costs.[37] Again, the effect would seem to be heterogeneous: for 33% this would have no effect, while for 47% it would increase their viability.
In both the case of cost increases and decreases, very few businesses reported that a change in cost structure would incentivise them to move premises, suggesting that business location is unaffected by such changes. When viewed alongside the high proportion of businesses reporting that viability would be affected by cost changes, this seems even more plausible if respondents viewed closing as preferable for their business relative to moving location; it is likely that savings dictate whether or not it operates, as opposed to whether it changes its location.
This suggests that the support for businesses the policy provides affects businesses in very different ways: the responses suggest the effect of reducing or increasing SBBS relief most commonly either has no effect, or changes business viability. Thus, the policy seems highly important to some businesses, but largely unimportant to others. We reported above that if turnover and employment are a proxy for business size, then business size varies widely within RV bands and brings into question whether RV is the appropriate primary criterion by which to award NDR relief. The evidence presented here, which looks at the potential effects of changing that support, compounds this view, particularly if the purpose of the relief is to ensure a supportive tax regime for smaller businesses which would not otherwise be viable.
Note: Sample size is identical in both panels.
6.2.4 Government spending
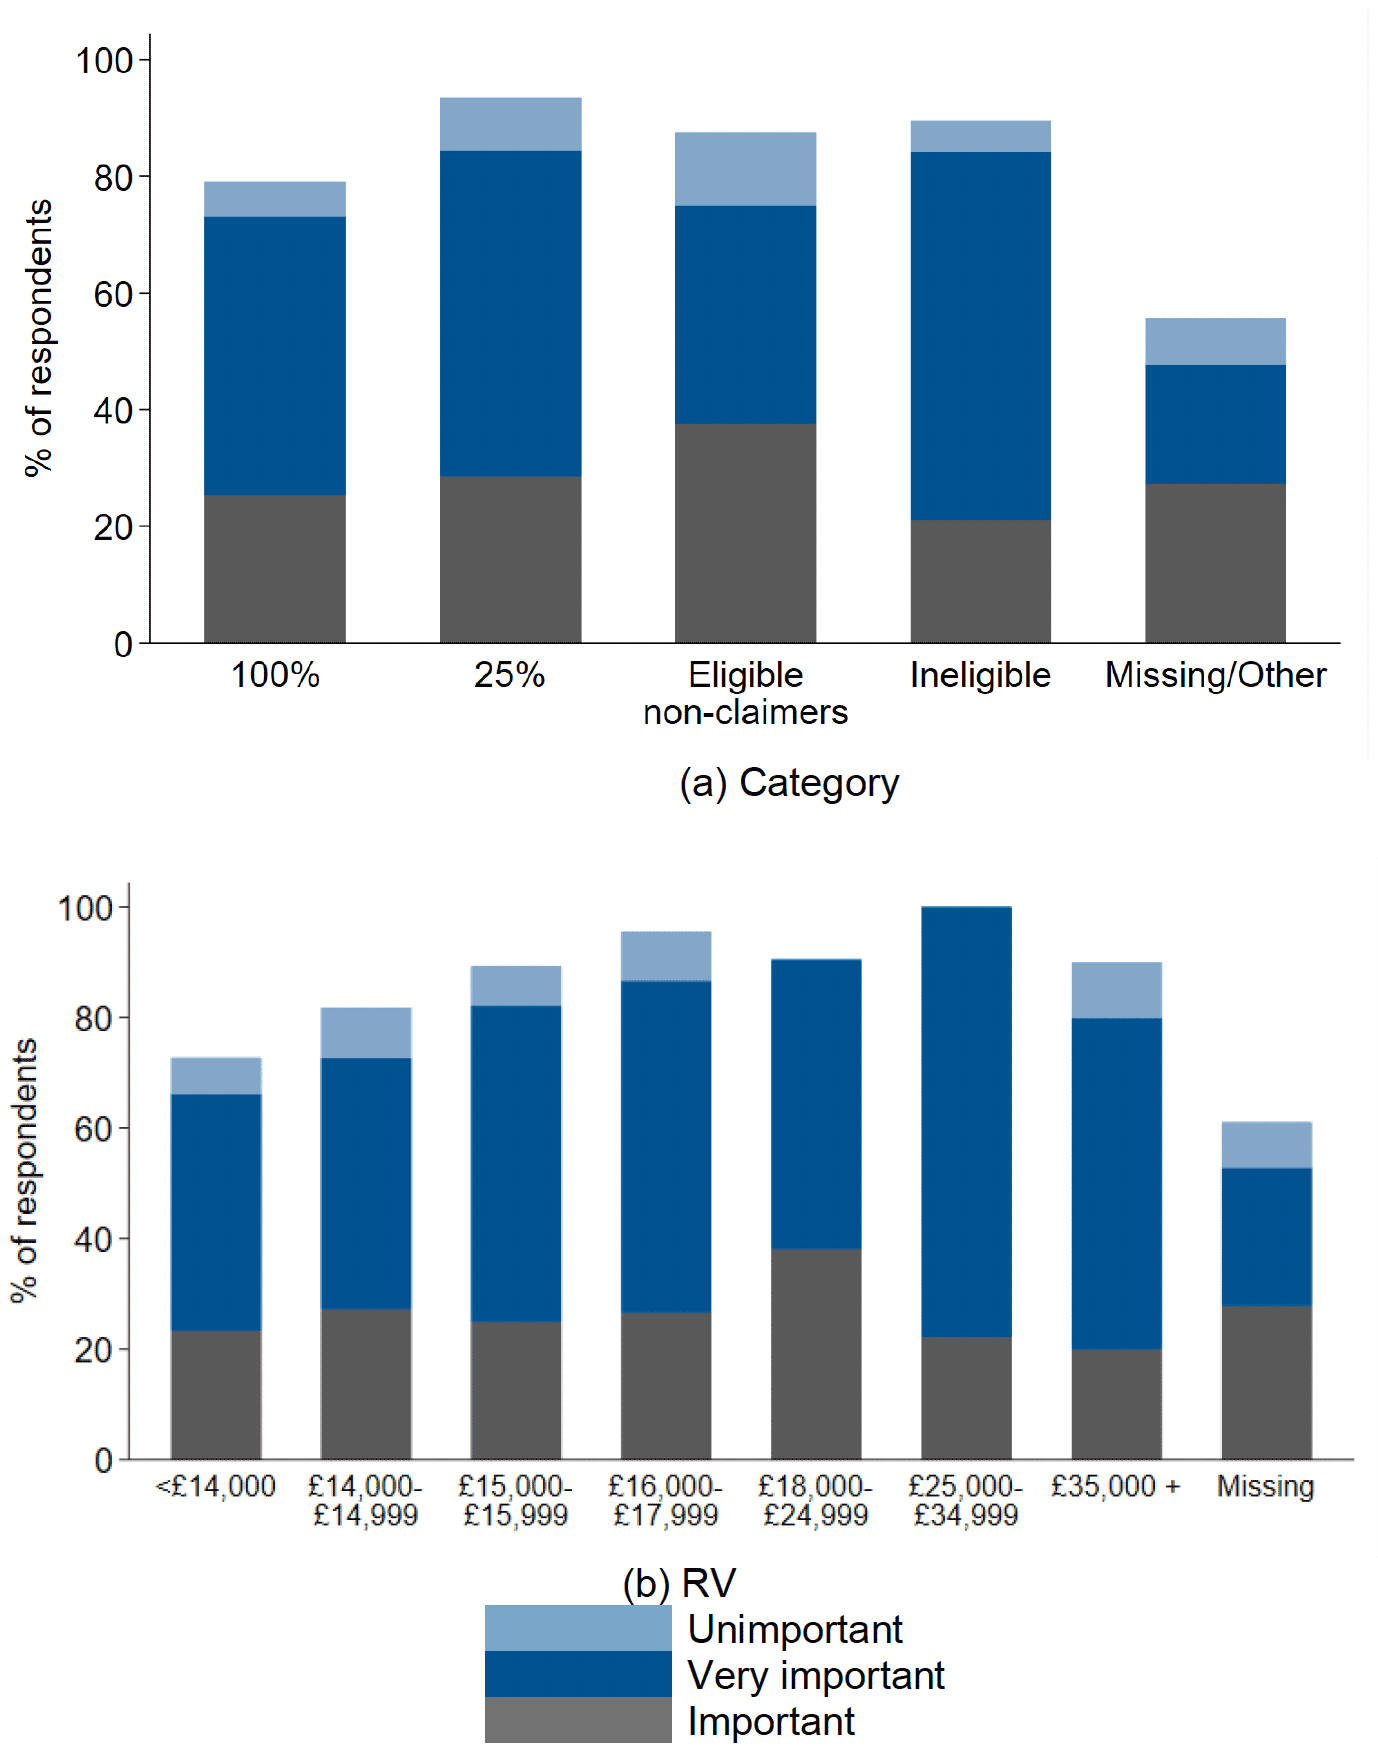
Finally, in question 13 we asked respondents to rank the importance of six types of government spending to their business. The purpose of this question was to gain insight into business perceptions of the relative importance of non-domestic rates relief among other aspects of government support measures for the economy in 'normal times' – including spending on education and skills, public transport, support for town centres, business services, and other business support such as grants – on the basis that any policy change that increases non-domestic rates relief would likely need to be offset by reductions in government spending elsewhere. Figure 6.12 shows the proportion of respondents who reported each type of government support as important or very important to their operation, both overall (panel (a)) and across business category (panel (b)) and by RV (panel (c)).
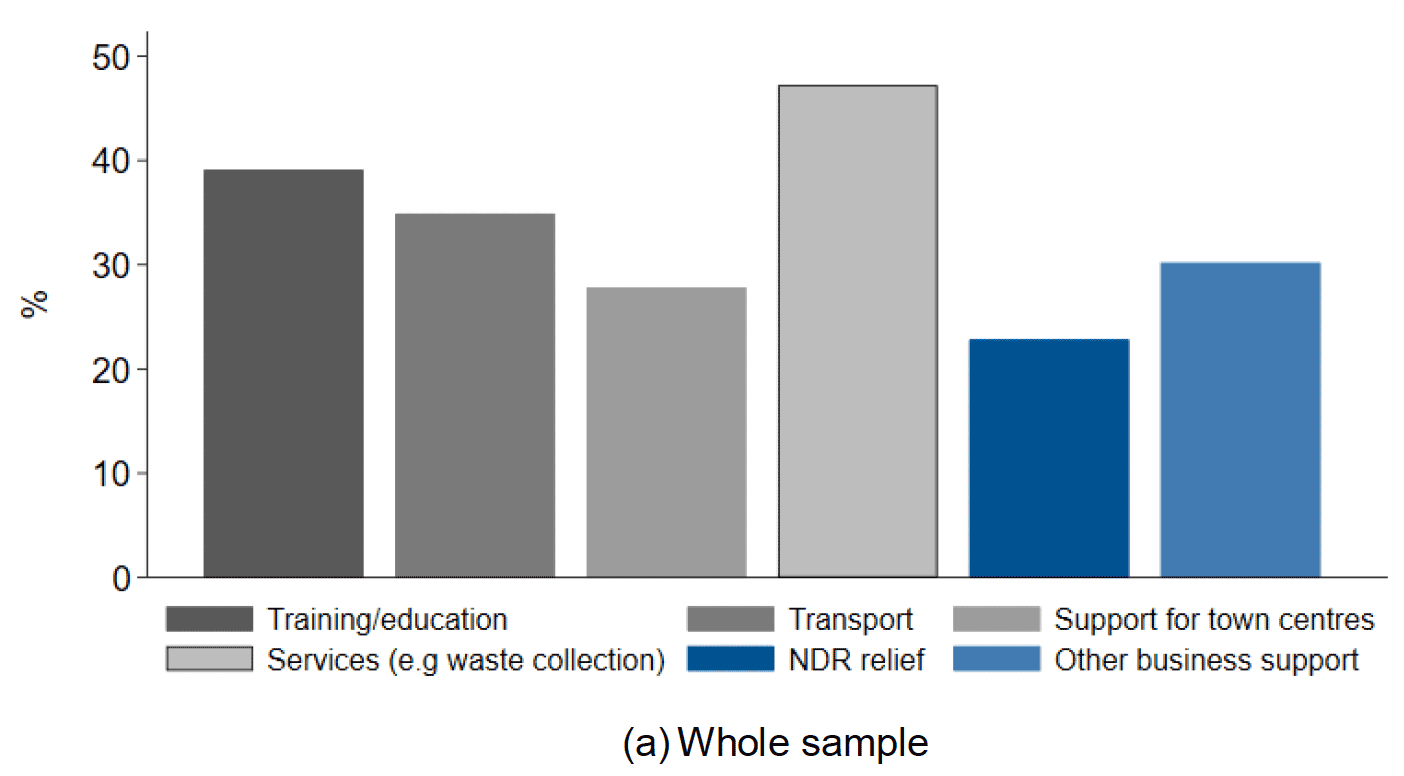
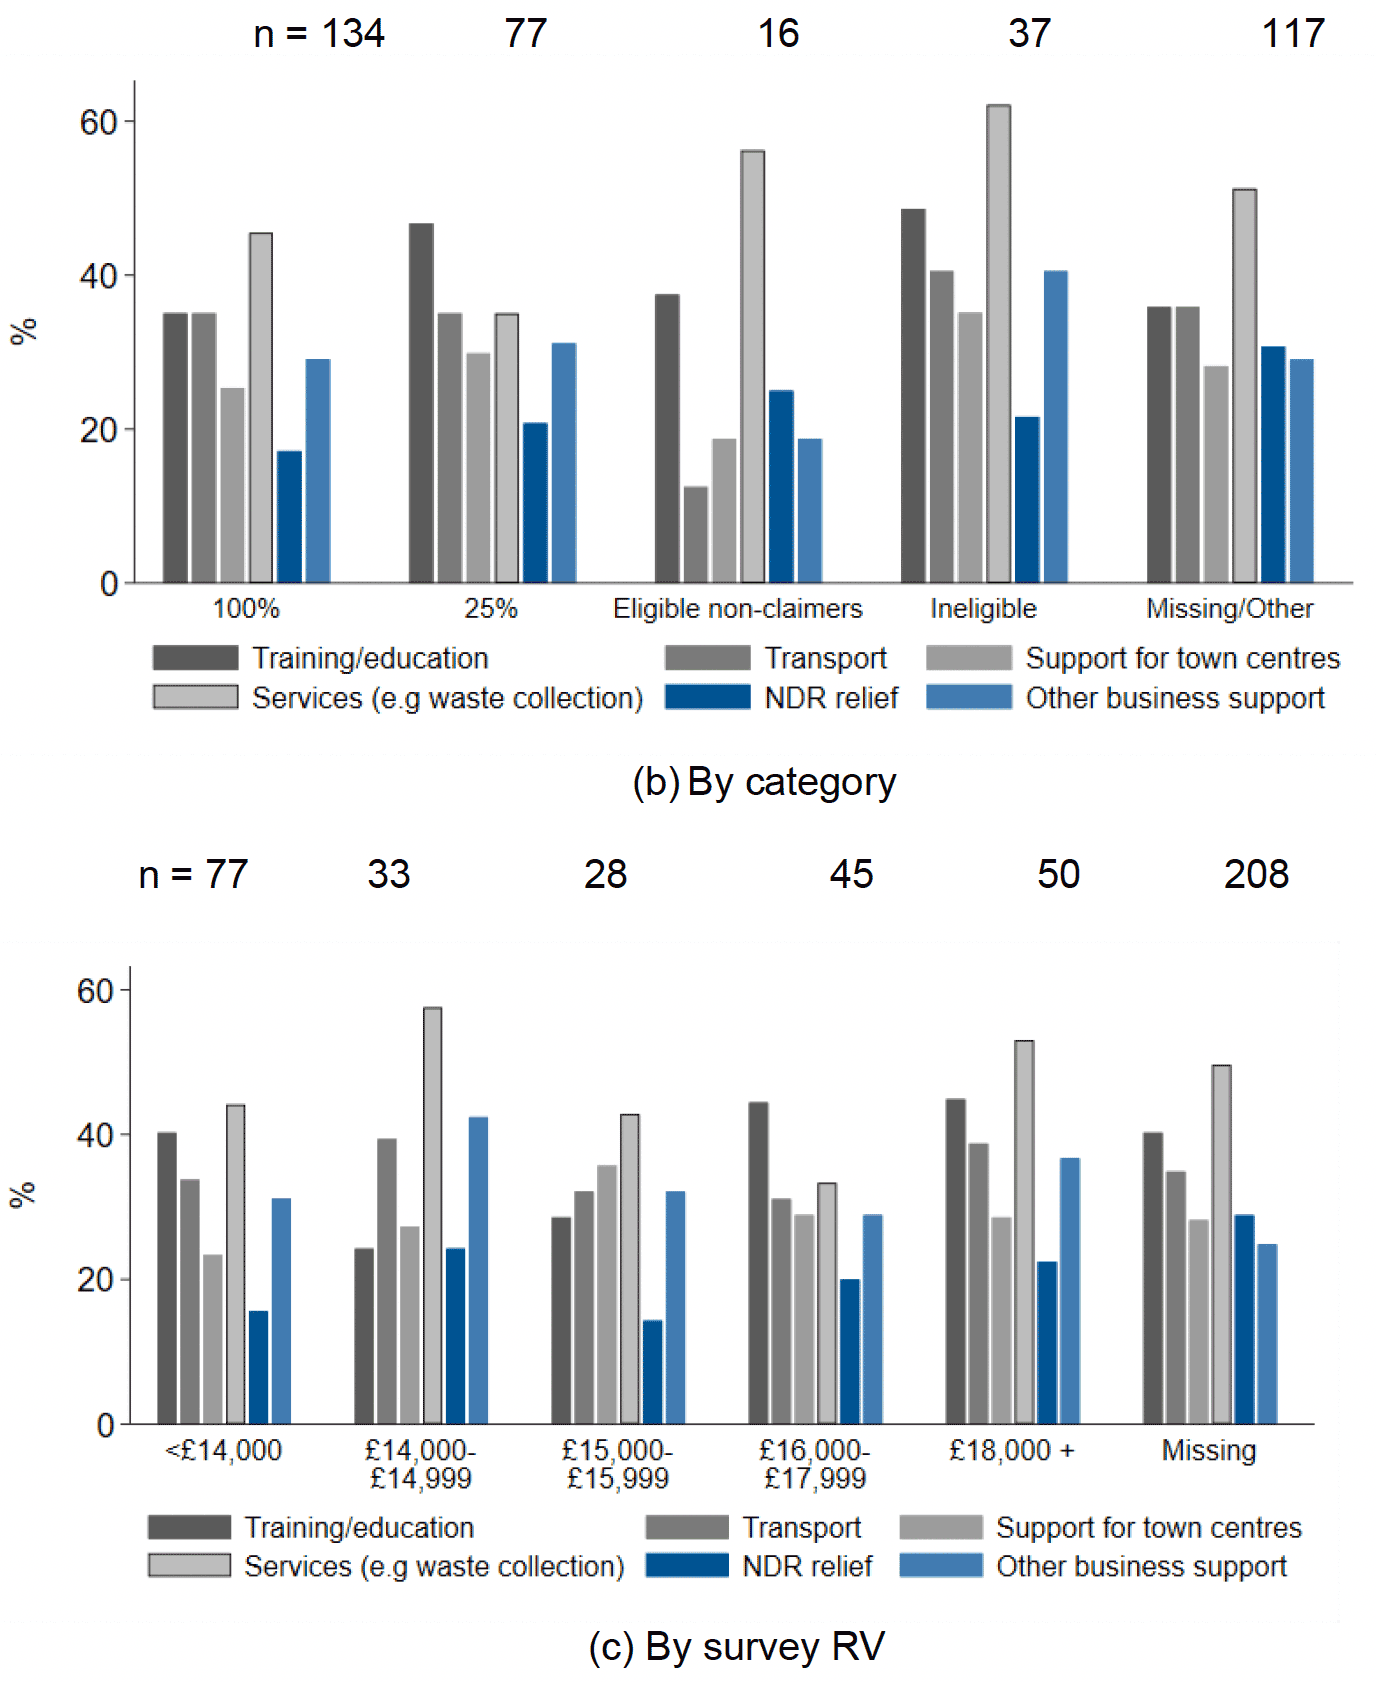
The key finding from the responses to this question is that among the channels of government support considered in 'normal times', NDR relief has the lowest importance. This is true for almost all business categories and RV bands, even those eligible for the SBBS.
Counterintuitively, Figure 6.12b shows that a lower proportion of recipients of 100% SBBS relief than in any other group reported that NDR relief was important. However, this is driven by the low prevalence of this answer among properties with an RV below £14,000 (panel c). Comparing those just below with those just above the 100% SBBS threshold, a higher proportion of businesses see NDR relief as important, however for both groups NDR relief is in fact less important than other forms of government support. Only those with an RV greater than £35,000 or with missing RV information are more likely to report NDR relief as being important. Those just below the threshold are the least likely to report this.
The roughly equivalent rank of NDR spending across RV bands might be a result of businesses with a higher RV benefiting from reliefs other than the SBBS, or feeling that the wider benefits of this type of support impact their business. For example, they might believe that NDR spending helps new businesses appear and grow, perhaps in specific locations which can result in community or agglomeration effects. We also cannot rule out that businesses report that NDR relief is important knowing they are contributing to an evaluation that might lead to an extension or change in the coverage of NDR relief.
The mode of government support which is most commonly reported as important or very important is spending on services such as utilities and waste collection. This is also true across the majority of the RV distribution, particularly for those just below the 100% SBBS threshold (from reported RV). These businesses are also slightly more likely than all others to have reported that other business support is important, and more likely than those just above the threshold to report that NDR relief spending is important. Education and training and transport are also commonly ranked as important areas of government support.
6.2.5 Summarising responses to the business operations questions
NDR ranks highly as a business cost broadly across the respondents to the survey, but at the time of the survey, businesses did not report that they see non-domestic rates relief as an important component of government spending, particularly those that receive it.
There is some partial evidence that businesses in receipt of more generous support from the SBBS have increased their investment in recent years, but SBBS recipients are no more likely to pay the Real Living Wage than non-recipients.
We investigated the impact of a cost change on businesses with the aim of simulating a change in the policy, increasing support for businesses that currently receive partial support, and reducing it for those that receive full support. While some businesses reported that there would be an effect on their operations, a large proportion of businesses either reported that it would have no effect or would impact viability. This suggests that the need for support from the SBBS is very heterogeneous among the businesses that receive it.
As we have taken care to highlight throughout, we cannot draw robust conclusions about the wider impact of the SBBS from these comparisons. In addition to issues stemming from the relatively low response rate obtained, the economic environment in which this survey was conducted – a period that included changes to non-SBBS NDR relief – was challenging. We also know that there are issues around incentive compatibility; we cannot rule out, for example, that responses were influenced by the purpose of the survey – a business owner or occupier perceiving that this survey might impact future NDR relief may have an incentive to report large impacts of small cost increases (for example on viability) if they perceive that not doing so might result in the savings they enjoy through the SBBS not being maintained. Due to the small sample size achieved, we are also not able to disaggregate comparisons geographically in order to understand how they differ depending on businesses' location – a factor that might be key in determining need. For all of these reasons, we take these findings as descriptive, and only broadly indicative that businesses in receipt of SBBS relief enjoy some benefit, but not that it is crucial to determining spending, business viability or operation.
6.3 SBBS questions
The remainder of the survey asked about respondents' knowledge of and perceptions about the SBBS. These questions were asked to all respondents, not only those who reported to receive SBBS relief or who recorded their RV. This was so we could compare knowledge and perceptions of the SBBS among those who received it and those who did not, and hopefully understand the extent to which, if it all, these differ.
6.3.1 Knowledge of the SBBS
We asked a series of direct questions about respondents' interaction with the SBBS (questions 15-21). Respondents were asked (in question 15) if they know the value of their NDR bill, who pays it (question 16) and whether or not they had heard of the SBBS (question 17).
Overall, 72% responded that they know their NDR bill and 12% that they do not. The remaining 16% did not answer. Knowledge of NDR bills differed depending on business category. Of those who reported to receive 100% and 25% SBBS relief, 88% and 94% respectively knew their bill. Of ineligible businesses, 95% also knew their bill; however only 46% of those whose response was missing or "other" to the question about SBBS relief reported to know their bill. It was also the case that renters and owners were equally likely to know their NDR bill, with 72% and 74% of each group respectively reporting to be aware of their charges.
In terms of who takes responsibility for paying the NDR bill, the most commonly recorded bill-payer was the respondent themselves, with 77% of those who responded indicating that they paid the bill. The next most common response was the option to record a bill-payer who was not provided in the response options.[38] Roughly 15% chose to provide an "other" option, with the most common text response being that another member of the family or business paid the bill, or that the business was exempt because they were a charity or nursery.[39] Several respondents indicated here that they did not pay NDR because of the SBBS, which suggests that they knew they got relief but may not be aware of its monetary value.
Recording "other" as a response was most common in properties with an RV below £14,000, otherwise respondents consistently reported themselves to be the ratepayer at a similar rate across business categories.
Respondents were more likely (68%) to report that they paid the bill themselves if they were majority owners of their business properties as opposed to majority renters (61%). This response was also more common (94%) among those receiving 25% relief. Among those claiming relief, 82% of owners reported paying the bill themselves compared to 65% of renters. The majority of this difference is due to renters responding with "other", however, as opposed to "don't know" or "landlord". Common responses in the "other" category were that respondents were exempt. This suggests that it is not at all common for landlords to pay the NDR bill, and therefore the scope for capitalisation of SBBS relief by landlords is low.
In terms of awareness of the SBBS, roughly 57% of all respondents recorded that they were aware of the SBBS, whereas 27% said they were not and 15% did not answer. Unsurprisingly, knowledge of the SBBS was significantly higher among those who claimed – 84% and 90% of those who reported receiving 100% or 25% relief respectively also reported to know of the SBBS. In theory, both of these proportions should be 100%, given that these businesses report to receive a level of SBBS relief. The fact that it is not perhaps suggests that some know they get an exemption and record it in their reported relief level (attributing it to the SBBS), but they did not actually know that this was a result of the SBBS.
Only 7 of the 16 eligible non-claimers reported to know the SBBS, as did roughly 50% of those who had an RV in the eligible range but did not respond to the question about their relief level. This perhaps suggests that some businesses who do not claim SBBS relief but are eligible are unaware of the scheme.
The rate of awareness was almost identical among majority renters and owners – roughly 59% of each reported to be aware of the SBBS. There is no evidence from the survey, therefore, that respondents' landlords take responsibility for NDR bills and the associated savings to procure the benefits of the SBBS for themselves at the expense of the business renting their properties. In other words, we do not find evidence of capitalisation by landlords.
This all suggests that those respondents most exposed to the SBBS have an increased awareness of the scheme, but that in general awareness of NDRs and the SBBS is not broad-based.
6.3.2 Perceptions of the SBBS
The last section of the survey (questions 22-30) was designed to explicitly understand respondents' subjective opinions about the SBBS. Previous portions of the survey were aimed primarily at objectivity, however this was not to suggest that businesses' subjective evaluation was not of interest for the evaluation. We therefore included these questions in order to understand what opinions were regarding the efficacy of the SBBS and its role in funding small businesses.
This portion of the survey first asked respondents about the impact that receiving SBBS relief has on five aspects of their business: hiring staff or increasing their hours, paying the Real Living Wage, investing in business improvements, investing in staff training and business survival.
Table 6.1 shows the number of businesses reporting each degree of impact on each of these, with responses ranging from no impact (1) to substantial impact (5), by the level of reported SBBS relief they receive.[40]
| Outcome | SBBS | No impact | 2 | 3 | 4 | Substantial impact |
|---|---|---|---|---|---|---|
| Business survival | 25% | 14 | 7 | 9 | 12 | 57 |
| 100% | 4 | 12 | 8 | 4 | 68 | |
| Hiring more staff or increasing staff hours | 25% | 7 | 14 | 44 | 18 | 10 |
| 100% | 6 | 9 | 29 | 16 | 30 | |
| Investing in business improvements | 25% | 9 | 26 | 26 | 18 | 18 |
| 100% | 4 | 16 | 13 | 19 | 41 | |
| Investing in staff training | 25% | 16 | 18 | 38 | 14 | 10 |
| 100% | 7 | 19 | 29 | 10 | 24 | |
| Paying the Real Living Wage | 25% | 13 | 10 | 38 | 14 | 18 |
| 100% | 6 | 11 | 30 | 11 | 34 | |
| Other | 25% | 3 | 13 | 1 | 7 | 0 |
| 100% | 1 | 15 | 1 | 8 | 0 |
Those respondents that receive 100% relief record a greater impact of the SBBS across all outcomes than those that receive 25% relief. For both sets of respondents, the impact of SBBS relief seems to be most keenly felt on business survival, with investments in business improvements and paying the Real Living Wage also being prominent in terms of SBBS relief having a substantial impact. We do note, however, that in contrast to our generic question on business costs increasing/decreasing, this question is specifically focused on the impact of SBBS relief on those who receive it. In the context of a Scottish Government-sponsored survey on the SBBS, the reader may question the objectivity with which these responses are provided, which is a natural and unavoidable challenge of such a survey (and one which our earlier question sought to ameliorate).
The final set of questions on the SBBS asked the extent to which respondents agreed with the following eight statements related to SBBS relief:
Q23. Every business, no matter how small, should pay at least some non-domestic rates to make a contribution to local services.
Q24. SBBS is important in supporting town centres.
Q25. SBBS is ineffective in supporting small businesses as any relief received is reflected in higher property rent.
Q26. SBBS relief represents only a small cost saving for businesses relative to the other costs they face.
Q27. SBBS gives an unfair competitive advantage to recipients
Q28. SBBS, which provided £254m of relief in 2018-19, is a good use of public money.
Q29. SBBS is a key factor in business location choice.
Q30. SBBS relief eligibility is a factor in decisions about investment in improving/expanding business property/ies.
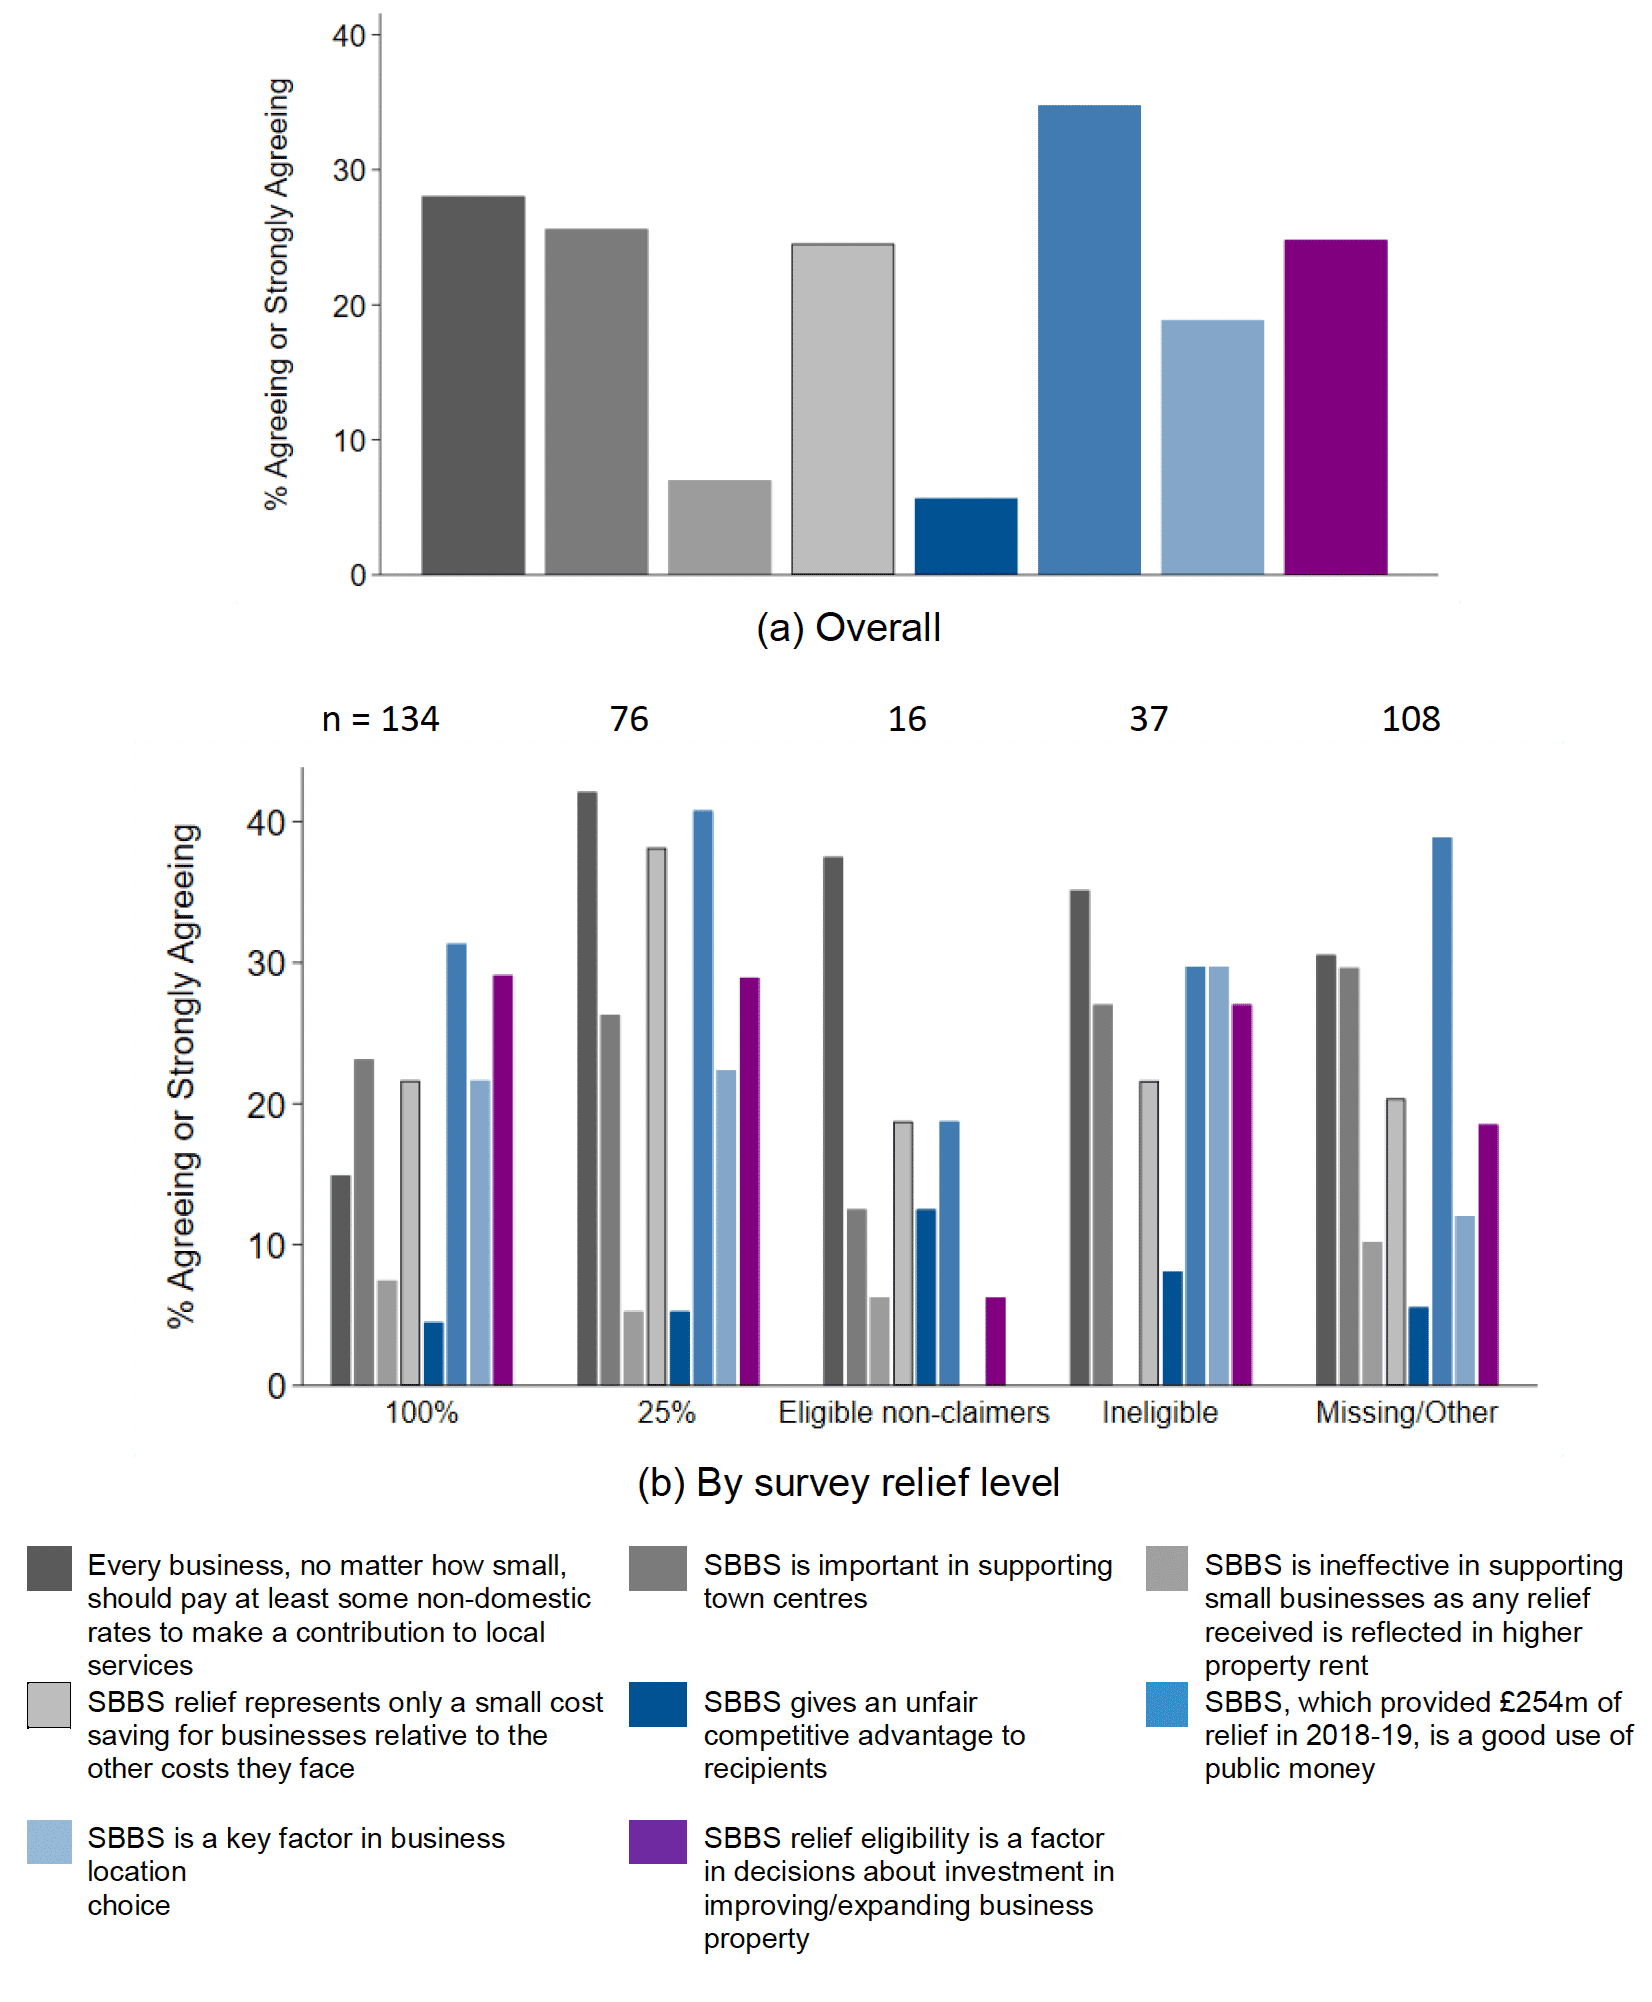
These questions were asked to all respondents, not just those in receipt of SBBS relief, and there were six possible responses: strongly disagree, disagree, neither disagree nor agree, agree, strongly agree and don't know. Figure 6.13 shows the proportion of respondents that either agreed or strongly agreed with these statements both overall and by level of relief enjoyed. Note the scale of the axis, which has a maximum value of 40%, so no question receives agreement from the majority of businesses either in each of the groups we identify, or as a whole.
These questions were designed to address several of the research objectives we were tasked with investigating that could not be considered using our descriptive and econometric analyses.
Question 23: Should every business pay at least some NDR? There was some support for businesses paying at least something among those that receive partial relief from the SBBS and those that receive no relief. Unsurprisingly, the support for this declines among those who currently enjoy 100% relief.
Question 24: Does SBBS support town centres? There was only moderate agreement that it does among claimers and non-claimers. There was a similar response to question 29 which asked whether SBBS relief was an important consideration in business location choice. As we outlined at the beginning of this section, we do have responses from each local authority area, however the sample of respondents is not large enough to meaningfully disaggregate their responses to these questions in order to understand if the agreement differs by location. As a result, we cannot be sure that this average response accurately represents those for whom the SBBS is most likely to incentivise their location decision.
Question 25: Is SBBS capitalised by landlords? This question sought to understand whether it is the view of responders that the benefits of the SBBS are captured by landlords. The responses suggest that this view is not supported, even for businesses in relatively small properties that receive 100% relief, consistent with our discussion above on who pays the NDR bill.
Question 26: What is the importance of SBBS relative to other business costs? Unsurprisingly, agreement with this question is lower for businesses that receive 100% relief compared to those that receive 25% relief, and suggests that for the majority of small businesses that receive 100% relief, the cost saving provided by the SBBS is substantial.
Question 27: Does SBBS give an unfair advantage to recipients? There is very little agreement with this statement posed in question 27. Those that receive no relief are slightly more likely to agree with the statement, but even so this amounts to only 10% of respondents.
Question 28: Is SBBS a good use of public money? We included the cost to the Scottish Government of the SBBS scheme (£254m in 2018-19) in Q28, and surprisingly the agreement with this question was lower among those that receive 100% relief compared to those that receive only 25% relief or no relief at all. This is the question that received most agreement across businesses, but even so a maximum of 40% of respondents agreed with the statement in the question.
Question 30[41]: Is relief eligibility a factor in decisions about investment in improving/expanding business property/ies? This question was included to understand whether the SBBS promotes investment by businesses. As can be seen, those that receive SBBS relief claim it does more than the perception of those that receive no relief, but even so, less than 30% of businesses agree that the SBBS promotes investment.
Every business, no matter how small, should pay at least some non-domestic rates to make a contribution to local services
SBBS is important in supporting town centres
SBBS is ineffective in supporting small businesses as any relief received is reflected in higher property rent
SBBS relief represents only a small cost saving for businesses relative to the other costs they face
SBBS gives an unfair competitive advantage to recipients
SBBS, which provided £254m of relief in 2018-19, is a good use of public money
SBBS is a key factor in business location choice
SBBS relief eligibility is a factor in decisions about investment in improving/expanding business property
Looking at Figure 6.13, for the most part, the patterns in responses are intuitive. Those who receive SBBS relief are less likely to believe they should pay more in NDR, make larger saving through the SBBS relative to their costs, and are more likely to agree that SBBS relief is a good use of public money. It is also unsurprising then that they are more likely to agree that these savings are a factor in their location and facilities investment decisions, since moving to or extending a property to have an RV above the £15,000 threshold would mean losing eligibility. That those who enjoy less benefit from the SBBS tend to be more likely to agree that all businesses should pay NDR and it is only a small saving is equally unsurprising, as is the fact that those who receive no relief are more likely to agree that relief gives an unfair advantage to recipients is equally unsurprising.
Ineligible businesses and those who did not respond to the question on relief were also likely to agree with the statements that the SBBS was a good use of public money, and that it was a factor in location choice and making improvements in properties. It is plausible that businesses responded to these questions with the wider effects of the SBBS in mind, as opposed to its impact on their own business.
For these questions, there are some small differences in the level of agreement across key-dates. For example, a slightly higher proportion of respondents agree that all businesses should contribute through NDR (Q23) and that SBBS relief represents only a small saving (Q26) after the Chancellor's budget. Although it is conceivable that these responses might have been affected by the budget's focus on NDR relief, we cannot know for sure if it caused the differences.
6.4 What can we infer from the survey analysis?
Despite sampling heavily from the population of businesses, the response rate means the achieved sample was relatively small. Moreover, for much of the analysis the useable sample was further limited, as we have discussed, to those that provided their RV or claim status. As such, we were unable to disaggregate comparisons between businesses by multiple characteristics, for example by RV and claim status or location. Further, comparisons between different groups of businesses must remain descriptive rather than conclusive in a statistical sense.
Also, as we have documented in Section 5, we faced challenges in administering our survey of businesses. Notwithstanding these challenges, the results of the survey provide some interesting insights:
1. From the data we collected, there is no discernible difference in turnover or FTE employment between businesses that receive 100% SBBS, 25% SBBS, or no relief. Moreover, there was very little agreement with the statement that SBBS relief gave an unfair advantage to businesses. There is no evidence from these questions that suggests the SBBS affects these business outcomes. However, there is a great deal of variability in the data and the small sample size means that we cannot effectively control for other potential explanatory factors.
2. We investigated what effect a change in business costs would have on expenditure, seeking to understand what the effect would be of reducing the SBBS thresholds (therefore exposing some businesses to higher business costs), and increasing those thresholds (so some businesses would enjoy lower costs). Roughly 64% of businesses reported cost increases would impact them in at least one way, while 59% of businesses reported a cost decrease would have an impact. The reported effects are heterogeneous; some businesses reported almost no impact of either change, while others reported it would impact viability. Others reported it would influence staffing and expenditure on equipment. The fact that there is so much variation of business outcomes within RV band, coupled with this heterogeneous impact of reducing SBBS support, suggests that using the RV of the properties a business occupies as the main determinant of NDR relief might be reviewed. However, far more comprehensive data are required to fully understand how the SBBS affects different businesses and what characteristics are shared by those that benefit the most.
3. The level of awareness of their NDR bill among businesses is high. However, while there is a relatively high level of awareness of the SBBS among claimers, there is a much lower level of awareness generally (which is consistent with there being a surprising number of businesses we classify as eligible non-claimers in the data). We do not find evidence of landlord capitalisation of SBBS relief, or indeed that it is the landlord that pays the NDR bill; this is supported by the very low agreement with the statement that 'SBBS is ineffective in supporting small businesses as any relief received is reflected in higher property rent' – just 7% of respondents agreed that this was the case.
4. In terms of the impact of SBBS relief for claimers, 66% of claimers reported that it has a substantial impact on business survival; 36% on investing in business improvement; and 31% on their ability to pay the Real Living Wage.
5. 35% of businesses in the sample thought the SBBS was a good use of public money, which is consistent with businesses placing less importance on non-domestic rates relief relative to other uses of government expenditure.
Contact
Email: ndr@gov.scot