Small Business Bonus Scheme: evaluation
This report presents the results of an evaluation of the Small Business Bonus Scheme (SBBS), and provides recommendations in relation to the SBBS and non-domestic rates relief more broadly.
Appendix E: Additional tables and results from the econometric analysis
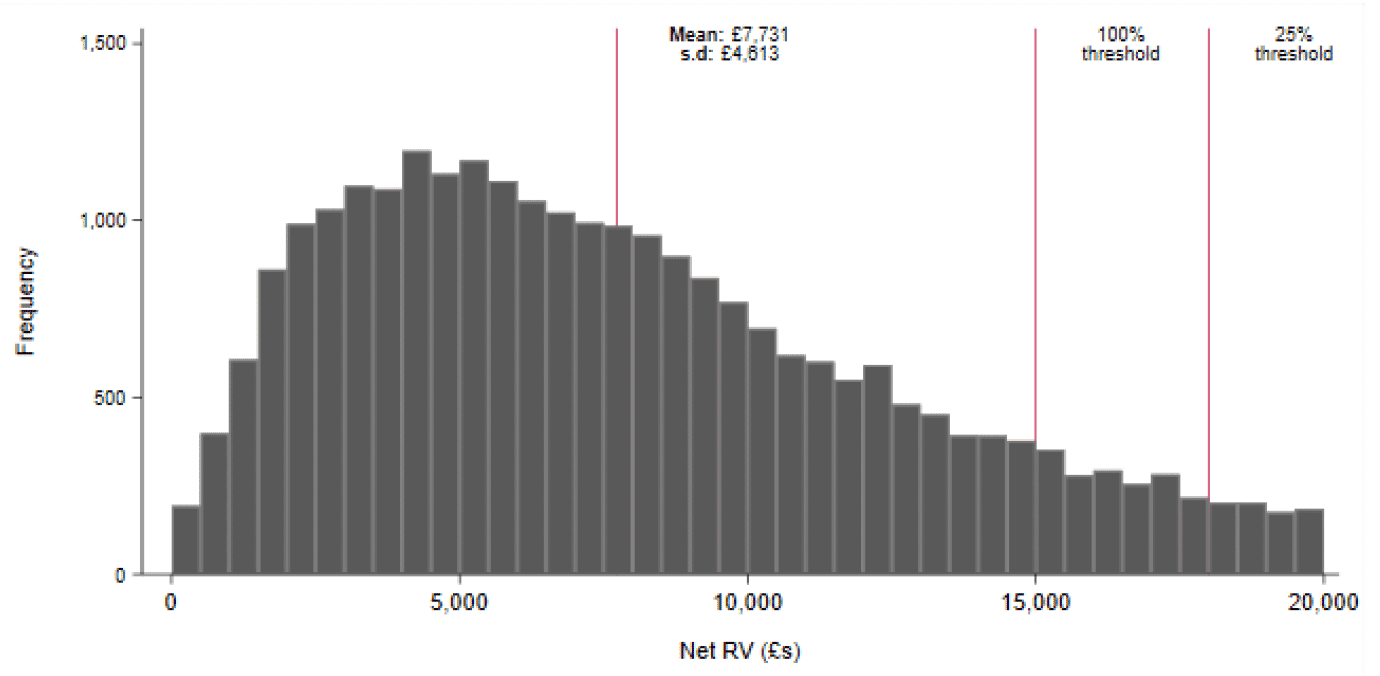
Note: Properties/enterprises are grouped into £500 RV bands. For example, the bar between 0-£500 groups all properties with a RV in the range.
| Full sample | SBBS claimers | |||
|---|---|---|---|---|
| Turnover | Employment | Turnover | Employment | |
| £1,000 | 187 | 3 | 167 | 3 |
| (201) | (4) | (152) | (4) | |
| £2,000 | 12,513 | 90 | 145 | 2 |
| (189,668) | (1,334) | (156) | (3) | |
| £3,000 | 192 | 3 | 171 | 3 |
| (587) | (13) | (200) | (4) | |
| £4,000 | 187 | 3 | 179 | 3 |
| (249) | (4) | (207) | (3) | |
| £5,000 | 865 | 13 | 199 | 4 |
| (16,164) | (256) | (331) | (25) | |
| £6,000 | 212 | 4 | 206 | 4 |
| (388) | (8) | (370) | (8) | |
| £7,000 | 232 | 4 | 229 | 4 |
| (521) | (6) | (526) | (6) | |
| £8,000 | 254 | 4 | 240 | 4 |
| (470) | (7) | (436) | (7) | |
| £9,000 | 1,528 | 24 | 1,573 | 25 |
| (38,213) | (588) | (38,990) | (600) | |
| £10,000 | 773 | 10 | 241 | 4 |
| (10,970) | (112) | (255) | (6) | |
| £11,000 | 13,235 | 9 | 13,687 | 7 |
| (308,463) | (67) | (316,884) | (52) | |
| £12,000 | 862 | 12 | 285 | 5 |
| (9,827) | (98) | (437) | (9) | |
| £13,000 | 478 | 10 | 406 | 10 |
| (2,259) | (94) | (1,997) | (98) | |
| £14,000 | 346 | 6 | 297 | 6 |
| (608) | (8) | (394) | (6) | |
| £15,000 | 324 | 6 | 309 | 5 |
| (376) | (6) | (347) | (5) | |
| £16,000 | 417 | 8 | 321 | 6 |
| (658) | (13) | (302) | (6) | |
| £17,000 | 4,280 | 57 | 1,024 | 13 |
| (37,908) | (562) | (7,080) | (82) | |
| £18,000 | 485 | 8 | 408 | 7 |
| (1,335) | (10) | (889) | (10) | |
| £19,000 | 1,372 | 29 | ||
| (7,050) | (156) | |||
| £20,000 | 790 | 90 | ||
| (2,042) | (1,334) | |||
Note: The 'Max. RV' represents the maximum RV within each band, where each band starts immediately above the maximum of that which precedes it. Numbers are means, standard deviation are in parentheses. See Appendix Table E.9 for sample sizes within each RV band.
| Full sample | SBBS claimers | |||
|---|---|---|---|---|
| Turnover | Employment | Turnover | Employment | |
| £1,000 | 146,909 | 340 | 170,104 | 325 |
| (1530304) | (2,960) | (1660396) | (3,148) | |
| £2,000 | 4,138 | 37 | 2,263 | 8 |
| (26,834) | (527) | (19,568) | (31) | |
| £3,000 | 2,458 | 20 | 2,432 | 19 |
| (34,624) | (167) | (36,512) | (176) | |
| £4,000 | 4,189 | 24 | 2,755 | 23 |
| (36,993) | (237) | (24,356) | (251) | |
| £5,000 | 4,321 | 43 | 1,991 | 26 |
| (47,114) | (468) | (19,865) | (390) | |
| £6,000 | 2,286 | 18 | 1,584 | 14 |
| (14,615) | (96) | (11,634) | (70) | |
| £7,000 | 5,115 | 18 | 2,730 | 10 |
| (34,666) | (96) | (19,394) | (37) | |
| £8,000 | 9,767 | 25 | 7,981 | 9 |
| (125,862) | (223) | (126,807) | (18) | |
| £9,000 | 3,347 | 24 | 2,167 | 20 |
| (18,524) | (98) | (10,970) | (92) | |
| £10,000 | 3,093 | 34 | 1,256 | 19 |
| (15,966) | (184) | (3,937) | (102) | |
| £11,000 | 4,975 | 32 | 1,458 | 14 |
| (44,303) | (231) | (6,641) | (65) | |
| £12,000 | 1,737 | 31 | 1,638 | 30 |
| (5,237) | (150) | (5,099) | (153) | |
| £13,000 | 3,580 | 25 | 2,776 | 20 |
| (14,294) | (74) | (13,264) | (60) | |
| £14,000 | 4,463 | 33 | 1,693 | 18 |
| (19,778) | (131) | (7,753) | (67) | |
| £15,000 | 366,567 | 66 | 2,025 | 30 |
| (4172657) | (394) | (6,478) | (115) | |
| £16,000 | 13,215 | 157 | 12,378 | 182 |
| (63,134) | (583) | (73,083) | (693) | |
| £17,000 | 10,555 | 68 | 1,978 | 21 |
| (45,611) | (196) | (5,836) | (47) | |
| £18,000 | 89,171 | 61 | 1,083 | 14 |
| (753,163) | (367) | (2,692) | (20) | |
| £19,000 | 24,654 | 79 | ||
| (147,972) | (389) | |||
| £20,000 | 28,689 | 37 | ||
| (75,290) | (527) | |||
Note: The 'Max. RV' represents the maximum RV within each band, where each band starts immediately above the maximum of that which precedes it. Numbers are means, standard deviation are in parentheses. See Appendix Table E.10 for sample sizes within each RV band.
| Full sample | SBBS claimers | |||
|---|---|---|---|---|
| Turnover | Employment | Turnover | Employment | |
| £1,000 | 729 | 6 | 224 | 3 |
| (9,432) | (53) | (364) | (10) | |
| £2,000 | 1,631 | 14 | 342 | 3 |
| (21,498) | (108) | (1,326) | (11) | |
| £3,000 | 2,627 | 18 | 557 | 5 |
| (32,182) | (170) | (3,914) | (33) | |
| £4,000 | 4,024 | 27 | 444 | 4 |
| (83,580) | (577) | (2,148) | (9) | |
| £5,000 | 713 | 10 | 485 | 6 |
| (3,994) | (96) | (1,807) | (26) | |
| £6,000 | 1,361 | 10 | 762 | 6 |
| (10,870) | (69) | (3,525) | (17) | |
| £7,000 | 1,159 | 11 | 629 | 6 |
| (6,193) | (68) | (2,626) | (15) | |
| £8,000 | 1,307 | 12 | 1,022 | 10 |
| (9,518) | (87) | (9,130) | (84) | |
| £9,000 | 1,988 | 18 | 1,886 | 16 |
| (25,373) | (196) | (25,937) | (198) | |
| £10,000 | 1,395 | 14 | 1,178 | 13 |
| (7,097) | (91) | (6,691) | (91) | |
| £11,000 | 933 | 9 | 756 | 7 |
| (1,757) | (14) | (1,208) | (9) | |
| £12,000 | 3,671 | 18 | 1,721 | 10 |
| (23,865) | (83) | (13,138) | (29) | |
| £13,000 | 6,357 | 27 | 1,063 | 9 |
| (57,402) | (213) | (3,722) | (15) | |
| £14,000 | 3,141 | 13 | 1,747 | 10 |
| (17,322) | (35) | (10,998) | (18) | |
| £15,000 | 2,501 | 18 | 1,199 | 10 |
| (11,378) | (87) | (2,847) | (16) | |
| £16,000 | 3,540 | 29 | 2,653 | 22 |
| (13,375) | (94) | (13,671) | (93) | |
| £17,000 | 4,559 | 21 | 1,371 | 12 |
| (27,438) | (88) | (2,762) | (18) | |
| £18,000 | 3,325 | 26 | 1,504 | 11 |
| (11,059) | (105) | (3,210) | (12) | |
| £19,000 | 3,389 | 21 | ||
| (15,135) | (63) | |||
| £20,000 | 10,293 | 14 | ||
| (47,058) | (108) | |||
Note: The 'Max. RV' represents the maximum RV within each band, where each band starts immediately above the maximum of that which precedes it. Numbers are means, standard deviation are in parentheses. See Appendix Table E.11 for sample sizes within each RV band.
| Full sample | SBBS claimers | |||
|---|---|---|---|---|
| Turnover | Employment | Turnover | Employment | |
| £1,000 | 27,298 | 66 | 28,865 | 57 |
| (653,964) | (1,267) | (682,026) | (1,293) | |
| £2,000 | 3,774 | 31 | 741 | 5 |
| (77,960) | (614) | (7,779) | (23) | |
| £3,000 | 1,631 | 13 | 846 | 7 |
| (26,021) | (141) | (18,757) | (90) | |
| £4,000 | 2,327 | 16 | 811 | 8 |
| (50,608) | (346) | (11,561) | (120) | |
| £5,000 | 1,140 | 17 | 638 | 10 |
| (15,701) | (280) | (9,531) | (188) | |
| £6,000 | 996 | 9 | 727 | 7 |
| (10,543) | (75) | (8,665) | (58) | |
| £7,000 | 1,129 | 8 | 869 | 6 |
| (13,043) | (54) | (11,466) | (25) | |
| £8,000 | 2,417 | 11 | 1,921 | 7 |
| (55,619) | (108) | (55,512) | (46) | |
| £9,000 | 1,010 | 11 | 898 | 9 |
| (14,552) | (115) | (14,740) | (115) | |
| £10,000 | 1,693 | 16 | 707 | 10 |
| (19,788) | (138) | (4,109) | (66) | |
| £11,000 | 7,103 | 10 | 7,265 | 7 |
| (217,024) | (54) | (225,078) | (38) | |
| £12,000 | 1,425 | 14 | 645 | 9 |
| (12,611) | (79) | (2,091) | (27) | |
| £13,000 | 2,194 | 15 | 1,067 | 10 |
| (27,518) | (130) | (9,207) | (71) | |
| £14,000 | 4,728 | 96 | 970 | 19 |
| (70,618) | (2,123) | (9,175) | (284) | |
| £15,000 | 2,833 | 16 | 2,403 | 12 |
| (39,859) | (88) | (41,794) | (74) | |
| £16,000 | 3,833 | 33 | 2,839 | 29 |
| (31,398) | (230) | (32,080) | (239) | |
| £17,000 | 96,177 | 48 | 1,172 | 12 |
| (2098491) | (418) | (6,408) | (56) | |
| £18,000 | 15,752 | 22 | 671 | 8 |
| (303,311) | (160) | (1,890) | (11) | |
| £19,000 | 4,486 | 26 | ||
| (52,650) | (164) | |||
| £20,000 | 6,268 | 31 | ||
| (35,041) | (614) | |||
Note: The 'Max. RV' represents the maximum RV within each band, where each band starts immediately above the maximum of that which precedes it. Numbers are means, standard deviation are in parentheses. See Appendix Table E.12 for sample sizes within each RV band.
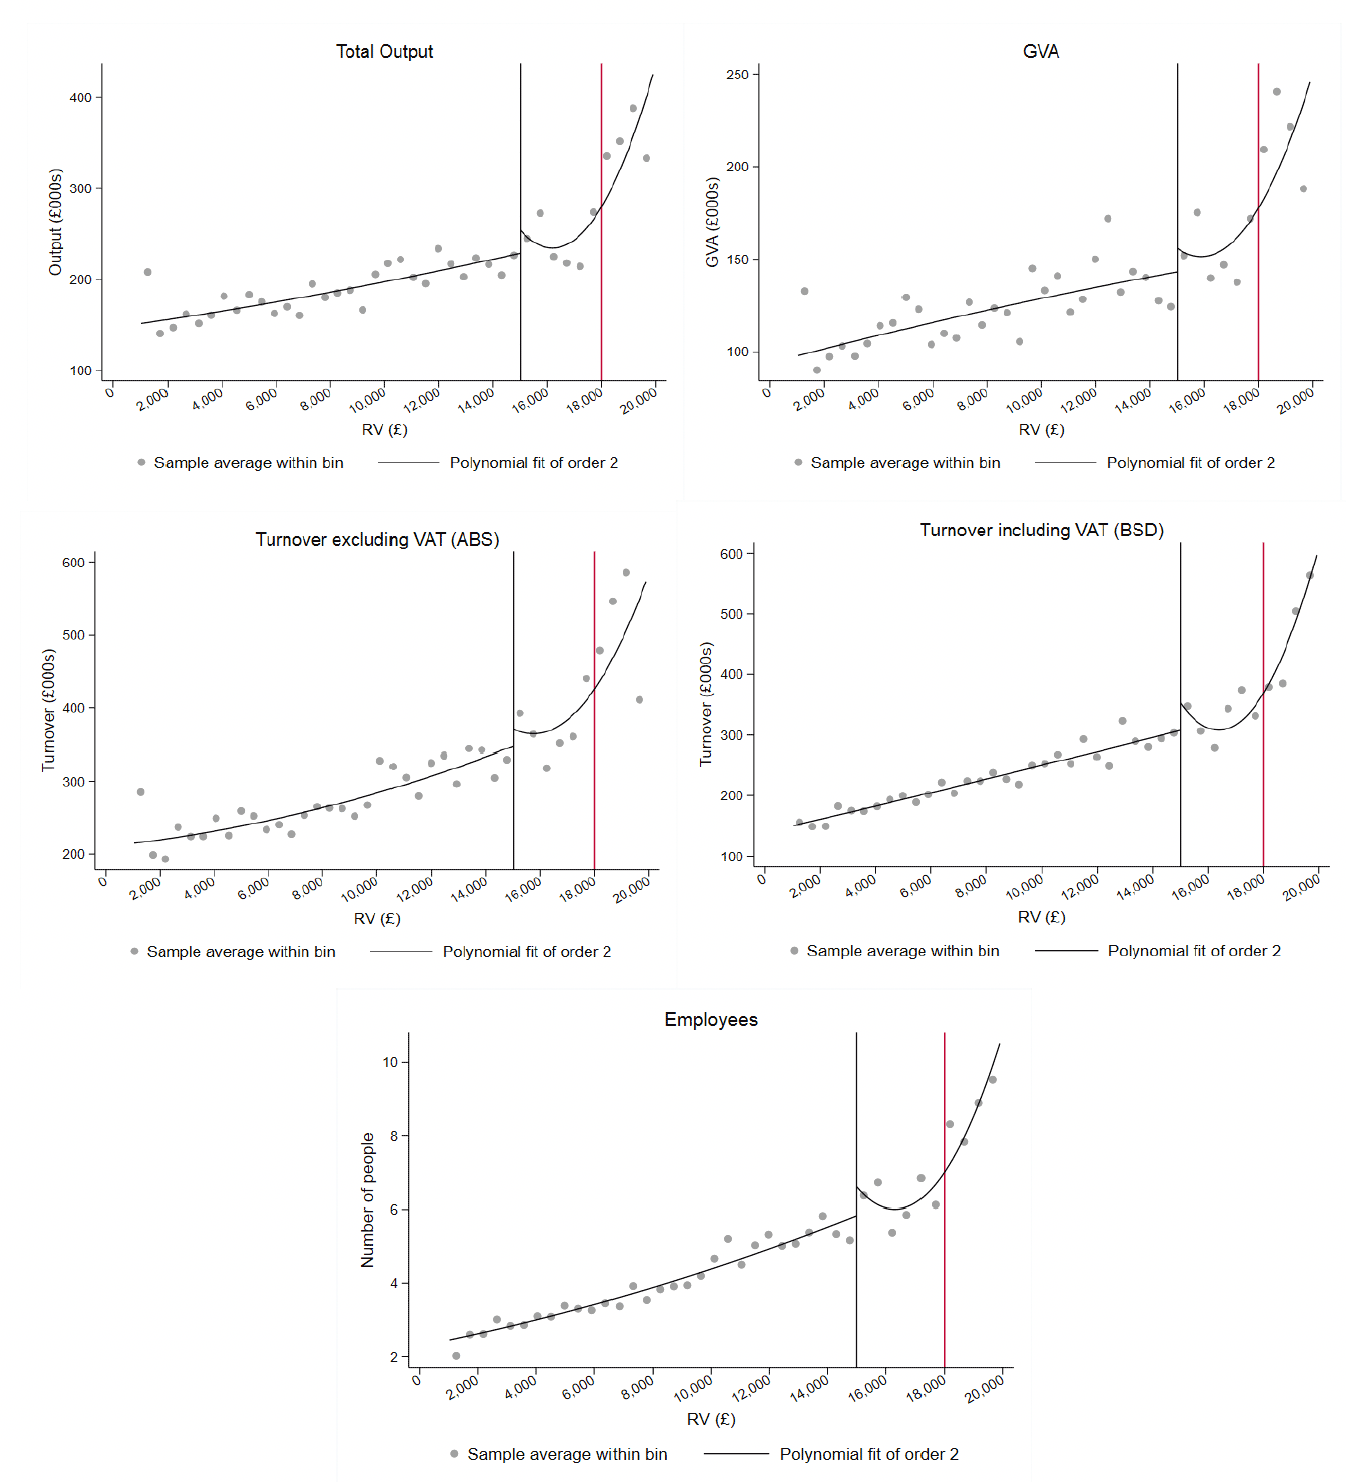
Note: Panels containing ABS turnover, total output and GVA are from the ABS and so use fewer observations. Restrictions are turnover ABS, total output, GVA and turnover BSD <£5,000,000; employees < 100. Bin size is £500. See Table E.9 for bin counts. For disclosure reasons, businesses with an RV below £1,000 are excluded due to a sample size of fewer than 10 in the £0-£500 bin.
Note: Panels containing ABS turnover, total output and GVA are from the ABS and so use fewer observations. Restrictions are turnover ABS, total output, GVA and turnover BSD <£5,000,000; employees < 100. Bin size is £500.
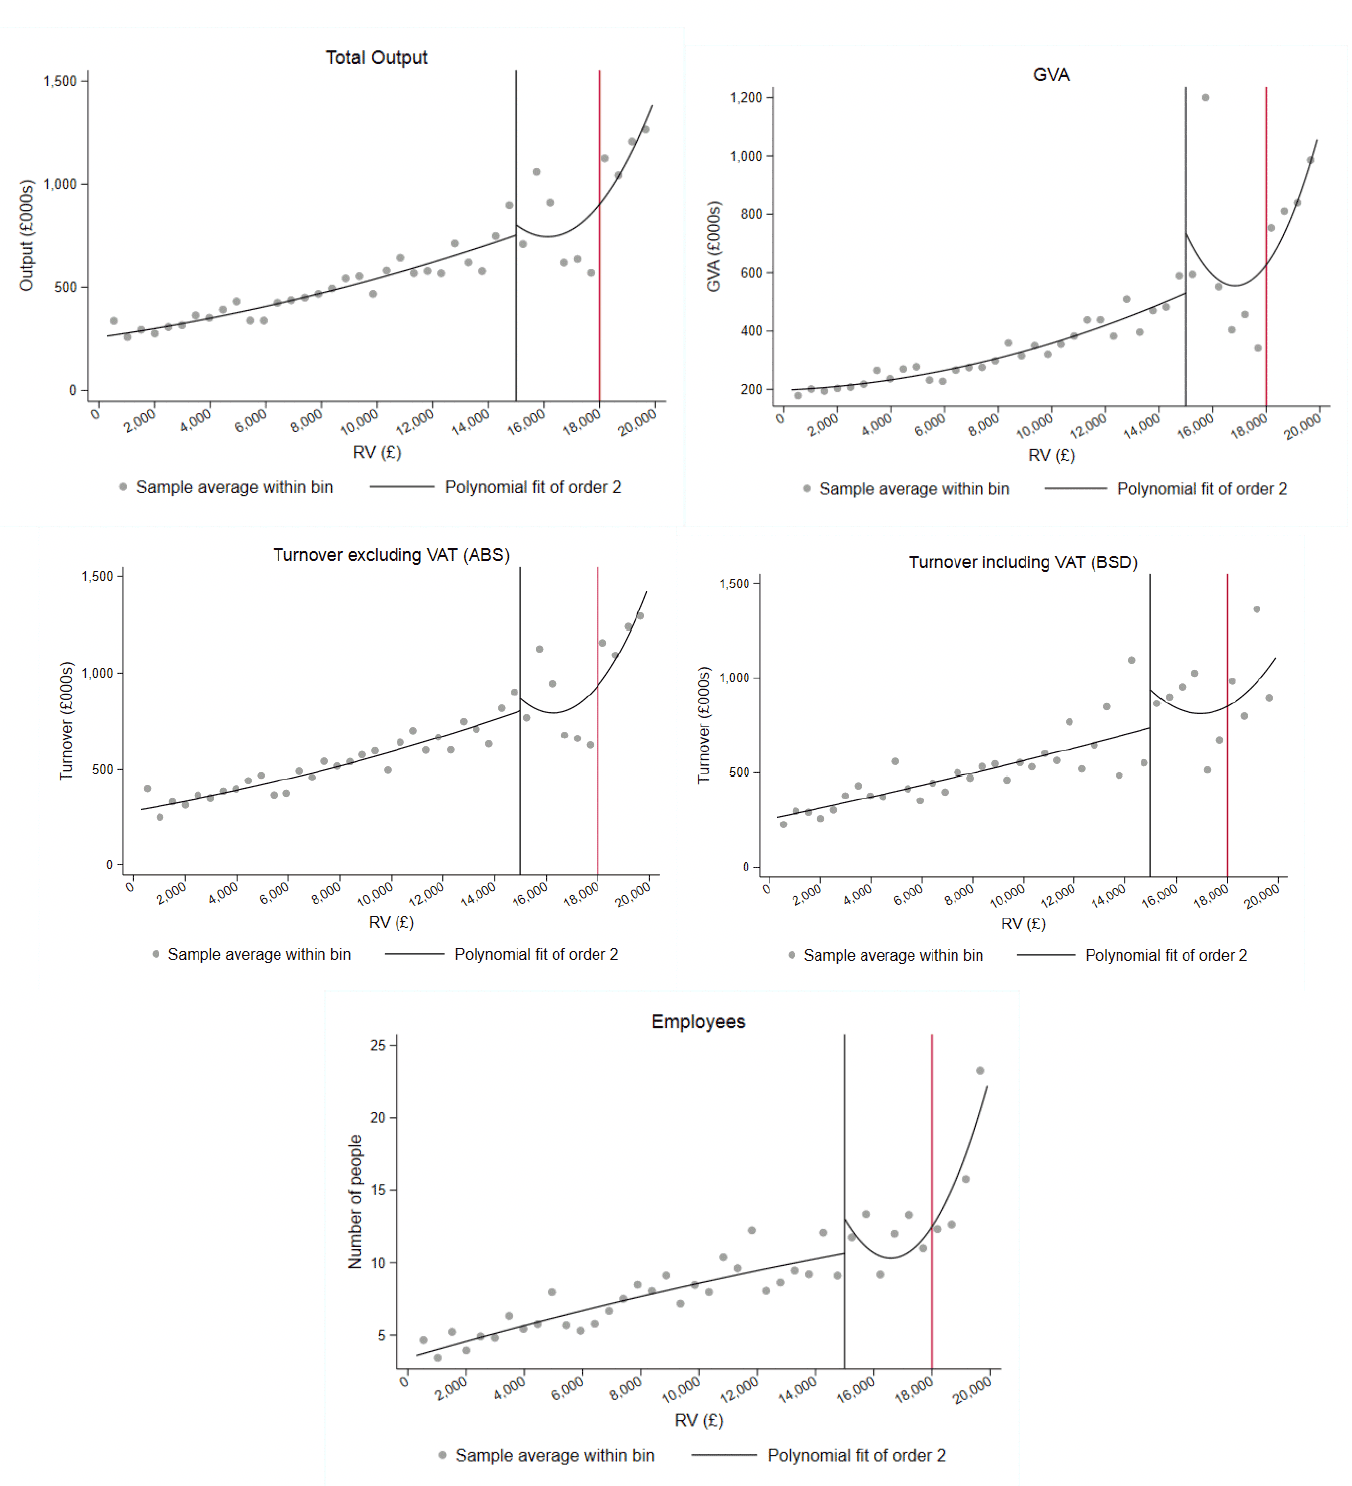
Note: Panels containing ABS turnover, total output and GVA are from the ABS and so use fewer observations. Restrictions are turnover ABS, total output, GVA and turnover BSD <£5,000,000; employees < 100. Bin size is £500.
| Local linear | Local quadratic | |||
|---|---|---|---|---|
| (1) Full claimer sample | (2) Restrictions | (3) Full claimer sample | (4) Restrictions | |
| BSD Turnover (£000s) | 45.35* (24.22) | 45.35* (24.22) | 72.62*** (15.26) | 72.62*** (15.26) |
| N | 10,103 | 10,090 | 10,103 | 10,090 |
| Effective N | 516 | 516 | 516 | 516 |
| BSD Employment | 1.49*** (0.14) | 1.49*** (0.14) | 1.88*** (0.17) | 1.88*** (0.17) |
| N | 10,103 | 10,089 | 10,103 | 10,089 |
| Effective N | 516 | 516 | 516 | 516 |
| ABS turnover (£000s) | 257.29*** (55.23) | 77.14*** (20.22) | 164.35*** (18.91) | 162.55*** (19.95) |
| N | 9,117 | 9,099 | 9,117 | 9,099 |
| Effective N | 472 | 471 | 472 | 471 |
| N | 9,117 | 9,108 | 9,117 | 9,108 |
| Effective N | 472 | 472 | 472 | 472 |
| ABS GVA (£000s) | 31.53*** (11.52) | 31.53*** (11.52) | 70.82*** (13.08) | 70.82*** (13.08) |
| N | 9,117 | 9,114 | 9,117 | 9,114 |
| Effective N | 472 | 472 | 472 | 472 |
Note: *, **, and *** indicate statistical significance at 10%, 5%, and 1% respectively. Standard errors are in parentheses. Effective N is the number of observations within £1,000 of the 100% SBBS threshold. Panels containing ABS turnover, total output and GVA automatically use fewer observations. Restrictions are turnover ABS, total output, GVA and turnover BSD <£5,000,000; employees < 100.
| Local linear | Local quadratic | |||
|---|---|---|---|---|
| (1) Full claimer sample | (2) Restrictions | (3) Full claimer sample | (4) Restrictions | |
| BSD Turnover (£000s) | 652.29 (2,548.21) | 520.93* (159.55) | -4,265.96 (3,427.42) | 885.16*** (523.12) |
| N | 4,310 | 4,138 | 4,310 | 4,138 |
| Effective N | 151 | 140 | 151 | 140 |
| BSD Employment | 5.46 (12.49) | 3.77* (0.37) | 17.90 (38.49) | 3.40* (0.29) |
| N | 4,310 | 4,217 | 4,310 | 4,217 |
| Effective N | 151 | 143 | 151 | 143 |
| ABS turnover (£000s) | 257.29* (55.23) | -116.11 (92.30) | 1,552.18* (375.40) | 129.67 (359.45) |
| N | 3,686 | 3,647 | 3,686 | 3,647 |
| Effective N | 123 | 119 | 123 | 119 |
| ABS output (£000s) | 950.72* (330.40) | -218.97** (111.13) | 1,475.93* (397.84) | 49.60 (386.05) |
| N | 3,686 | 3,652 | 3,686 | 3,652 |
| Effective N | 123 | 119 | 123 | 119 |
| ABS GVA (£000s) | 992.87* (245.97) | -71.93** (33.26) | 1,234.99* (211.35) | 37.38 (183.40) |
| N | 3,686 | 3,674 | 3,686 | 3,674 |
| Effective N | 123 | 122 | 123 | 122 |
Note: *, **, and *** indicate statistical significance at 10%, 5%, and 1% respectively. Standard errors are in parentheses. Effective N is the number of observations within £1,000 of the 100% SBBS threshold. Panels containing ABS turnover, total output and GVA automatically use fewer observations. Restrictions are turnover ABS, total output, GVA and turnover BSD <£5,000,000; employees < 100.
| Local linear | Local quadratic | |||
|---|---|---|---|---|
| (1) Full claimer sample | (2) Restrictions | (3) Full claimer sample | (4) Restrictions | |
| BSD Turnover (£000s) | 1,505.64* (357.32) | 156.30* (51.36) | 756.31 (621.36) | 161.01** (77.20) |
| N | 7,007 | 6,881 | 7,007 | 6,881 |
| Effective N | 302 | 289 | 302 | 289 |
| BSD Employment | 2.44 (2.93) | 0.50 (0.94) | -3.42 (4.72) | -2.68* (0.74) |
| N | 7,007 | 6,972 | 7,007 | 6,972 |
| Effective N | 302 | 300 | 302 | 300 |
| ABS Turnover (£000s) | 257.29* (55.23) | -85.36 (60.88) | 319.77* (77.82) | -89.30 (90.34) |
| N | 6,518 | 6,474 | 6,518 | 6,474 |
| Effective N | 284 | 278 | 284 | 278 |
| ABS Output (£000s) | -53.45 (95.08) | -93.17 (75.46) | -335.18* (31.42) | -306.58* (23.00) |
| N | 6,518 | 6,493 | 6,518 | 6,493 |
| Effective N | 284 | 281 | 284 | 281 |
| ABS GVA (£000s) | 13.33 (37.83) | 13.33 (37.83) | -100.19* (13.59) | -100.19* (13.59) |
| N | 6,518 | 6,510 | 6,518 | 6,510 |
| Effective N | 284 | 284 | 284 | 284 |
Note: *, **, and *** indicate statistical significance at 10%, 5%, and 1% respectively. Standard errors are in parentheses. Effective N is the number of observations within £1,000 of the 100% SBBS threshold. Panels containing ABS turnover, total output and GVA automatically use fewer observations. Restrictions are turnover ABS, total output, GVA and turnover BSD <£5,000,000; employees < 100.
| Local linear | Local quadratic | |||
|---|---|---|---|---|
| (1) Full claimer sample | (2) Restrictions | (3) Full claimer sample | (4) Restrictions | |
| BSD Turnover (£000s) | 217.96** (92.53) | 159.68* (32.81) | -84.36 (797.82) | 263.89* (59.35) |
| N | 19,130 | 18,898 | 19,130 | 18,898 |
| Effective N | 782 | 766 | 782 | 766 |
| BSD Employment | -5.30 (3.36) | 1.97* (0.16) | 2.09 (5.06) | 2.19* (0.60) |
| N | 19,130 | 19,014 | 19,130 | 19,014 |
| Effective N | 782 | 773 | 782 | 773 |
| ABS turnover (£000s) | 79.44** (37.39) | 109.03 (67.29) | 198.87*** (106.67) | 197.30** (89.02) |
| N | 16,656 | 16,570 | 16,656 | 16,570 |
| Effective N | 679 | 675 | 679 | 675 |
| ABS output (£000s) | 30.09 (45.57) | 44.77 (66.93) | 39.53 (108.60) | 43.41 (98.42) |
| N | 16,656 | 16,594 | 16,656 | 16,594 |
| Effective N | 679 | 675 | 679 | 675 |
| ABS GVA (£000s) | 15.77 (26.18) | 24.34 (33.53) | 19.28 (54.08) | 14.76 (52.97) |
| N | 16,656 | 16,632 | 16,656 | 16,632 |
| Effective N | 679 | 678 | 679 | 678 |
Note: *, **, and *** indicate statistical significance at 10%, 5%, and 1% respectively. Standard errors are in parentheses. Effective N is the number of observations within £1,000 of the 100% SBBS threshold. Panels containing ABS turnover, total output and GVA automatically use fewer observations. Restrictions are turnover ABS, total output, GVA and turnover BSD <£5,000,000; employees < 100.
| RV bin (£1000) | N Overall | Claimers | "Small" claimers | RV bin (£500) | N Overall | Claimers | "Small" claimers |
|---|---|---|---|---|---|---|---|
| 1000 | >30 | - | <30 | 500 | <10 | <10 | <10 |
| 2000 | 255 | 233 | 216 | 1000 | >20 | - | >20 |
| 3000 | 698 | 665 | 608 | 1500 | 72 | - | 58 |
| 4000 | 1,025 | 975 | 921 | 2000 | 183 | 169 | 158 |
| 5000 | 1,195 | 1,138 | 1,059 | 2500 | 305 | 292 | 265 |
| 6000 | 1,245 | 1,184 | 1,108 | 3000 | 393 | 373 | 343 |
| 7000 | 1,090 | 1,036 | 975 | 3500 | 470 | 451 | 432 |
| 8000 | 1,027 | 975 | 910 | 4000 | 555 | 524 | 489 |
| 9000 | 941 | 891 | 837 | 4500 | 580 | 546 | 506 |
| 10000 | 831 | 785 | 735 | 5000 | 615 | 592 | 553 |
| 11000 | 615 | 571 | 545 | 5500 | 632 | 609 | 566 |
| 12000 | 584 | 528 | 492 | 6000 | 613 | 575 | 542 |
| 13000 | 476 | 423 | 396 | 6500 | 538 | 511 | 476 |
| 14000 | 395 | 361 | 346 | 7000 | 552 | 525 | 499 |
| 15000 | 428 | 387 | 367 | 7500 | 516 | 488 | 460 |
| 16000 | 224 | 194 | 186 | 8000 | 511 | 487 | 450 |
| 17000 | 232 | 184 | 174 | 8500 | 486 | 458 | 429 |
| 18000 | 232 | 196 | 188 | 9000 | 455 | 433 | 408 |
| 19000 | >100 | >100 | 105 | 9500 | 421 | 398 | 367 |
| 20000 | >100 | >100 | 99 | 10000 | 410 | 387 | 368 |
| 10500 | 305 | 283 | 265 | ||||
| 11000 | 310 | - | 280 | ||||
| 11500 | 309 | 283 | 262 | ||||
| 12000 | 275 | 245 | 230 | ||||
| 12500 | 251 | 226 | 210 | ||||
| 13000 | 225 | 197 | 186 | ||||
| 13500 | 224 | 206 | 195 | ||||
| 14000 | 171 | - | 151 | ||||
| 14500 | 192 | - | 170 | ||||
| 15000 | 236 | 209 | 197 | ||||
| 15500 | 96 | - | 84 | ||||
| 16000 | 128 | - | 102 | ||||
| 16500 | 108 | - | 81 | ||||
| 17000 | 124 | - | 93 | ||||
| 17500 | 115 | - | 95 | ||||
| 18000 | 117 | - | 93 | ||||
| 18500 | >50 | - | >50 | ||||
| 19000 | >50 | - | >50 | ||||
| 19500 | >60 | - | >60 | ||||
| 20000 | >40 | - | >40 |
Note: "Small" businesses have a BSD turnover <£5,000,000. Redactions required due to small sample size or small difference in sample sizes.
| RV bin (£1000) | N Overall | Claimers | "Small" claimers | RV bin (£500) | N Overall | Claimers | "Small" claimers |
|---|---|---|---|---|---|---|---|
| 1000 | 118 | - | 92 | 500 | <20 | <20 | <20 |
| 2000 | 500 | 428 | 395 | 1000 | 100 | - | 82 |
| 3000 | 563 | 487 | 458 | 1500 | 212 | 184 | 169 |
| 4000 | 531 | 456 | 416 | 2000 | 288 | 244 | 226 |
| 5000 | 553 | 500 | 465 | 2500 | 281 | 248 | 233 |
| 6000 | 464 | 430 | 403 | 3000 | 282 | 239 | 225 |
| 7000 | 345 | 315 | 293 | 3500 | 285 | 240 | 217 |
| 8000 | 378 | 340 | 324 | 4000 | 246 | 216 | 199 |
| 9000 | 316 | 282 | 259 | 4500 | 271 | 246 | 234 |
| 10000 | 281 | 239 | 220 | 5000 | 282 | 254 | 231 |
| 11000 | 238 | 215 | 199 | 5500 | 229 | 211 | 196 |
| 12000 | 189 | 157 | 145 | 6000 | 235 | 219 | 207 |
| 13000 | 171 | 139 | 127 | 6500 | 184 | 165 | 155 |
| 14000 | 131 | - | 102 | 7000 | 161 | 150 | 138 |
| 15000 | 134 | - | 101 | 7500 | 195 | - | 169 |
| 16000 | 79 | - | 44 | 8000 | 183 | - | 155 |
| 17000 | 71 | - | 45 | 8500 | 150 | 136 | 126 |
| 18000 | 77 | - | 50 | 9000 | 166 | 146 | 133 |
| 19000 | >40 | - | >40 | 9500 | 141 | - | 113 |
| 20000 | 45 | - | 32 | 10000 | 140 | 118 | 107 |
| 10500 | >100 | - | >90 | ||||
| 11000 | 129 | - | 108 | ||||
| 11500 | 104 | - | 82 | ||||
| 12000 | 85 | - | 63 | ||||
| 12500 | 84 | - | 61 | ||||
| 13000 | 87 | - | 66 | ||||
| 13500 | 66 | - | 49 | ||||
| 14000 | 65 | - | 53 | ||||
| 14500 | >40 | - | >40 | ||||
| 15000 | 87 | - | 60 | ||||
| 15500 | 41 | - | 23 | ||||
| 16000 | 38 | - | 21 | ||||
| 16500 | 50 | - | 32 | ||||
| 17000 | >20 | - | >10 | ||||
| 17500 | 43 | - | 25 | ||||
| 18000 | >30 | - | >20 | ||||
| 18500 | 100 | - | 18 | ||||
| 19000 | 212 | - | 23 | ||||
| 19500 | 288 | - | 17 | ||||
| 20000 | 281 | - | 15 |
Note: "Small" businesses have a BSD turnover <£5,000,000. Redactions required due to small sample size or small difference in sample sizes.
| RV bin (£1000) | N Overall | Claimers | "Small" claimers | RV bin (£500) | N Overall | Claimers | "Small" claimers |
|---|---|---|---|---|---|---|---|
| 1000 | 435 | 379 | 367 | 500 | 173 | - | 138 |
| 2000 | 645 | 591 | 566 | 1000 | 262 | - | 229 |
| 3000 | 680 | 629 | 599 | 1500 | 302 | 277 | 263 |
| 4000 | 703 | 647 | 614 | 2000 | 343 | 314 | 303 |
| 5000 | 667 | 619 | 602 | 2500 | 331 | 304 | 293 |
| 6000 | 661 | 617 | 586 | 3000 | 349 | 325 | 306 |
| 7000 | 617 | 589 | 564 | 3500 | 356 | 329 | 316 |
| 8000 | 599 | 554 | 522 | 4000 | 347 | 318 | 298 |
| 9000 | 555 | 520 | 494 | 4500 | 312 | - | 282 |
| 10000 | 515 | 478 | 449 | 5000 | 355 | - | 320 |
| 11000 | 362 | 324 | 310 | 5500 | 328 | 309 | 295 |
| 12000 | 312 | 274 | 264 | 6000 | 333 | 308 | 291 |
| 13000 | 274 | 242 | 232 | 6500 | 312 | 295 | 282 |
| 14000 | 240 | 208 | 195 | 7000 | 305 | 294 | 282 |
| 15000 | 245 | 209 | 194 | 7500 | 304 | 278 | 265 |
| 16000 | 157 | - | 122 | 8000 | 295 | 276 | 257 |
| 17000 | 144 | - | 105 | 8500 | 298 | 285 | 273 |
| 18000 | 155 | - | 96 | 9000 | 257 | 235 | 221 |
| 19000 | 119 | - | 106 | 9500 | 245 | 223 | 209 |
| 20000 | 100 | - | 84 | 10000 | 270 | 255 | 240 |
| 10500 | 185 | 172 | 162 | ||||
| 11000 | 177 | - | 148 | ||||
| 11500 | 155 | - | 133 | ||||
| 12000 | 157 | - | 131 | ||||
| 12500 | 145 | - | 122 | ||||
| 13000 | 129 | - | 110 | ||||
| 13500 | 122 | - | 105 | ||||
| 14000 | 118 | - | 90 | ||||
| 14500 | 112 | - | 84 | ||||
| 15000 | 133 | 120 | 110 | ||||
| 15500 | 74 | - | 58 | ||||
| 16000 | 83 | - | 64 | ||||
| 16500 | 71 | - | 55 | ||||
| 17000 | 73 | - | 50 | ||||
| 17500 | 67 | - | 43 | ||||
| 18000 | 88 | - | 53 | ||||
| 18500 | 57 | - | 47 | ||||
| 19000 | >60 | - | <60 | ||||
| 19500 | >50 | - | >50 | ||||
| 20000 | >30 | - | >30 |
Note: "Small" businesses have a BSD turnover <£5,000,000. Redactions required due to small sample size or small difference in sample sizes.
| Draft RV bin (£1000) | Overall | Overall claimers | Overall "small" claimers | Constant | Constant claimers | Constant "small" claimers |
|---|---|---|---|---|---|---|
| 1000 | 642 | 583 | 559 | 579 | 526 | 504 |
| 2000 | 1,551 | 1,420 | 1,338 | 1,369 | 1,259 | 1,191 |
| 3000 | 2,063 | 1,905 | 1,799 | 1,818 | 1,680 | 1,584 |
| 4000 | 2,209 | 2,049 | 1,931 | 1,966 | 1,829 | 1,721 |
| 5000 | 2,368 | 2,210 | 2,093 | 2,093 | 1,957 | 1,852 |
| 6000 | 2,294 | 2,157 | 2,029 | 2,047 | 1,931 | 1,818 |
| 7000 | 2,015 | 1,908 | 1,805 | 1,777 | 1,687 | 1,604 |
| 8000 | 2,010 | 1,875 | 1,768 | 1,761 | 1,641 | 1,550 |
| 9000 | 1,840 | 1,712 | 1,615 | 1,585 | 1,477 | 1,394 |
| 10000 | 1,657 | 1,537 | 1,446 | 1,432 | 1,325 | 1,246 |
| 11000 | 1,229 | 1,109 | 1,060 | 1,067 | 966 | 924 |
| 12000 | 1,186 | 1,065 | 1,005 | 987 | 881 | 836 |
| 13000 | 989 | 872 | 821 | 809 | 706 | 665 |
| 14000 | 836 | 728 | 698 | 696 | 609 | 582 |
| 15000 | 763 | 656 | 620 | 607 | 523 | 495 |
| 16000 | 623 | 526 | 498 | 423 | 342 | 327 |
| 17000 | 544 | 444 | 419 | 426 | 336 | 321 |
| 18000 | 487 | 382 | 362 | 390 | 298 | 284 |
| 19000 | 372 | 351 | 333 | 258 | - | 243 |
| 20000 | 313 | >300 | 273 | 224 | - | 197 |
Note: "Small" businesses have a BSD turnover <£5,000,000. Redactions required due to small sample size or small difference in sample sizes.
Contact
Email: ndr@gov.scot