Small Business Bonus Scheme: evaluation
This report presents the results of an evaluation of the Small Business Bonus Scheme (SBBS), and provides recommendations in relation to the SBBS and non-domestic rates relief more broadly.
5. Designing and implementing a survey of businesses
Some of the objectives of the SBBS evaluation could not be met using only the VR and its derivatives, or business survey data. For example, the data on the attributes and outcomes of properties/businesses cannot be used to analyse how essential the SBBS might be to the viability of its recipients, nor can it shed light on how the money saved by small businesses in receipt of SBBS relief is otherwise used, if at all. Both of these were objectives of the evaluation.
Further, whilst it is important to build robust evidence as to the economic impact of the policy, a purely quantitative assessment of data – if it were possible – would not address other important aspects of the SBBS. For example, it would not allow us to understand the level of awareness and the perception of the policy among those it is designed to affect. Perceptions and beliefs about the SBBS are, however, of interest in evaluating the scheme's impact on businesses and business owners.
To attempt to evaluate these aspects of the SBBS, we designed a survey that would allow us to gather additional data on aspects of businesses such as their engagement with the scheme and their business activity in recent years. The survey we administered is contained in Appendix A.2.
In this section, we outline the design principles of the survey, as well as the sampling methodology we employed. We also discuss how we administered the survey and the difficulties that we faced in light of the Covid-19 pandemic. Finally, we explain both the sample that we achieved and the effective sample that we could use for evaluation, in light of partial completion of the survey and discrepancies between reported data in survey responses and data recorded in the VR and Billing Snapshot. In Section 6 we analyse the data from the survey.
5.1 Survey question design
The ultimate aim of the survey was to collect two broad types of data on:
- businesses/business owners and objective measures of their business activity; and
- subjective measures of their perceptions of the SBBS.
The former would be used as another tool with which to evaluate the economic impact of the SBBS, and the latter to shed light on the engagement and opinions of those the scheme affects currently, or could potentially affect if it were changed.
The survey was therefore designed to have two main components – one that asked questions designed to obtain objective measures of business activity; and another, which came at the end of the survey, which focused explicitly on perceptions of the SBBS.
In the business activity portion of the survey we sought to avoid two main types of question that might induce responses that were not objective.
Firstly, we were aware that leading questions were not appropriate for an evaluation of the scheme's impact. For example, we sought to avoid questions such as "How much have you benefited from SBBS?", and rather asked for information on certain activities with the aim of comparing responses across groups of businesses to see whether there were any differences.
Secondly, we did not include 'loaded' questions which assume an action. For example, we did not include questions such as "How did you spend the money you saved from SBBS?", and opted instead to ask general questions about businesses' spending over recent years. Again, we hoped to compare responses across businesses in a way that might allow us to infer whether the SBBS was impacting spending.
Whilst we wanted to avoid directly asking for opinions about the scheme or government spending and its efficacy, one aim of the survey was to ascertain how businesses valued the SBBS relative to other types of government spending. As a result, it was not possible to entirely avoid questions that mentioned the SBBS or other modes of taxation/spending explicitly. In these cases, questions were again designed not to be loaded or leading and, where possible, included indirect references.
As an example, questions designed to gather information on how important particular modes of government spending might be to businesses did not include the SBBS, but rather references to NDR – this is a small difference, but it places the SBBS among the broader category of non-domestic property reliefs as opposed to directly asking for answers about the scheme itself.
Of course, the nature of surveys means that it is not possible to ensure completely objective and accurate responses regardless of the level of design in survey questions. Nor did we assume that respondents would be unaffected by the knowledge that the survey was evaluating a scheme that directly affects their net income. The questions were constructed in this way, however, in order to minimise the many pitfalls associated with survey data.
To gain a better understanding of perceptions and beliefs about the SBBS, the second broad portion of the survey – the SBBS portion – asked direct questions about the SBBS and its perceived efficacy and impact.
Respondents were asked a series of questions, including: "Is SBBS important to town centres?" and "Does SBBS give an unfair competitive advantage to recipients?" and respondents were asked to what extent they agreed/disagreed. The survey also included a direct question on how savings from SBBS relief were spent, and free text questions for comments on the SBBS scheme.
This portion of the survey allowed us to gain insight in to the beliefs and perceptions of the scheme and compare them across businesses.
Appendix A.2 and A.1 include the full final survey that was sent to businesses, as well as the accompanying cover letter respectively. This final survey and its questions were designed based on two pilot surveys. This enabled us to gain feedback on which aspects of the initial survey should be redesigned in order to maximize the likelihood that business owners would respond and also be able to answer questions quickly and accurately.
5.2 Survey sample design
The aim of the survey was to gather information that would be as representative of the small business base in Scotland as possible, whilst also ensuring it covered businesses with a variety of experiences with the SBBS. Alongside maximising the response rate, the sample design was developed with this aim in mind.
The first step in doing so was to determine the source we would use to select businesses to which we would send the survey. The VR and PTOA database (described in Section 3) provide a list of the type, value and location of every rated non-domestic property in Scotland as well as address information of their proprietors, tenants, and/or occupiers.[26] Since we set out to design a survey that would obtain information that was as representative of the small business base in Scotland as possible, these two databases provided an ideal starting point in terms of coverage.
There are, however, several drawbacks to using the VR and PTOA data as the basis for a survey sample. As we documented in Section 3, this dataset contains information on properties and not businesses; notwithstanding the issues associated with identifying businesses from the data that we outlined in Section 3, the VR and PTOA data were used to construct the database of businesses from which we would sample as these were the only sources of information available to us. Moreover, the database does not reliably detail business owners (or indeed their contact details). This meant we had to rely on sending paper surveys to addresses from the databases as opposed to sending a link for an online survey to a mailing list – something that we could have constructed if accurate business names were included in the data. However, we did try a "push to web" approach – providing a link and Quick Response (QR) code in the letter for participants to complete an (identical) online version of the survey.
Unfortunately, this meant that we were able to send the survey to fewer businesses than we otherwise would have (due to postage costs). It also risked a lower response rate based on our experience of higher rates of response to online versus paper surveys. In spite of this, because using the VR and PTOA dataset offered the best opportunity to achieve a representative sampling frame, we opted to construct a survey sample based on the information in these databases as opposed to promoting and sending it out through membership organisations and existing mailing lists.
We then defined our sampling frame – the businesses from which we would choose a sample – by placing certain qualifying criteria on properties. We first excluded all non-domestic properties that were public buildings, and those from which we would be unlikely to receive a response. For example, we did not include properties listed as ATM sites, community centres or lighthouses. These two restrictions excluded 45,387 of the 255,823 non-domestic properties in the VR – 24,361 were public buildings and a further 21,026 were property types that were deemed unlikely to respond. The choice to make exclusions in this way was primarily based on the fact that we would eventually be relying on contacting business owners using the physical addresses of the properties the Scottish Government estimated them to be operating within. Appendix Table A.1 gives a full list of the types of businesses excluded/included on this basis, and we discuss address selection in the next section.
We further imposed a £3,000 restriction on the minimum RV of properties that would be included in the sampling frame. This restriction was imposed after piloting the survey, when we concluded that there is a large number of low RV properties to which the paper survey could not be delivered, and excluded a further 67,429 properties. An example of non-domestic properties that this additional restriction excluded were car spaces – we did not want to exclude all non-domestic properties defined as car spaces from the survey given that some of these might be business entities themselves, however we did not wish to send surveys to a car space or its proprietor, tenant, or occupier if it was a single space used, for example, to park outside an office. This highlights the trade-off in defining a sampling frame – maximising the likelihood of sending the survey to a genuine business increasing and therefore receiving a response, whilst not excluding businesses that we want to be represented in the survey. Appendix Figure A.1 shows how changing the minimum RV for inclusion in the survey in £500 increments affects the number of properties excluded from the sampling frame.
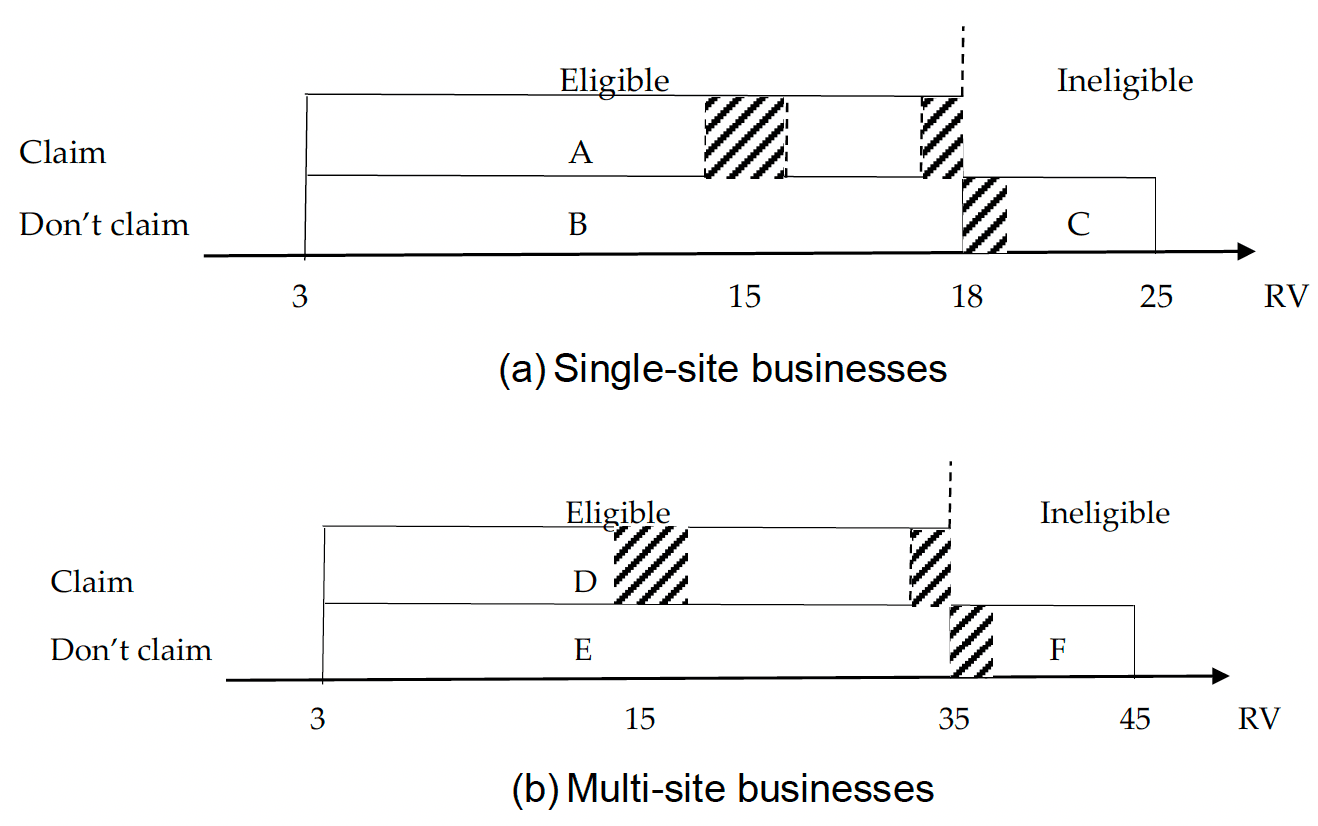
Of the remaining properties, for single-site businesses, we chose to only consider those with an RV of at most £25,000, and for multi-site businesses those with a maximum total RV across all properties of £45,000. This ensured that the sampling frame would include businesses eligible for the SBBS, as well as those that are not, but are not too dissimilar in terms of how eligibility for SBBS relief is determined. Within these ranges, we then used the three mutually exclusive groups of businesses similar to those we described in Section 4 to define sub-populations from which to sample:
1. those that were eligible for SBBS relief and claimed: eligible claimers;
2. those that were eligible for SBBS relief and did not claim: eligible non-claimers; and
3. businesses that were ineligible.
Unlike the group of eligible non-claimers covered in Section 4, the group of eligible non-claimers that we define here includes those claiming both other NDR reliefs and no support. The ineligible group may claim no or some other form of NDR relief. Figure 5.1 illustrates these groups, with 1, 2, and 3 above labelled as A, B, and C for single-site businesses and D, E, and F for multi-site businesses.
The shaded areas in Figure 5.1 define RV ranges around the policy thresholds that were of particular interest. The reason businesses with RVs in these ranges were highlighted in this way was outlined in Section 4, and centres on their comparability. In short, responses from single-site businesses with an RV just below £15,000 can, in theory, be compared with those from businesses with an RV just above £15,000 to analyse the impact of having 100% SBBS relief as opposed to 25%. Given these businesses (contained in the first shaded area in group A in Figure 5.1) are so similar in terms of RV, it might be reasonable to assume they are, on average, not so different in other important ways. The same logic applies to the comparison of businesses just below and above the higher eligibility threshold. Given our descriptive analysis regarding the diversity of property types and bunching around the policy thresholds in Section 4 (and in our later econometric analysis in Section 7), however, we had no expectations that such a comparison using our survey responses would provide robust conclusions. Nonetheless, we defined our sampling strategy in this way in order to allow us to in some way evaluate this assumption and, where possible, make such comparisons.
The resulting sampling frames comprised of 66,234 single-site and 12,281 multi-site businesses. We then devised a method for choosing businesses to which surveys would be sent from these sampling frames and sub-groups (A-F) based on their RV. The SBBS is defined based on RV and no other aspect of a business, so we based our sampling strategy – the method by which we selected business from the sampling frame – mainly on the same feature.
This involved selecting a sample that was representative of the spread of business RVs within the sampling frames – for example, if businesses operating in properties with an RV between £5,000 and £6,000 were the largest group within the sampling frame, then we would aim to have them also be the largest group among the survey recipients. However, we also oversampled in the RV ranges of interest (the shaded areas in Figure 5.1) in the hope that a larger number of responses would be achieved within them so that we could undertake meaningful statistical comparisons. Table 5.1 documents the number and proportion of businesses sampled within certain RV ranges in the single and multi-site sampling frames.
The choice to sample based only on RV was also made due to limitations on the size of the sample that could be selected – based on costs, the maximum number of surveys that could be sent out was around 6,800 and, based on previous experience with business surveys, we expected a maximum response rate of 20%.
| Single-site | ||||||
|---|---|---|---|---|---|---|
| RV band (£) | Eligible claimers | Eligible non-claimers | Ineligible | Total | Sample weight | Population weight |
| 0-14,000 | 1,504 | 293 | 1,797 | 26.3% | 70.8% | |
| 14,000-15,000 | 754 | 246 | 1,000 | 14.6% | 3.0% | |
| 15,001-16,000 | 569 | 431 | 1,000 | 14.6% | 1.4% | |
| 16,001-17,000 | 21 | 17 | 38 | 0.6% | 1.5% | |
| 17,001-18,000 | 560 | 440 | 1,000 | 14.6% | 1.6% | |
| 18,001-19,000 | 748 | 748 | 10.9% | 1.0% | ||
| 19,001-25,000 | 129 | 129 | 1.9% | 5.1% | ||
| Total | 3,409 | 1,426 | 877 | 5,712 | 83.6% | 84.3% |
| Sample weight | 50.0% | 21.0% | 13.0% | 84.0% | ||
| Population weight | 64.0% | 14.0% | 6.0% | 84.0% | ||
| Multi-site | ||||||
| RV band (£) | Eligible claimers | Eligible non-claimers | Ineligible | Total | Sample weight | Population weight |
| 0-14,000 | 165 | 38 | 208 | 3.0% | 8.0% | |
| 14,000-15,000 | 280 | 95 | 375 | 5.5% | 0.6% | |
| 15,001-16,000 | 267 | 108 | 375 | 5.5% | 0.4% | |
| 16,001-45,000 | 69 | 63 | 36 | 169 | 2.5% | 6.6% |
| Total | 782 | 304 | 36 | 1,121 | 16.4% | |
| Sample weight | 11.0% | 4.0% | 1.0% | 16.4% | ||
| Population weight | 10.0% | 4.0% | 1.0% | 15.7% | ||
If we were able to send surveys to, for example, 20,000 businesses and expect an 80% response rate, we might have sampled according to RV and property type in order to achieve a sample that was representative in terms of RV and type of business. This was not feasible, however, and so we focused on sampling businesses based on the defining feature of the SBBS.
In practical terms, businesses were placed in order of RV and assigned to £1,000 RV bands, from which the appropriate number – shown in Table 5.1 for each group – was randomly selected. The resulting sample was made up of a total of 6,833 businesses – 5,712 single-sites and 1,121 multi-sites. There were far more single-sites than multi-sites in the eventual sample because of the relatively low number of multi-site businesses compared to single-sites in the sampling frame (12,281 compared to 66,234 single-site businesses).
5.3 Address selection
The survey was designed with the intention of evaluating the effect of the SBBS support on businesses, not properties. As outlined in Section 3, the VR and PTOA dataset contain property-level information. Although some work had been undertaken to identify and group properties into businesses, the address information recorded was not necessarily that where the operator of the business, and to whom we wanted to send the survey, could be contacted.
The VR contains the physical address of each non-domestic property. The PTOA data then records the address of its proprietor and, where necessary, its tenant and occupier. If the same person owns a property and the business operating from it then, in theory, proprietor, occupier and tenant are the same entity. If a business operates from a rented property then this is not the case.
In order to administer surveys, we were required to derive business addresses from this information – the address at which we were most likely to reach the individual that has most knowledge of the business and its interaction with the SBBS. For businesses considered to be single-site, we used the physical address of the non-domestic property from which they operate. If this address was largely missing or did not have a postcode, we used the address of the proprietor, tenant or occupier based on Scottish Government estimates of which of the three was running the business from the property.
Arriving at a business address for multi-site businesses was less straightforward, as there is no concrete way in which to choose a primary business address from those listed across the different properties that are grouped into a multi-site business. Even excluding property types such as parking spaces or workshops, it is not necessarily the case that simply choosing one of a business's physical addresses will mean that the survey arrives at a "head office" – what we will refer to as the central address.
A way around this problem is to use the address of the proprietor, tenant, or occupier on properties. This is simple if a business owner is the proprietor or tenant of all the properties in which they operate. In practice, we found that many multi-site businesses owned one or none (indicated by being the proprietor) of their properties and were the tenant or occupier of others. This is in keeping with what we might expect since it is plausible, for example, that a business might own a shop and rent an office at the same time. We therefore used the following four steps to select business addresses:
1. for each property we selected the address of the proprietor, tenant or occupier based on our estimation of which was operating a business within it;
2. address duplicates were counted within businesses;
3. where one address was more common than any other it was selected as the business address; and
4. where two or more addresses were equally common across properties, one was randomly selected as the business address.
Any method of selecting addresses from the data is of course likely to result in errors, however it was decided that this approach was less likely to select inappropriate addresses than the feasible alternatives. For example, we considered using the address of the proprietor, which would assume that ownership implied that a property was the central address of the business. It is conceivable, however, that many small businesses might be more likely to own smaller, non-central properties of which many – such as storage units or car parking spaces – would be excluded by the £3,000 lower bound on RV that we used for the sampling frame.
We also considered selecting only certain types of property within a business, however restrictions of this type would have to be imposed alongside other business information – it did not make sense to only consider offices or shops within properties since there are many cases in which one or the other might be more appropriate depending on the type of business. These types of blanket exclusions would also be unhelpful for businesses comprised of only shops or offices.
5.4 Launching the survey and Covid-19
As noted above, before launching the main survey we administered two pilots to sub-samples of our sampling frame, the first of which took place in October 2019. We subsequently launched a second pilot to test changes that were made to the first pilot. In order not to coincide with the UK General Election held in December 2019 or the Christmas holiday period, this second pilot was sent out on 16 January 2020. Recipients were given two weeks to respond.
The full survey was then launched at the beginning of March 2020, with questionnaires being sent to businesses in three waves, on the 6, 9, and 10 March. At the point of the survey launch, although the threat of Covid-19 was beginning to emerge, it was not clear how profound the impact of the outbreak on business activity would be, including the subsequent lockdown. The closing date of the survey was 31 March.
By mid-March however, it was clear that small businesses were to be greatly affected by the large-scale economic shutdown that was imposed in response to the pandemic, and that this would affect survey responses and response rates in two key ways.
First, businesses might complete the survey from the perspective of their current business position as opposed to that which represented their standing pre-pandemic. Second, given much of the pandemic-related government support offered to small businesses was tied to SBBS eligibility, awareness of the scheme might have resulted in different rates of response than otherwise would have been achieved, or differences in the responses themselves. These were important differences given that the purpose of this evaluation was to understand businesses' experiences of the SBBS before the Covid-19 pandemic.[27]
We therefore define four key dates before/after which we might expect to see differences in response rates or responses themselves:
1. 11 March: the Chancellor's budget speech in which he announced business rates holidays for small businesses in England.
2. 12 March: the First Minister first announces that mass-gatherings might have to be cancelled within the week.
3. 17 March: the Chancellor announces an additional £330 billion of funding for small businesses, including further exemptions from NDR and new small business grants.
4. 23 March: the Prime Minister announces the start of a UK-wide lockdown, closing all non-essential businesses and restricting outdoor activity and social contact.
Across these announcements, the effect of the pandemic on businesses was central, and the role of NDR in business survival was prominent. As a result, businesses that might otherwise not have returned the survey may have been incentivised to do so, and those that might otherwise have returned the survey may have been unable to do so. Similarly, those returning surveys may have had an increased desire to report the importance of SBBS relief as well as other forms of rates relief.
We cannot know what response rates or responses would have been if the pandemic had not occurred, however, where necessary, we examine patterns in responses across these key dates to understand whether they provide evidence one way or the other.
5.5 The achieved sample and the timing of responses
Of the 441 responses, 179 were on paper and 262 were filled out electronically. This translates to a response rate of 6.5%, roughly what we came to expect given the results of the two pilot surveys, but well below the 20% response rate of the established regular business survey that the Fraser of Allander Institute administers.
Table 5.2 details the number of responses received before each key date. It shows that about one third of the responses came before the Chancellor's budget speech on the 11 March which thrust NDR into the public eye. By the next day, when the First Minister of Scotland announced that mass gatherings of over 500 people would be banned, there were a further 22 responses, and by the 17 March when the Chancellor announced a further £330 billion of support for small businesses there were an additional 84 responses.
| Number of responses on or before | |
|---|---|
| Pre-UK budget, 11 March 2020 | 122 |
| Pre-banning of mass gatherings, 12 March 2020 | 144 |
| Pre-Chancellor's announcement, 17 March 2020 | 228 |
| Pre-lockdown announcement, 23 March 2020 | 281 |
| University access, 10 September 2020 | 370 |
By the date the Prime Minister announced that the UK would move into full lockdown, around two-thirds of the eventual total responses had been returned. Subsequently we also received 71 additional paper responses which were received at some point after the lockdown had started (we were unable to access the University from 20 March to 10 September, so could only access these paper returns on this date).
Table 5.3 shows how responses were distributed across the three categories of eligible claimers, eligible non-claimers and ineligible for single (A-C respectively) and multi-site (D-F respectively) businesses (recall Figure 5.1 that details these groups). The largest group of respondents was single-site eligible claimers. This is perhaps unsurprising given this group's prevalence in the population of businesses from which we sampled, however they were also the most likely to respond than other categories of single-sites as shown by the last column of Table 5.3.
Overall, the broad pattern of responses by category is similar across key dates. The same is true when looking at responses by industry, age, or number of employees, shown in Appendix Tables C.3-C.5 respectively.
| Pre-UK budget | Pre-ban of mass gatherings | Pre-Chancellor's announcement | Pre-lockdown announcement | Post Uni. access | Overall | Response rate (%) | |
|---|---|---|---|---|---|---|---|
| A | 109 | 117 | 159 | 177 | 41 | 261 | 7.66 |
| B | 10 | 13 | 24 | 29 | 13 | 56 | 3.93 |
| C | 2 | 6 | 16 | 27 | 4 | 43 | 4.90 |
| D | 0 | 6 | 23 | 38 | 12 | 69 | 8.82 |
| E | 1 | 1 | 5 | 8 | 0 | 9 | 2.96 |
| F | 0 | 1 | 1 | 1 | 1 | 4 | 11.11 |
Although it is difficult to know with any certainty, the relatively even distribution of respondents across key dates perhaps suggests that Covid-19-related announcements did not induce responses differently across business categories. This is also evidenced by the fact the achieved response rate was roughly what we came to expect following the two pilots.
This does not mean that answers themselves were not affected, however, and we have very little power to test whether this is the case given the achieved sample is relatively small. Rather than exclude responses from our analysis based on whether they were received after a key date, we undertook some analysis of how certain components of our analysis differ across them. This allowed us to identify the extent to which – if at all – developments in the early stages of the pandemic influenced business responses to the survey.
5.6 Characteristics of the survey respondents
As outlined above, we received 441 survey responses, translating to a response rate of 6.5%. This limits the survey analysis in two ways. First, it limits the extent to which we can compare responses across sub-groups of respondents, for example by RV, claim status, region, or some combination of these. Second, the non-response is not random, and so our sample is not representative – a pre-requisite for inferring features of the population from a sample, and the goal of our sampling strategy (outlined in Section 5.2).
In order to assess the extent to which the achieved sample was or was not representative, part of the survey sought basic information on the industry that businesses primarily operate in, as well as the age of the business, its turnover and employment. We could also understand the geographical spread of the presumed central address of businesses.
For the entire sample, Figure 5.2a shows that responses were dominated by businesses in the service industries – the largest number of responses were in "other services" (a broad category encompassing, e.g. Cultural, Entertainment, Sports, Repairs to Personal Items, and Personal Services), accommodation and food services, and business services. There was also a significant number of respondents from businesses in the wholesale and retail sector. Panel b of the figure shows that the vast majority of responses were from established business that have been operating for at least 10 years. This was true irrespective of whether or not responses fall before or after one of our key dates, and was broadly similar across the business categories from which we sampled (A-F, shown in Appendix Figure C.3).
Figure 5.3 plots the distribution of returned surveys across local authorities, ordered by their overall non-domestic property population. Given that we do not have the appropriate data, it is not possible to check how the achieved sample compares to the population of businesses in terms of age and industry, or with respect to their turnover and employment (described below). We can check the extent to which this geographical spread of responses compares to the geographical spread of non-domestic properties. If responses were in proportion to the population shares of properties, we would expect the bars in Figure 5.3 to steadily decrease in size from left to right.[28] Although there is slight evidence of such a decline, it appears that businesses from Glasgow City were less likely to respond than their population share of properties might suggest, and that those from Aberdeenshire and Aberdeen City were more likely to do so.
There is at least one response from each local authority area, however by far the largest number of responses was from the City of Edinburgh and Highland, with 52 and 51 respectively. Glasgow City was the next most represented local authority area, however the drop-off in number of responses is large – there are 20 fewer responses than from the City of Edinburgh. As we alluded to above, this has implications for our ability to disaggregate results by local authority, and the extent to which any analysis that we conduct is representative of businesses' interaction with the SBBS across Scotland's distinct regions.
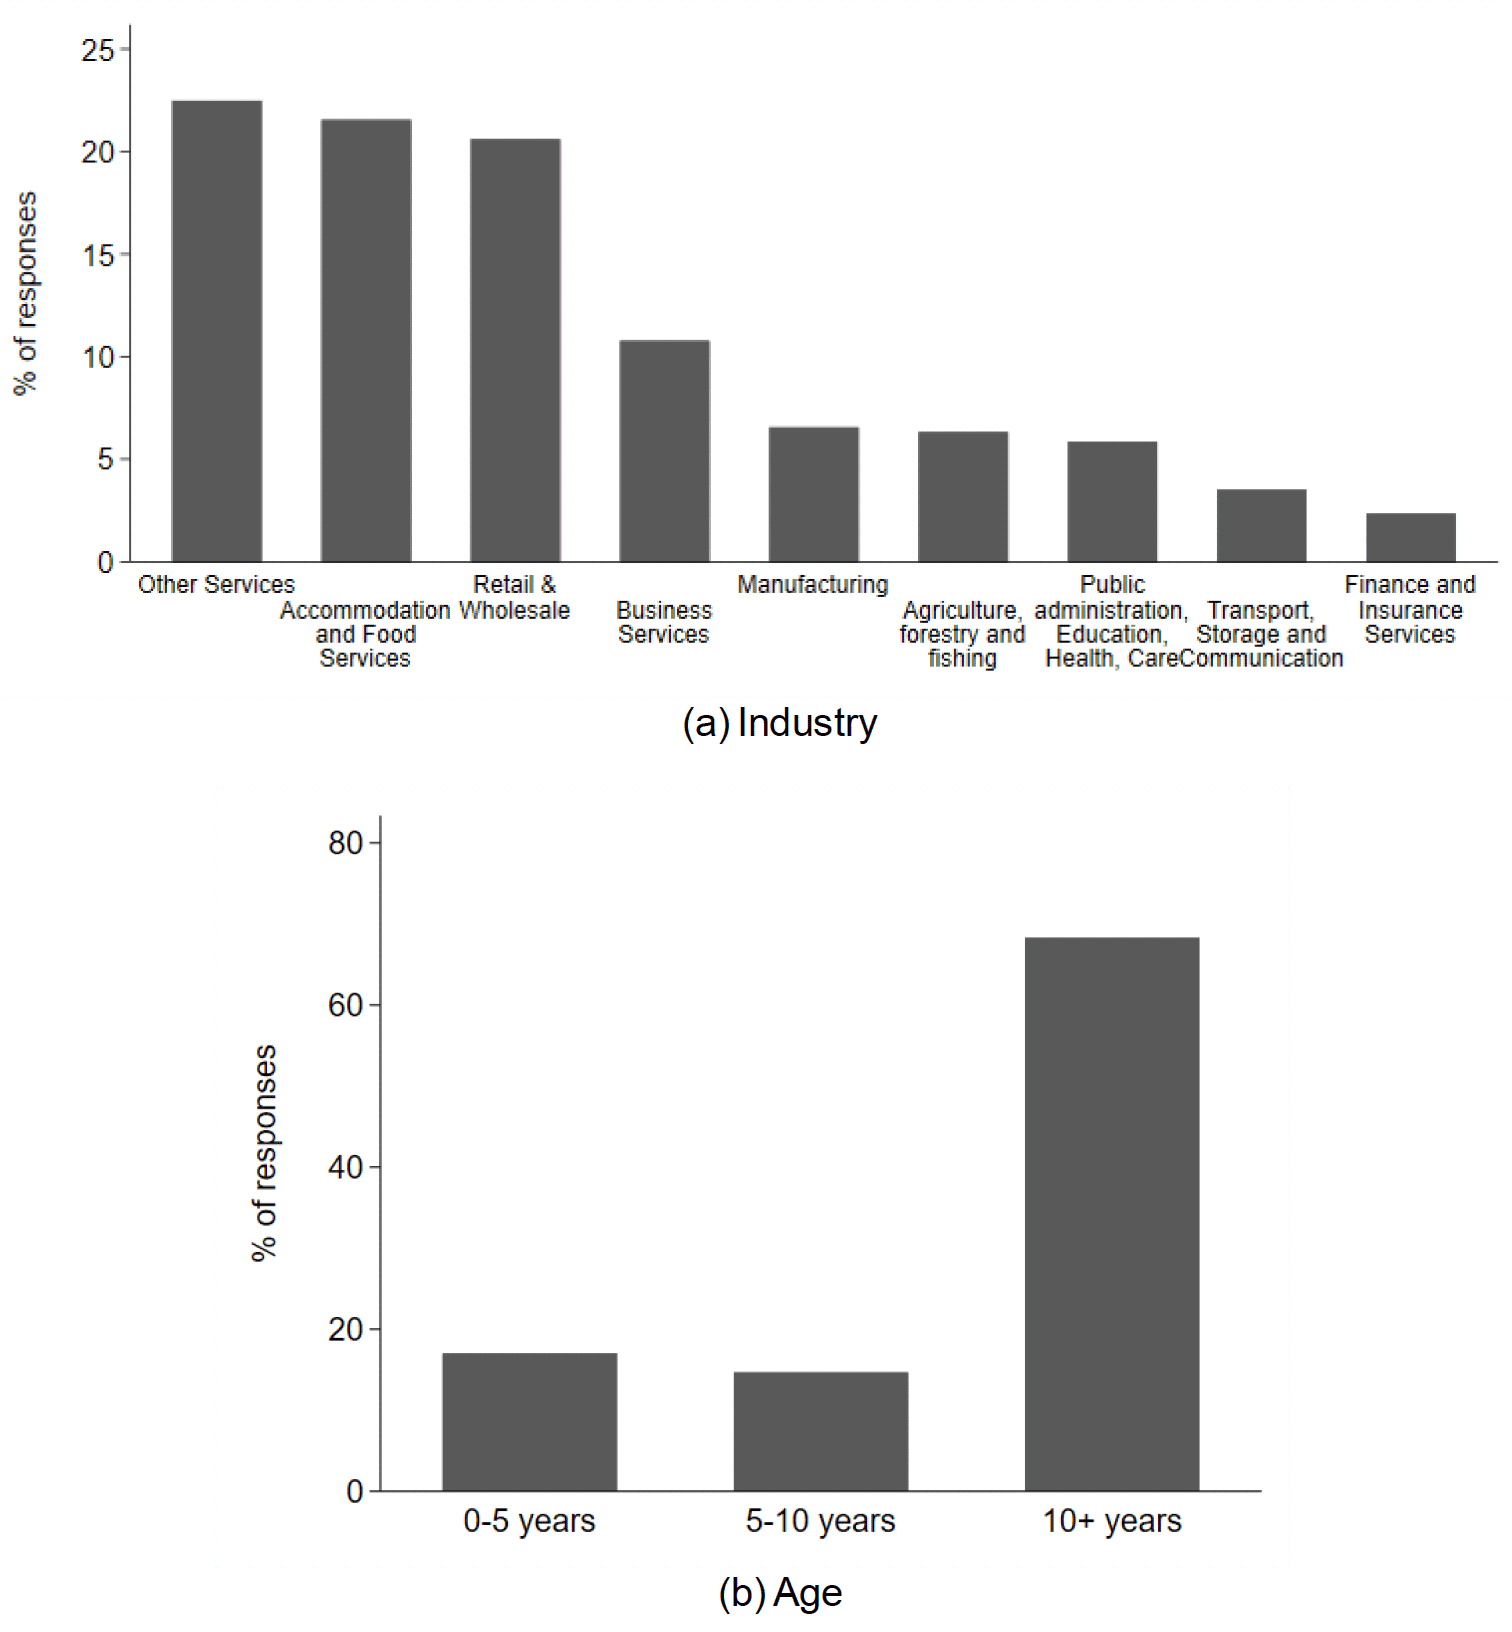
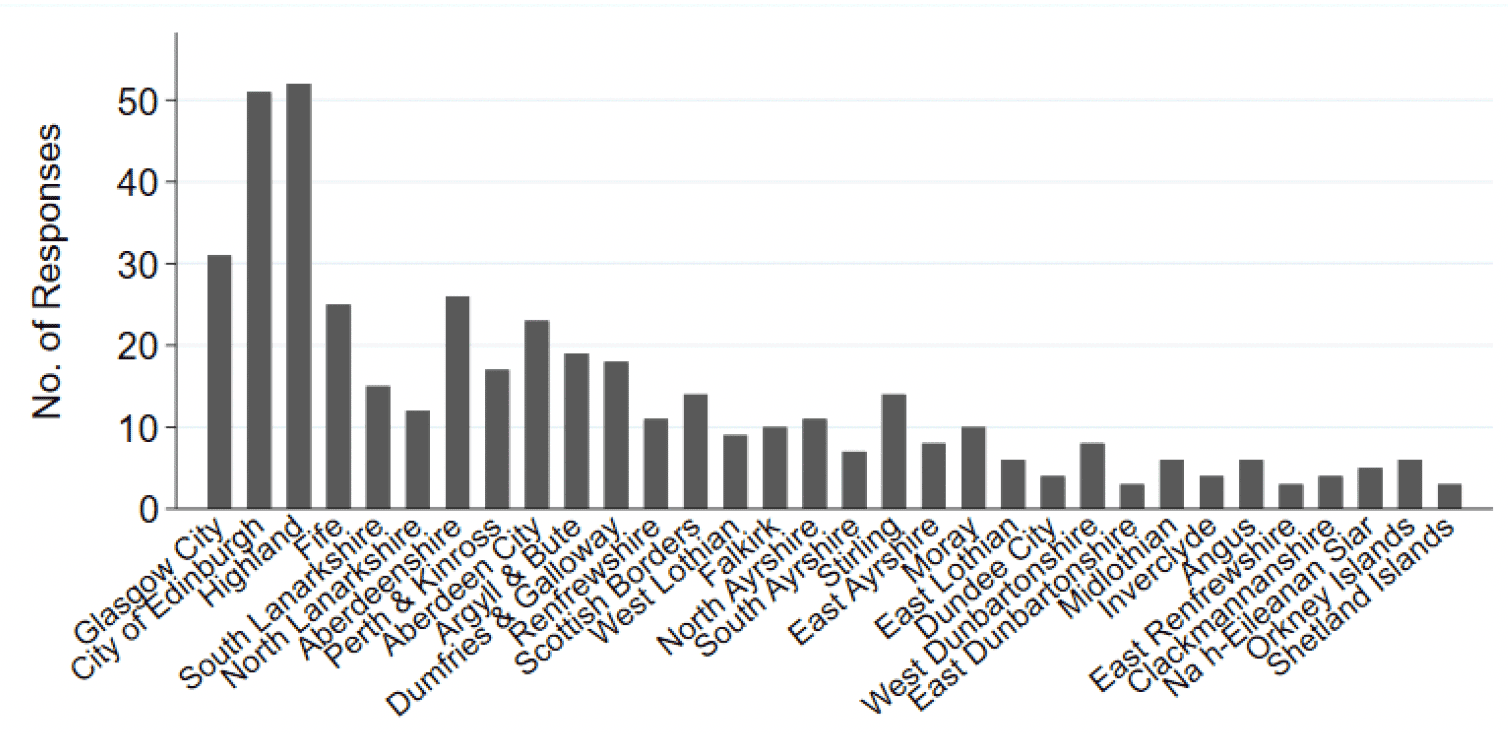
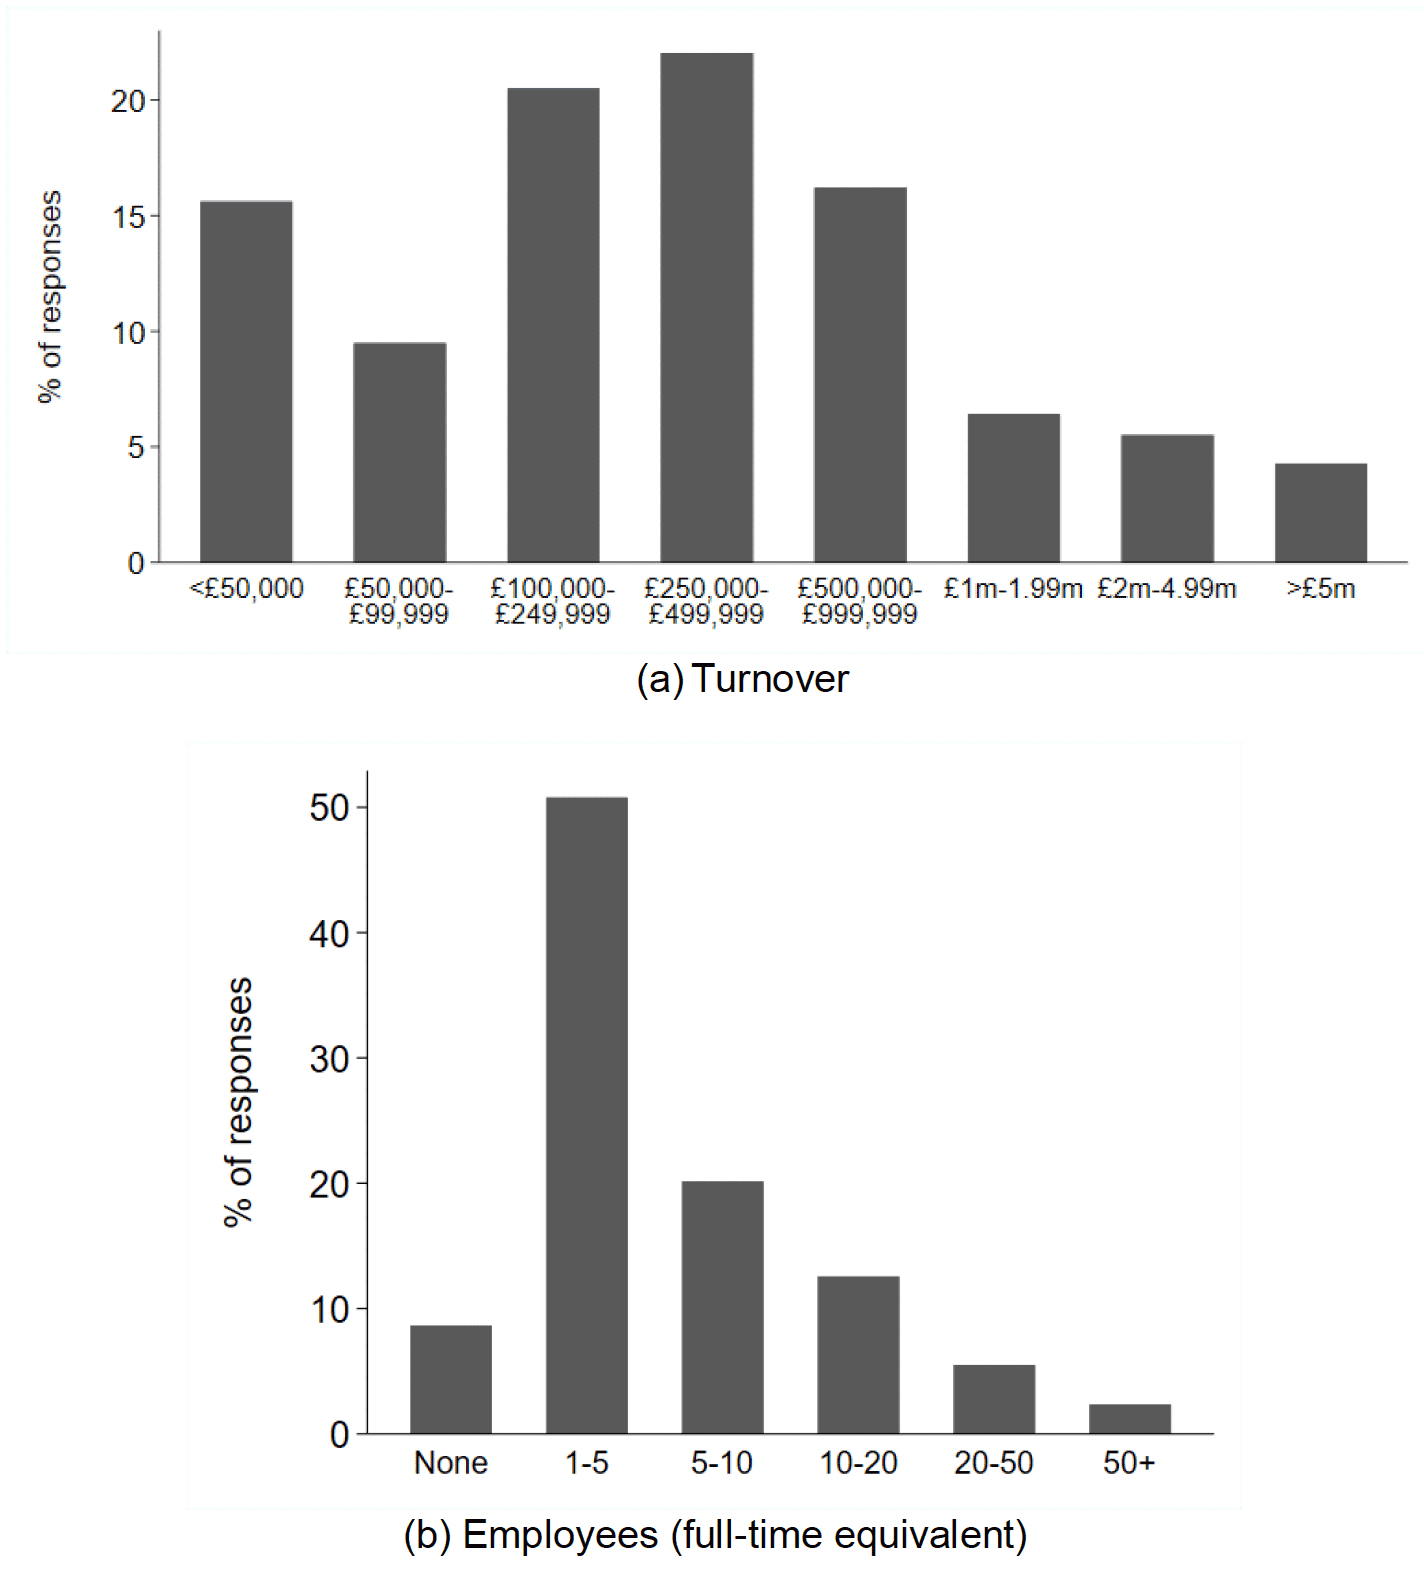
Figure 5.4 then shows the breakdown of respondents by their reported latest turnover and Full-Time Equivalent (FTE) employment.[29] Respondents most commonly recorded turnover of either less than £50,000 or between £100,000 and £1,000,000. It also shows in panel (b) that they were most likely to be small businesses in employment terms, with between 0-5 employees. Again, this was similar considering responses across key dates and the different business categories (shown in Appendix Figure C.4).
There were slightly more owner-occupiers than renters in our sample, with 54% reporting they own the majority of their properties. If we focus on those businesses classed as eligible claimers of SBBS relief, this number is 52% for single-site and 72% for multi-site businesses.
Roughly 23% of the sample (99 respondents) reported owning other properties outside Scotland.[30] Of these, 96%, or 95 businesses, said these properties were in the rest of the UK as opposed to the rest of the world. 71% of those who reported to have other properties are classed as eligible claimers of SBBS relief. Put differently, of the 329 businesses in the sample that we classed as eligible claimers, 22% declared they have other properties in the rest of the UK or the rest of the world. For these businesses, of which there is a substantial number, the non-Scottish portion of the business is not accounted for in determining SBBS eligibility: businesses that might appear small and in need of support in a Scottish context may not actually be so small.
5.7 Comparability of valuation roll and survey responses
5.7.1 Survey responses versus VR data
In the survey, we asked respondents to record the total RV of the non-domestic properties that make up their business, as well as whether or not they have other properties (as discussed above). This was asked in order to understand how many businesses were aware of the RV of the property(ies) in which they were operating – the aspect of their business that determines eligibility for SBBS relief. This was intended to help us understand the extent to which business owners/ratepayers were engaged with the process of NDR determination and, by extension, the SBBS scheme, both of which were tendered objectives of the evaluation.
From the 441 responses, 73 (17%) did not answer and 115 (26%) reported that they did not know the total RV of the properties in which they operate. Thus, only 56% of respondents reported to know their RV. Those we classified as single-site eligible claimers were most likely to know the RV of their property, followed by multi-site eligible claimers. This was, however, an awareness rate of only 63% and 54% in these respective groups. Although only a small group, all four of the respondents from ineligible multi-site businesses reported that they knew the total RV of their properties. RV knowledge was similar among occupiers/tenants and owners (we included a question on whether the business rented or owned the majority of their properties); with 59% of occupiers/tenants and 58% of owners recording they were aware of their RV. Only 30% of those who did not answer whether they rented or owned the majority of their properties knew their RV.
However, the information provided by those who reported to know (and subsequently recorded) their total RV did not always match the data held in the VR. A total of 233 (52%) respondents in the full sample recorded their total RV, 138 (59%) of which matched or were within £1,000 of the RV in the VR data, either gross or net of residential apportionment. Of these, 114 were single-site businesses and 24 were multi-site businesses. As such, only 58% of single site businesses and 53% of multi-site businesses that answered this question reported an RV that matched with that in the data (within £1,000).
There are a number of reasons the business RV reported in the survey might not match the business RV in the VR:
1) respondents do not know the current RV of their property, even though they report to do so;
2) there are errors in grouping properties into single or multi-site businesses from the VR database, or there are errors in the VR itself; and
3) businesses may have other properties elsewhere in the UK or rest of the world and are reporting the RV of these properties in addition to their properties in Scotland.
There is some support for reason 3) from the survey data, but this does not account for all of the discrepancy. Overall 20% of the respondents for the single-site businesses in our sample reported they had other non-domestic properties in the rest of the UK. Unsurprisingly, just over 60% of these businesses reported a total RV that did not match that in the VR.
For those we classified as single-site businesses based on the VR, the average differences between reported (in the survey) and recorded (in the VR) RV are substantial – the mean and median differences in reported and recorded RV are £28,402 and £1,250 respectively. The large mean difference is driven by very large reported RVs relative to our sampling frame – the maximum RV at which we sample from the VR was £25,000 for single-site businesses and £45,000 for multi-site businesses, however among the survey respondents there were 16 businesses with a reported RV above this limit, 10 of which in fact had RVs above £100,000.
There are smaller differences between the reported and recorded RVs of properties estimated to be part of multi-site businesses. The average difference in RV for multi-site respondents is only £1,703, and the median is £1,212 (i.e. people underestimate their RV).
We believe that a principal source of the discrepancy lies in the uncertainty associated with constructing a database of businesses from the data made available to us, as documented in Section 3. This means that we might consider that a property constitutes a single-site business when it is actually part of a multi-site business, and properties may not be included in the collation of properties for a multi-site business.
The large discrepancies between reported RV and recorded RV found as a result of undertaking the survey again cast doubt over the reliability of business groupings based on the VR address data, and therefore our ability to accurately know the RV of business entities. This is not to say that we assume business owners/ratepayers know their RV exactly, however we would expect a greater degree of alignment between reported and recorded values if properties were categorised accurately into businesses.
5.7.2 Using RV and relief levels for analysis
Much of the analysis planned for the survey was predicated on comparing responses across the distribution of RV – the primary characteristic of businesses that defines SBBS eligibility. The relatively low response rate to the RV question in the survey and the seeming mismatch between survey and VR information leave three choices for this analysis.
First, we can use the RV reported in the survey. This means discarding the 48% of responses that did not record an RV when making comparisons by RV. It also implicitly assumes that respondents know their business RV accurately.
Second, we could use the RV from the VR. This would mean using all respondents in any analysis across RV, but would assume that this information is accurate at the business level (over which we have considerable doubt).
Third, respondents' RV could be "filled in" from the VR where they did not record their RV. This would assume that both reported and recorded RV are sufficiently accurate to allow them to be used as proxies for one another.
We do not use this latter method due to the clear discrepancies between the VR and survey data that show neither is, on average, a reasonable proxy for the other. We also choose not to use the RV from the VR for all respondents due to the high likelihood properties are incorrectly combined into business entities, as just discussed. This would be tantamount to assuming that, in spite of all its shortcomings which we have noted, this data is more accurate at the business level than the data provided by business owners/operators themselves.
Using the RV from the VR in this way also leads to counterintuitive results. For example, Appendix Figure B.4 shows that when using survey RV to evaluate Question 13 of the survey (which asks about the importance of various forms of Government spending), a higher proportion of those just under the 100% SBBS threshold report spending on NDR relief as important to their operation than among those just above; and those just below the threshold are the most likely to rank NDR relief as important overall (as expected). However, when using VR RV in panel (b), the reverse is true – those just below the 100% threshold are less likely to report NDR relief as important, and are in fact the least likely overall to say so (which is counterintuitive). This is because using the RV from the VR changes the position of respondents in the RV distribution, particularly around the thresholds (Appendix Table B.1). Appendix B provides a further discussion of using VR RV in this way.
Where we need to undertake comparisons of responses across the RV of businesses, we therefore proceed by using the reported RV in the survey where this is available. This means excluding from this analysis the businesses that did not report an RV value, limiting us to 233 responses.
This of course compounds the limitations of the survey due to small sample size, as detailed above, but by doing so we increase the likelihood that our analysis is at least internally consistent. Business occupiers will have responded to the survey conditional on the information they have reported, and assigning them an RV (from the VR) about which we are uncertain risks incorrectly assigning responses to groups (i.e. RV bands).
The survey also asked respondents to record the level of SBBS relief they received. Again, the answers to this question were not broadly consistent with levels of relief recorded in the Billing Snapshot data – only around 52% of respondents reported receiving a level of SBBS relief consistent with that in the Billing Snapshot. The proportion was similar when considering those classified as single-site and multi-site eligible claimers separately. This was in large part a result of 40-45% of these two groups reporting that they either did not receive relief or did not know if they received relief, or not answering the question.
In terms of eligible non-claimers, just less than one third of single-site businesses in this group reported that they did in fact receive SBBS relief. Only one single-site ineligible claimer reported receiving SBBS relief, however they did not record their RV in their response so we cannot know whether this was due to an inconsistency in reported versus recorded RV.[31]
For the same reasons that we use reported RV, we therefore use reported claim status (as opposed to our A-F groupings) for comparisons across business categories. Unfortunately, we are not able to ascertain whether a respondent is a single or multi-site business from the survey questions.[32] This means that we can construct four categories of business: (1) 100% recipients; (2) 25% recipients; (3) those who are eligible but do not claim and; (4) those who are ineligible.
The inability to separate single from multi-site businesses should not affect these comparisons a great deal. SBBS eligibility for 100% relief requires the total business RV to be at most £15,000. Whether this comprises two properties valued at £7,500 or one at £15,000 has no bearing on the level of relief received. However, it does mean that there might be businesses in the 25% relief category that are vastly different. For example, it could contain a single-site business receiving 25% relief on its only property with an RV of £17,000, a multi-site business receiving 25% relief on two properties valued at £17,000 each, or a multi-site business with one property with an RV of £1,000 (on which it receives 25% relief) and a second property with an RV of £33,000 (on which it receives no relief).
Thus, when we need to make comparisons across the RV distribution, we include only those respondents that provided their RV in the survey (56%). When we compare across claim status, we use only those respondents that provided this information (62%). But where we do not compare across these two dimensions, we use the full sample of respondents. Rather than omit businesses with missing information completely, however, we combine them into a 'missing' category. In this way, although we cannot use them in comparisons across RV or SBBS relief levels, we analyse how those with missing information responded to questions on average.
Contact
Email: ndr@gov.scot