Small Business Bonus Scheme: evaluation
This report presents the results of an evaluation of the Small Business Bonus Scheme (SBBS), and provides recommendations in relation to the SBBS and non-domestic rates relief more broadly.
Appendix B: Using Valuation Roll rateable values for survey analyses
Here we outline how using the RV from the VR affects respondents' RV groupings, and how results of our analysis change when conducted using this RV. Table B.1 shows how respondents' RV grouping, defined in our sampling strategy (Figure 5.1), is affected by using reported versus recorded RV. It shows the number and percentage of businesses in each survey RV band (left) that fall in each VR RV band (top), and highlights that the majority of businesses do not change broad RV grouping drastically, but rather they stay in those adjacent. Using the VR RV therefore results in switching businesses from one side of the policy thresholds to another based on their reported RV.
| RV band using VR RV | Total (N/%) | |||||||
|---|---|---|---|---|---|---|---|---|
| <£14,000 | £14,000-£14,999 | £15,000-£15,999 | £16,000-£17,999 | £18,000-£24,499 | £35,000-£44,499 | |||
| RV band using survey RV | <£14,000 | 42 | 20 | 10 | 4 | 1 | 0 | 77 |
| 54.6 | 26.0 | 13.0 | 5.2 | 1.3 | 0 | 100 | ||
| £14,000-£14,999 | 3 | 24 | 6 | 0 | 0 | 0 | 33 | |
| 9.1 | 72.7 | 18.2 | 0 | 0 | 0 | 100 | ||
| £15,000-15,999 | 1 | 2 | 24 | 1 | 0 | 0 | 28 | |
| 3.6 | 7.1 | 85.7 | 3.6 | 0 | 0 | 100 | ||
| £16,000-£17,999 | 1 | 2 | 6 | 34 | 2 | 0 | 45 | |
| 2.2 | 4.4 | 13.3 | 75.6 | 4.4 | 0 | 100 | ||
| £18,000-£24,999 | 2 | 2 | 1 | 3 | 12 | 1 | 21 | |
| 9.5 | 9.5 | 4.8 | 14.3 | 57.1 | 4.8 | 100 | ||
| £25,000-£34,999 | 1 | 2 | 1 | 2 | 1 | 2 | 9 | |
| 11.1 | 22.2 | 11.1 | 22.2 | 11.1 | 22.2 | 100 | ||
| £35,000-£44,999 | 1 | 1 | 0 | 0 | 1 | 1 | 4 | |
| 25 | 25 | 0 | 0 | 25 | 25 | 100 | ||
| £45,000-£99,999 | 1 | 3 | 0 | 2 | 0 | 0 | 6 | |
| 16.7 | 50.0 | 0.0 | 33.3 | 0 | 0 | 100 | ||
| £100,000-£500,000 | 5 | 1 | 2 | 1 | 1 | 0 | 10 | |
| 50 | 10 | 20 | 10 | 10 | 0 | 100 | ||
Figure B.1 shows the distribution of turnover across our sampling categories. Grouping in this way leads to more variation among seemingly similar types of business. For example, for eligible single-site non-claimers (B) the spread of turnover is extremely high relative to eligible single-site claimers (A).
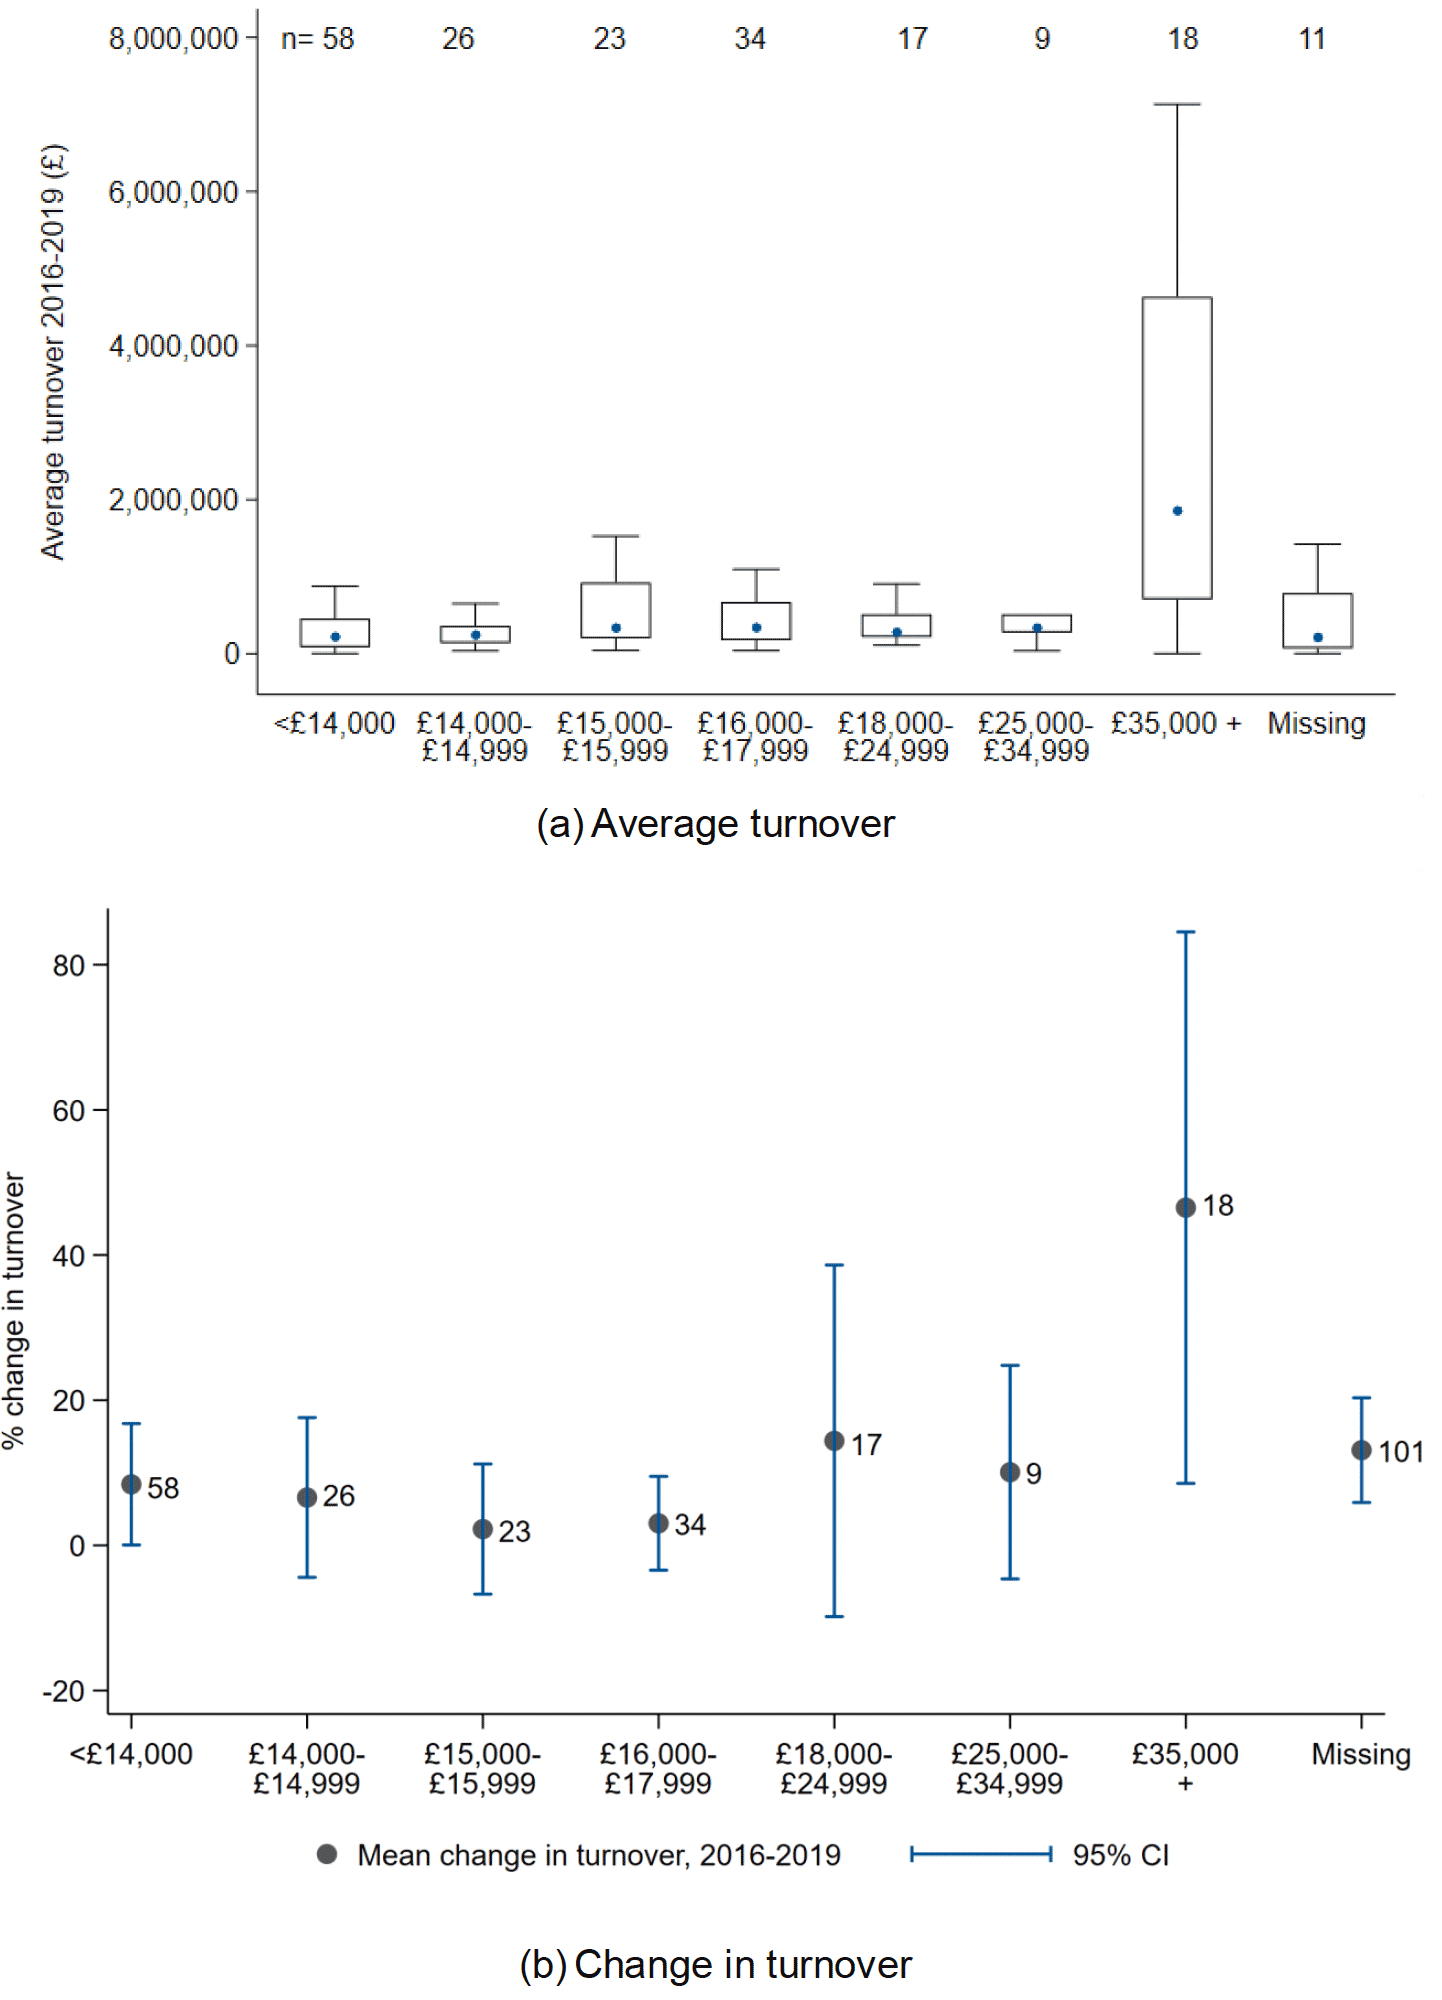
Note: 95% confidence intervals around average turnovers have been omitted from groups E and F due to sample size. Sample sizes within groups are identical in both graphs.
Figure B.2 then presents the same outcome broken down across VR RV bands. In general, the spread of turnover in these bands is not too dissimilar to when using survey RV. However, there is more variation among the lower-RV categories, particularly those immediately below the 100% SBBS threshold. Similarly, there is a larger variation in turnover of businesses valued between £18,000 and £24,499. In both cases, this is a result of businesses with higher reported RVs changing groups when using the VR RV.
Note: 95% confidence int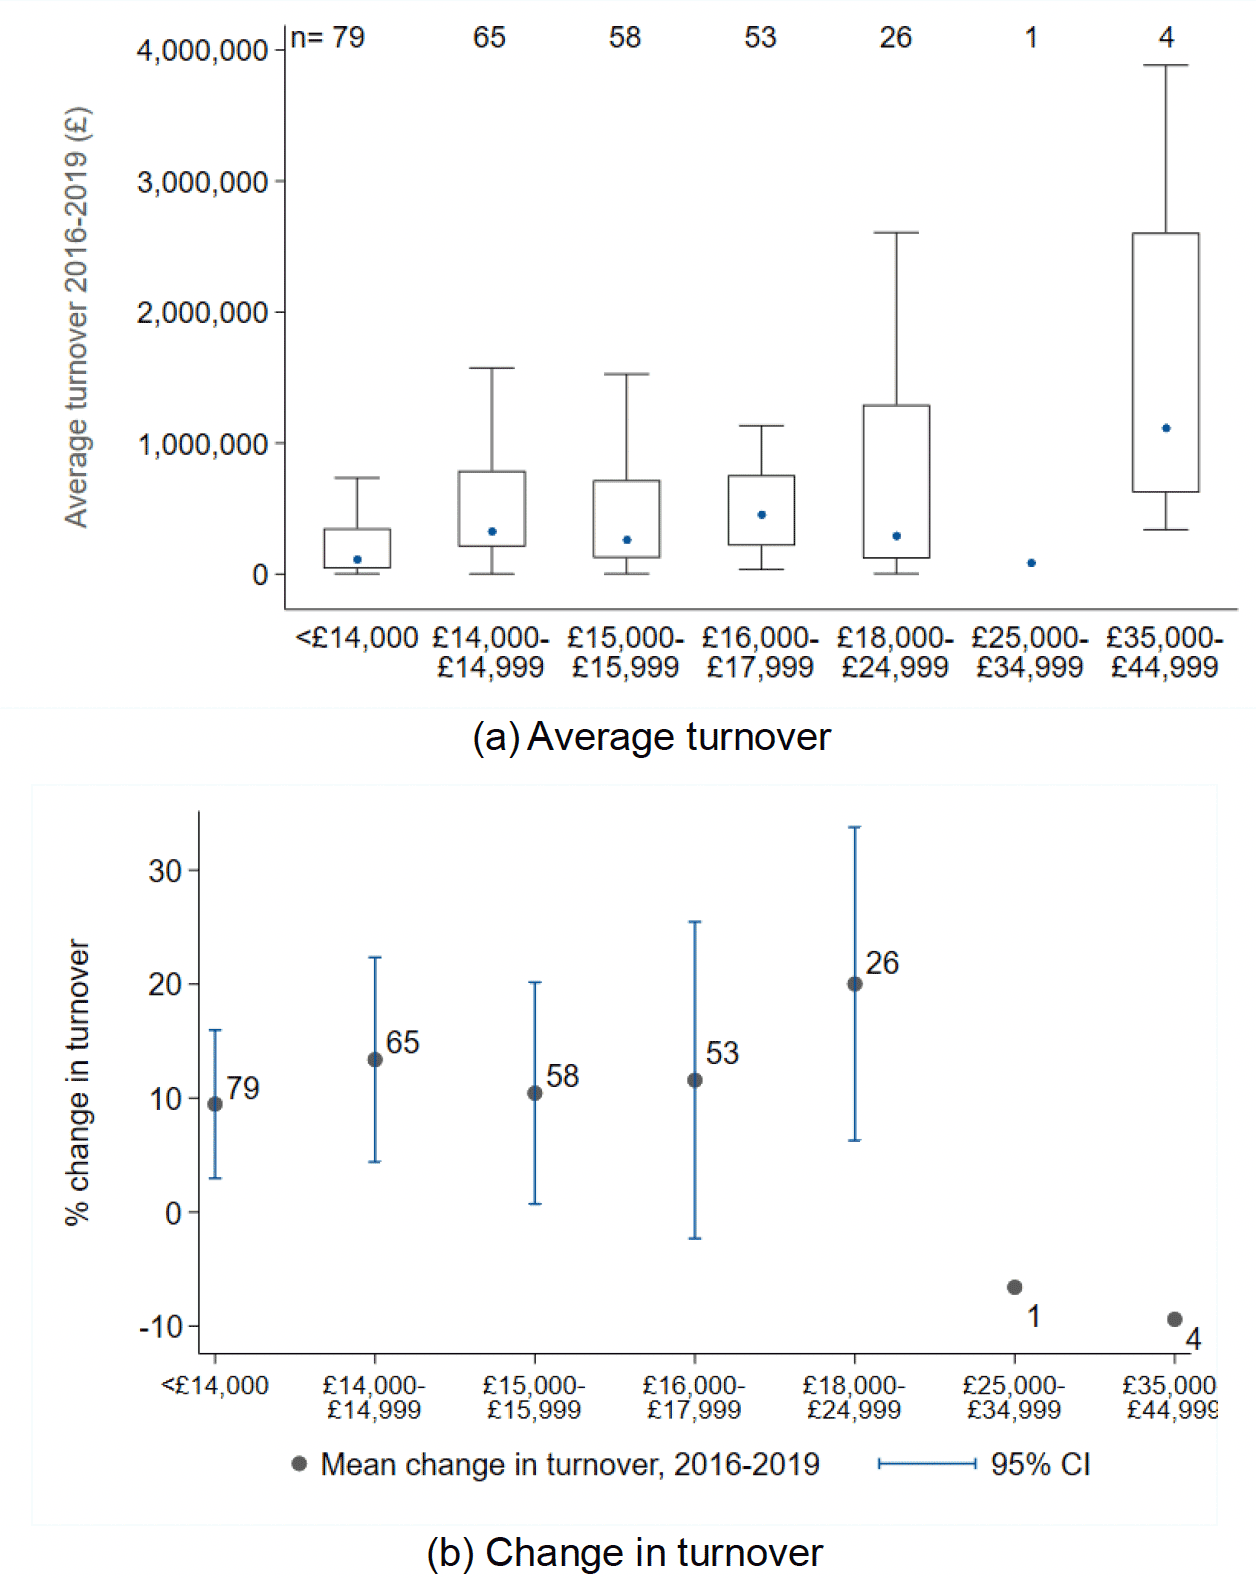 Note: 95% confidence intervals around average turnovers have been omitted from groups due to sample size.
Moving to employment, Figure B.3 shows the recent distribution of FTE employment reported by businesses across VR RV bands. As with turnover, the groups most affected by this grouping are those valued £14,000-£14,999 and £18,000-£24,499. For both, the variability of employment within RV bands is increased when compared with using reported RV groupings. This suggests that using the VR RV is more likely to group dissimilar businesses.
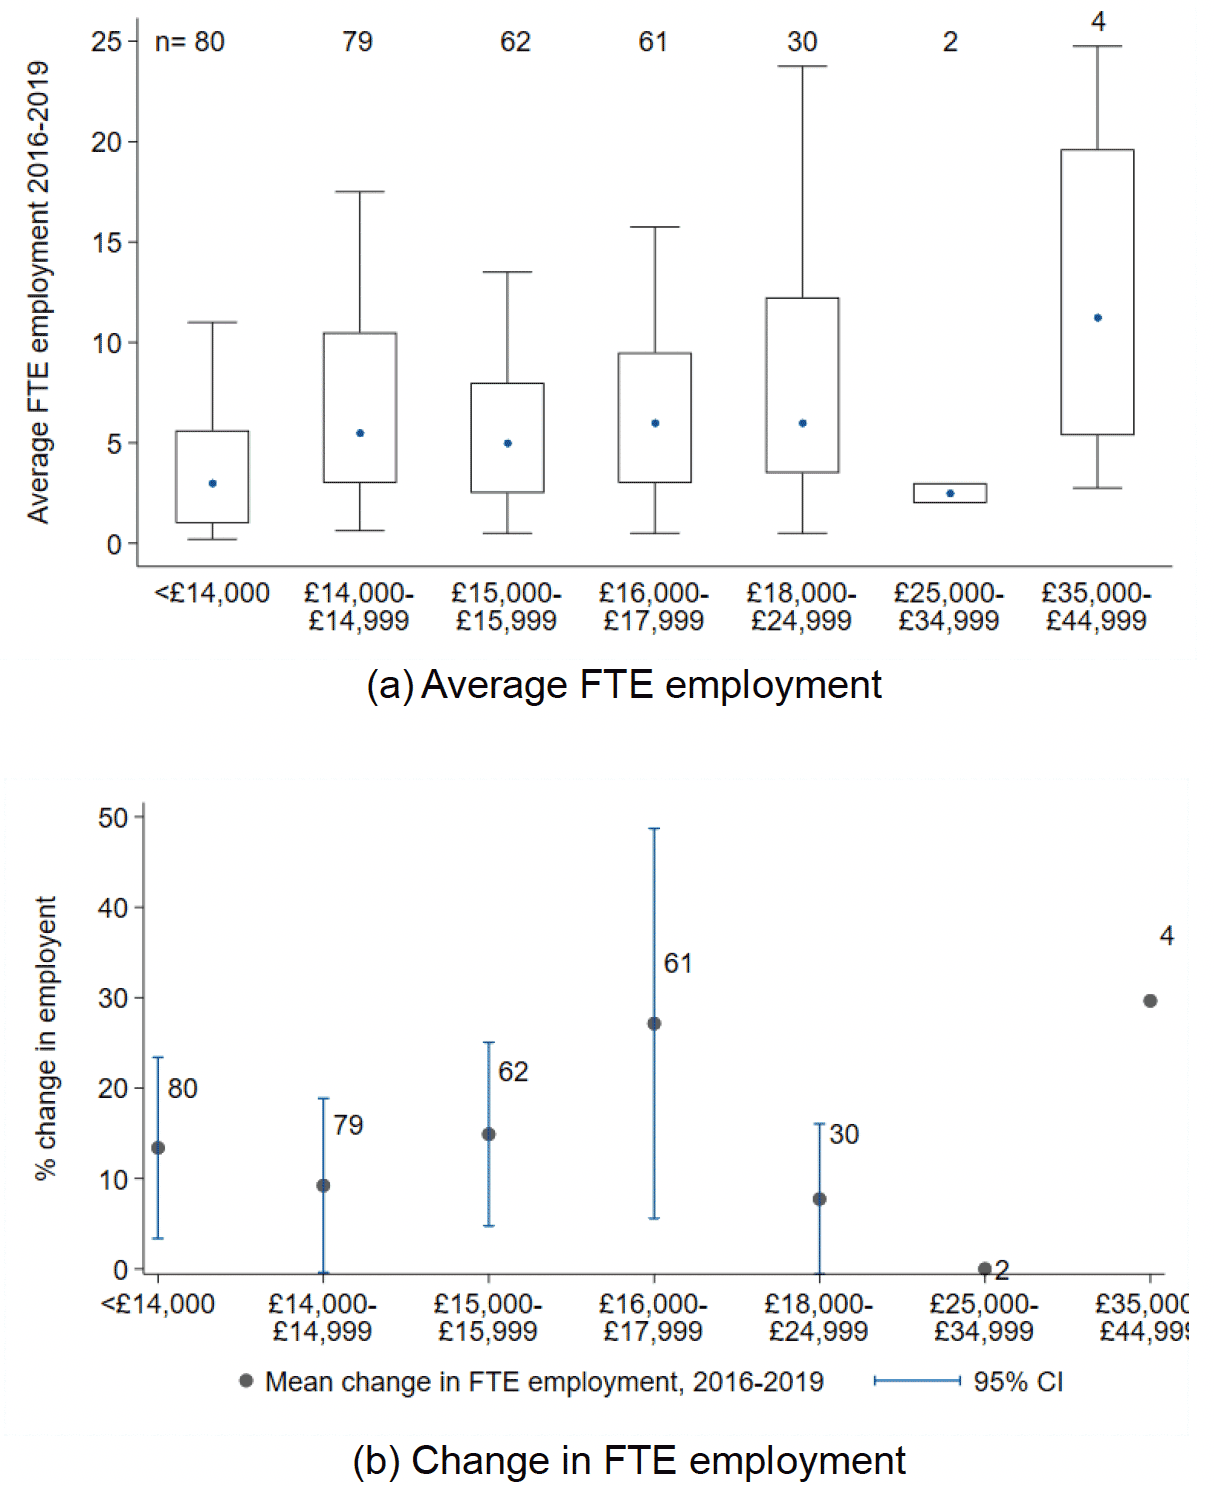
Note: 95% confidence intervals around average turnovers have been omitted from groups due to sample size. The change in FTE employment for the £25,000-£34,499 category is zero. The two firms that make up this group reported stable FTE employment across all years.
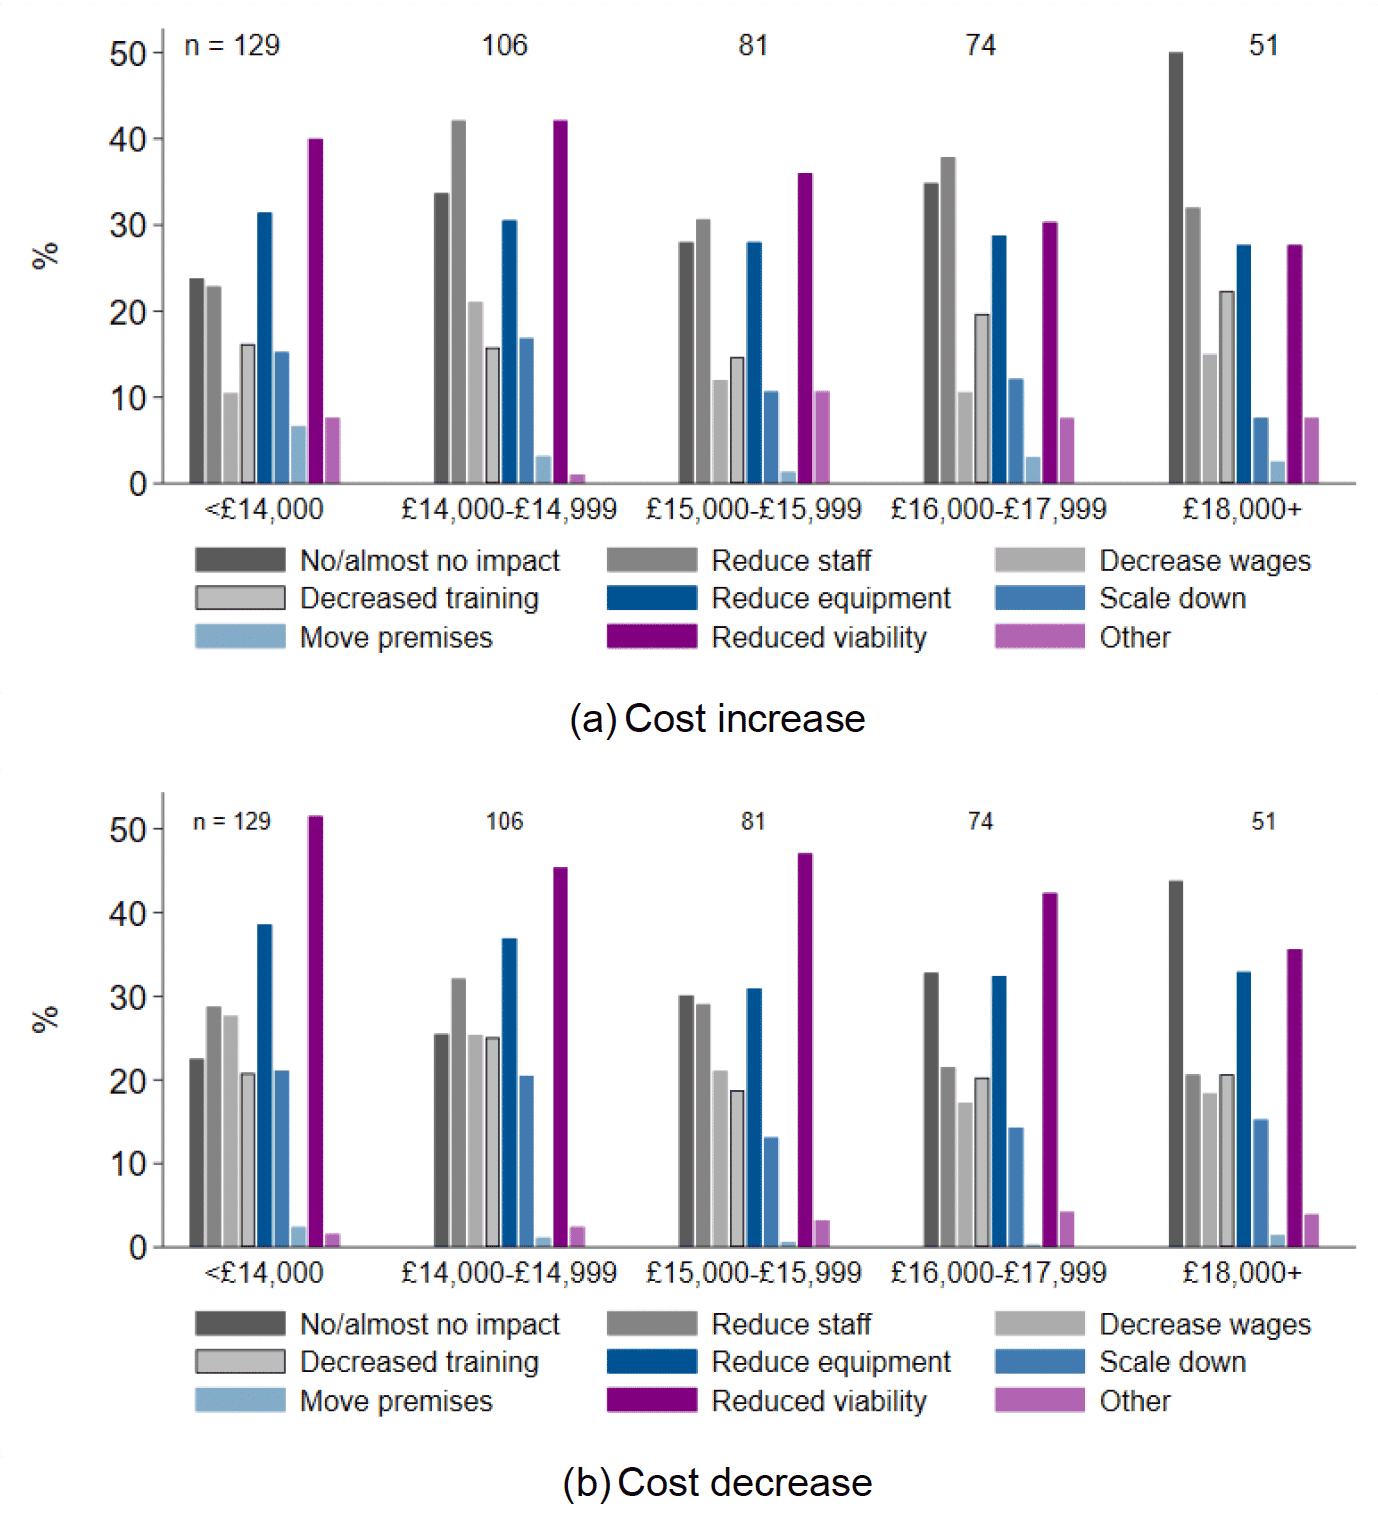
To further highlight how using the VR RV in our analysis alters results, Figure B5 shows the patterns in responses to questions about cost increases and decreases when using the RV from the VR to categorise businesses. Compared to Figure 6.11, which uses reported RV, general patterns in responses are similar. However, differences around the 100% SBBS threshold are slightly different. For example, using the VR RV, those just below the threshold are more likely to say their viability is impacted by cost increases than those just above. This is somewhat counterintuitive given their costs are already much lower than those just above the threshold given they receive 100% SBBS. The differences in reporting regarding differences in staffing and wages are also less pronounced. This is likely a result of the fact that using VR RV places businesses who report to be just above the threshold just below, and vice versa.
Finally, Figure B.6 compares answers to questions 23-30, which were directly about SBBS, when using reported versus recorded level of relief. Again, the differences between those receiving 25% and 100% relief are less pronounced when using the RV from the VR as opposed to those reported by businesses.
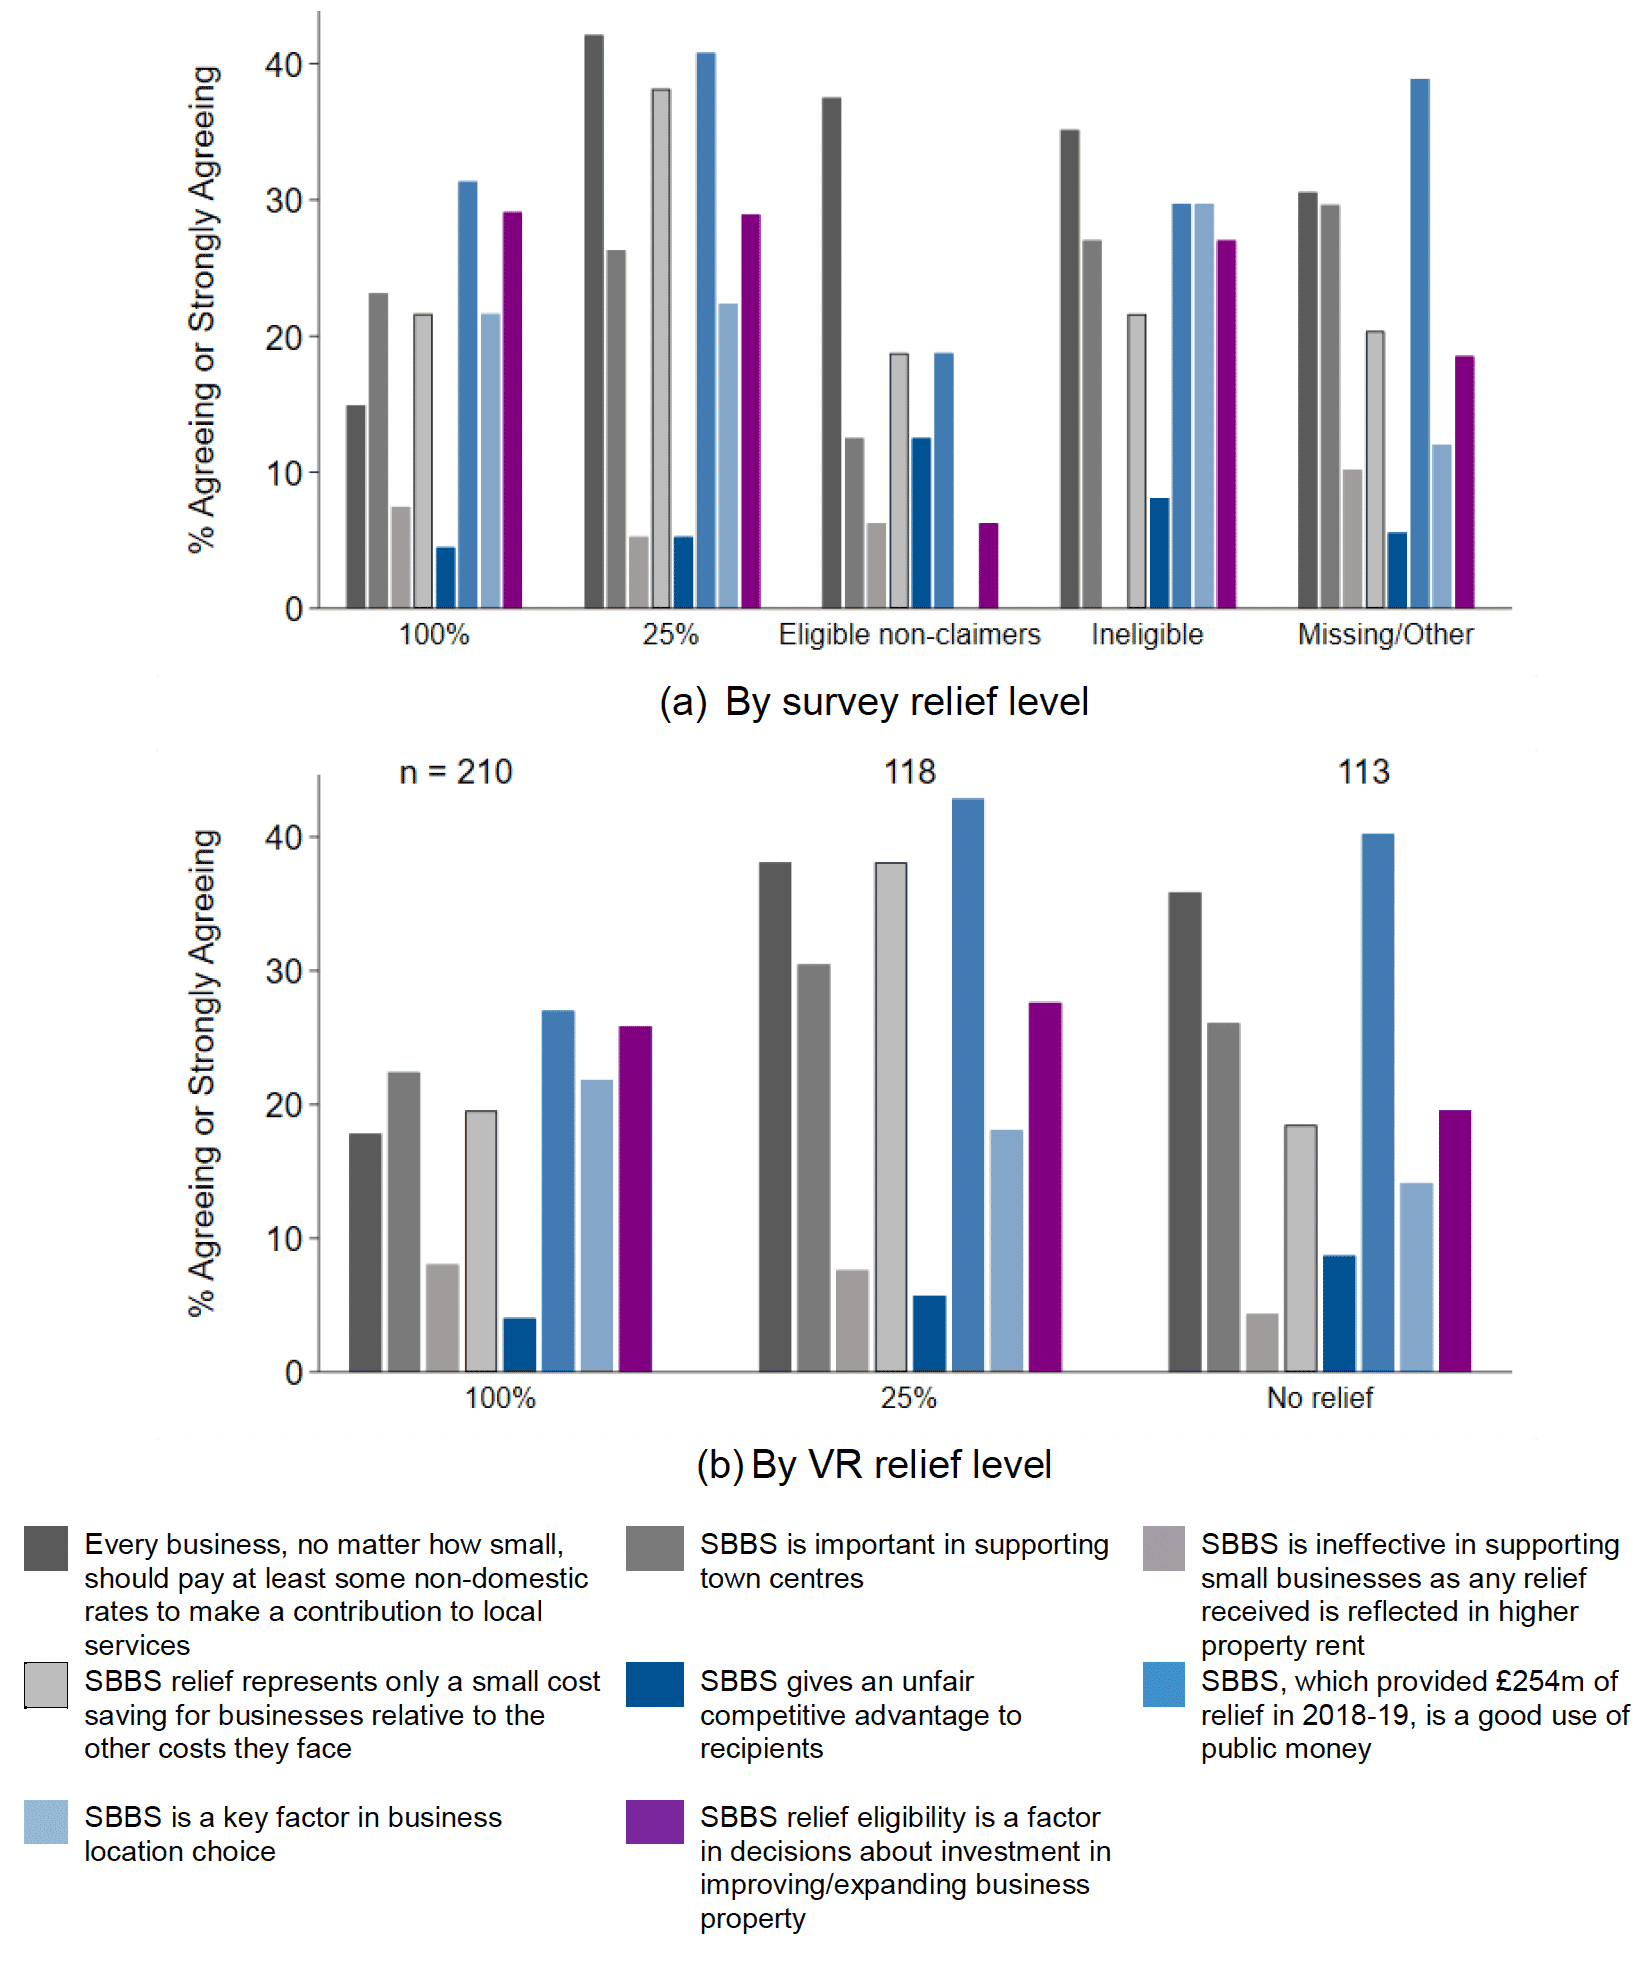
Every business, no matter how small, should pay at least some non-domestic rates to make a contribution to local services
SBBS is important in supporting town centres
SBBS is ineffective in supporting small businesses as any relief received is reflected in higher property rent
SBBS relief represents only a small cost saving for businesses relative to the other costs they face
SBBS gives an unfair competitive advantage to recipients
SBBS, which provided £254m of relief in 2018-19, is a good use of public money
SBBS is a key factor in business location choice
SBBS relief eligibility is a factor in decisions about investment in improving/expanding business property
(b) By VR relief level
Contact
Email: ndr@gov.scot