Small Business Bonus Scheme: evaluation
This report presents the results of an evaluation of the Small Business Bonus Scheme (SBBS), and provides recommendations in relation to the SBBS and non-domestic rates relief more broadly.
4. An overview of SBBS support across Scotland
When combined, the VR, PTOA dataset and Billing Snapshot form comprehensive data on the distribution of non-domestic properties and SBBS relief received by properties across Scotland. Whilst it is not possible to evaluate business outcomes using this data, it does allow us to describe several important aspects of the small business base in Scotland and the support that it receives.
For example, we can use the information in the combined data to understand the composition of non-domestic properties, both currently and over the past decade. Similarly, the data can be used to shed light on the location and types of properties that receive support, as well as to seek to understand the take-up of SBBS relief among eligible properties.
In this section, we first use the most recent VR, PTOA dataset, and SBBS data to answer these questions, and then use historical data to examine whether or not the answers to any of them have changed over the period the SBBS has been in place. We then conclude with a brief discussion of whether or not it is possible to infer anything about the impact of the SBBS around its thresholds using only the data we have described here.
4.1 Non-domestic properties in Scotland
As at January 2020 – at the time of writing, the most recent version of the data made available to us for this evaluation – there were 255,822 non-domestic properties in Scotland. According to the estimated site count for businesses – the methodology for which is outlined in Section 2 – 129,469 (marginally over 50%) of these properties are associated with a business that operated from a single site, and 126,353 (marginally under 50%) with those that used more than one non-domestic property.
For each property, the data details the RV on which basis SBBS eligibility is determined. Figure 4.1 below shows how these properties are distributed over the RV distribution. The vast majority have an RV below £18,000 – the upper threshold for SBBS relief on a property[17] – and the median[18] non-domestic property RV is £5,400.[19]
The vast majority (231,461; 91%) of properties on the VR are recorded as being for private as opposed to public use. There are 14,587 properties (5.7%) used as council buildings, with the remaining 9,774 (3.8%) recorded as being used for various public functions, such as buildings for public utilities (1,667; 0.65%), the police and fire service (770; 0.3%) and the NHS (2,023; 0.7%).
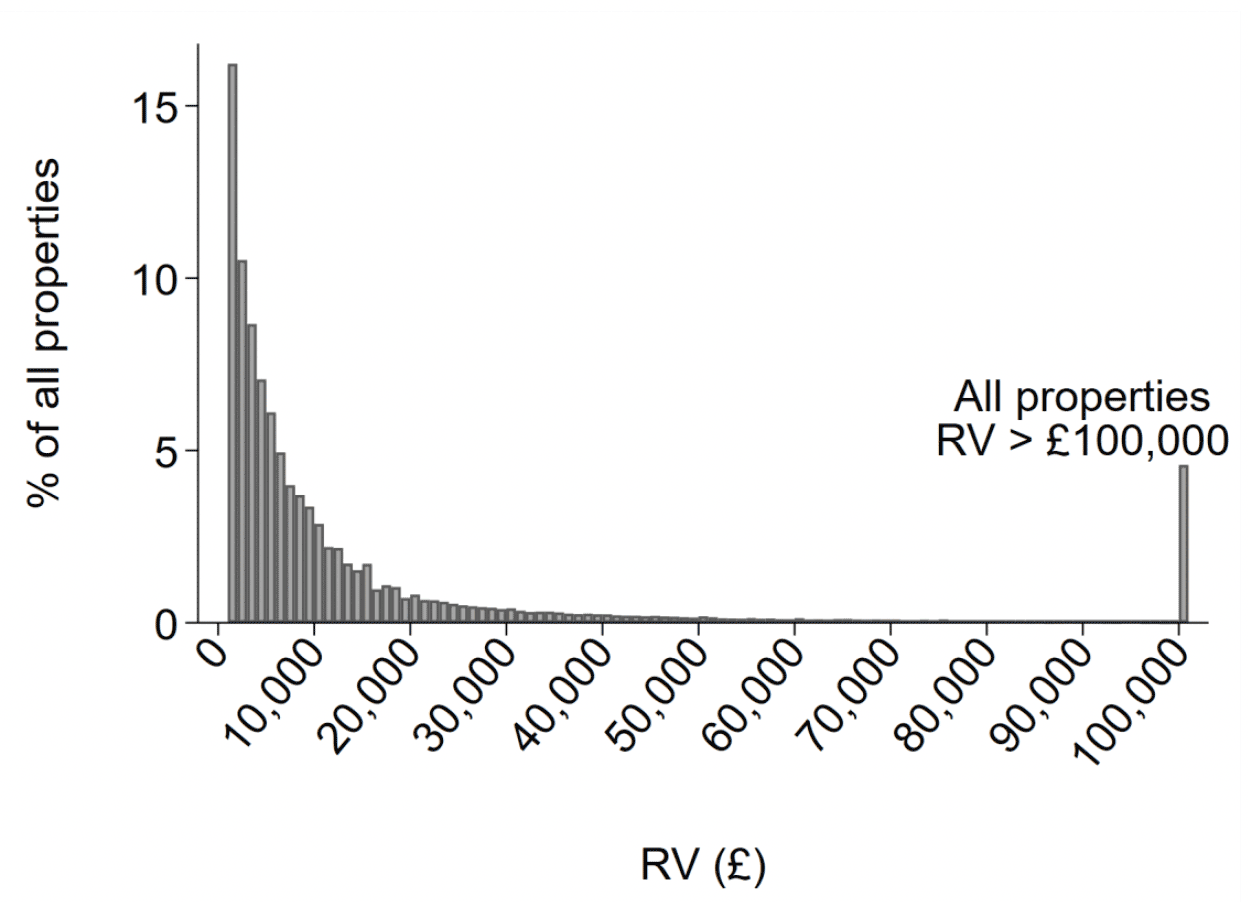
Note: Properties are grouped into £1,000 RV bands. For example, the bar between £1,001 and £2,000 groups all properties with an RV of at least £1,001 and at most £2,000. Where part of a property is used for residential purposes, we deduct the value of this residential portion from its RV.
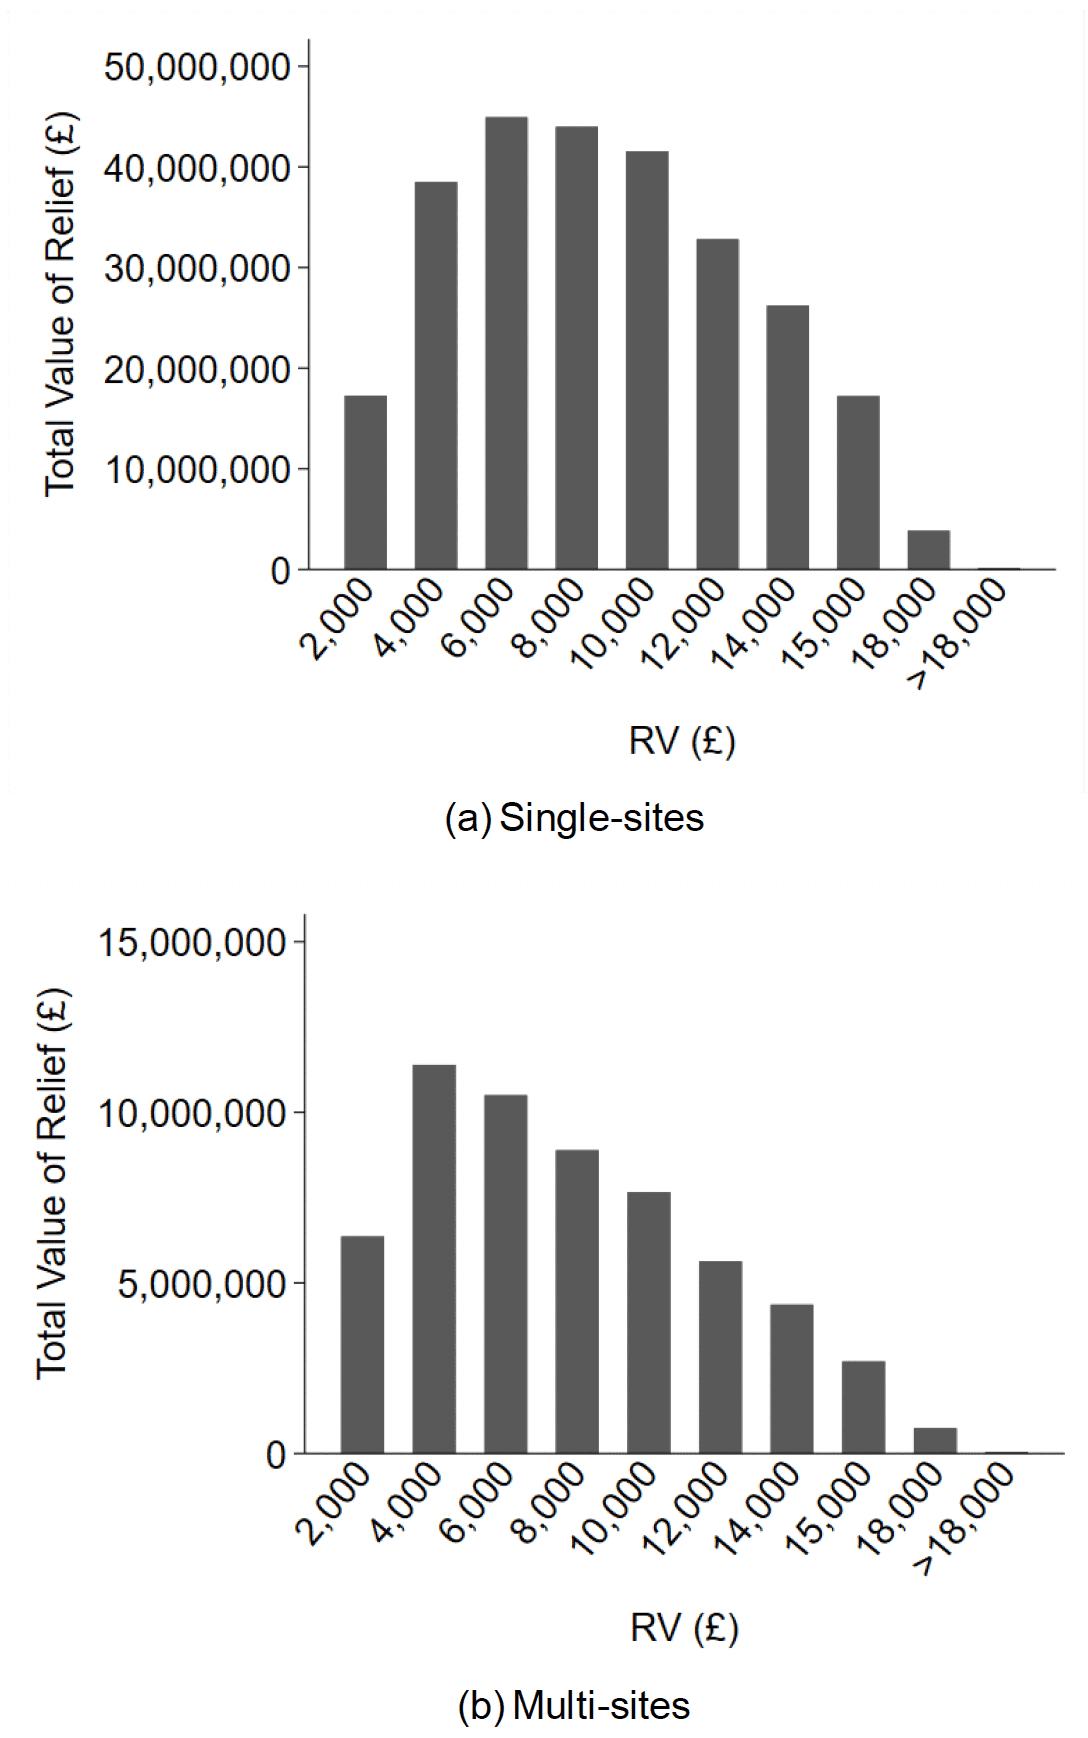
Figure 4.2 breaks down the distribution of non-domestic properties based on whether or not they were estimated to be part of a single or multi-site business. The vast majority of those that are part of a single-site business have an RV below the threshold for 100% SBBS relief (panel (a)). Over three-quarters of all non-domestic properties fall to the left of the first dashed line which indicates the RV threshold for 100% SBBS relief for single-sites (those part of a multi-site business only receive 100% relief if the cumulative value of all properties is below £15,000). For comparison, panel (b) of Figure 4.2 shows the distribution of properties that were estimated to be a part of a multi-site business. There is a larger number of these properties at the lower end of the distribution, perhaps due to multi-site businesses being made up of small auxiliary properties such as car parks, offices, and workshops that accompany their main property. As a result of this, the median multi-site business property RV is £5,250 compared to £5,400 for those that are part of a single-site business.
In panel (a) of Figure 4.2 it is notable that there is a break in the way in which the distribution of properties declines as RV increases. At the thresholds that determine eligibility for SBBS relief, the bar representing the proportion of properties with an RV just below £15,000 – where the properties would receive 100% relief – is tall in comparison to the bar representing properties with an RV just above £15,000, where they would receive 25% relief. A similar pattern is present to the left and right of the £18,000 threshold that determines whether businesses may qualify for 25% as opposed to zero relief. In Section 4.5 in which we look at the historic data, this break in pattern only appears after these policy thresholds were introduced and suggests some sorting of properties valued close to the 100% and 25% relief eligibility thresholds. In Section 4.7, we look in more detail at how revaluation appeals have contributed to this sorting.
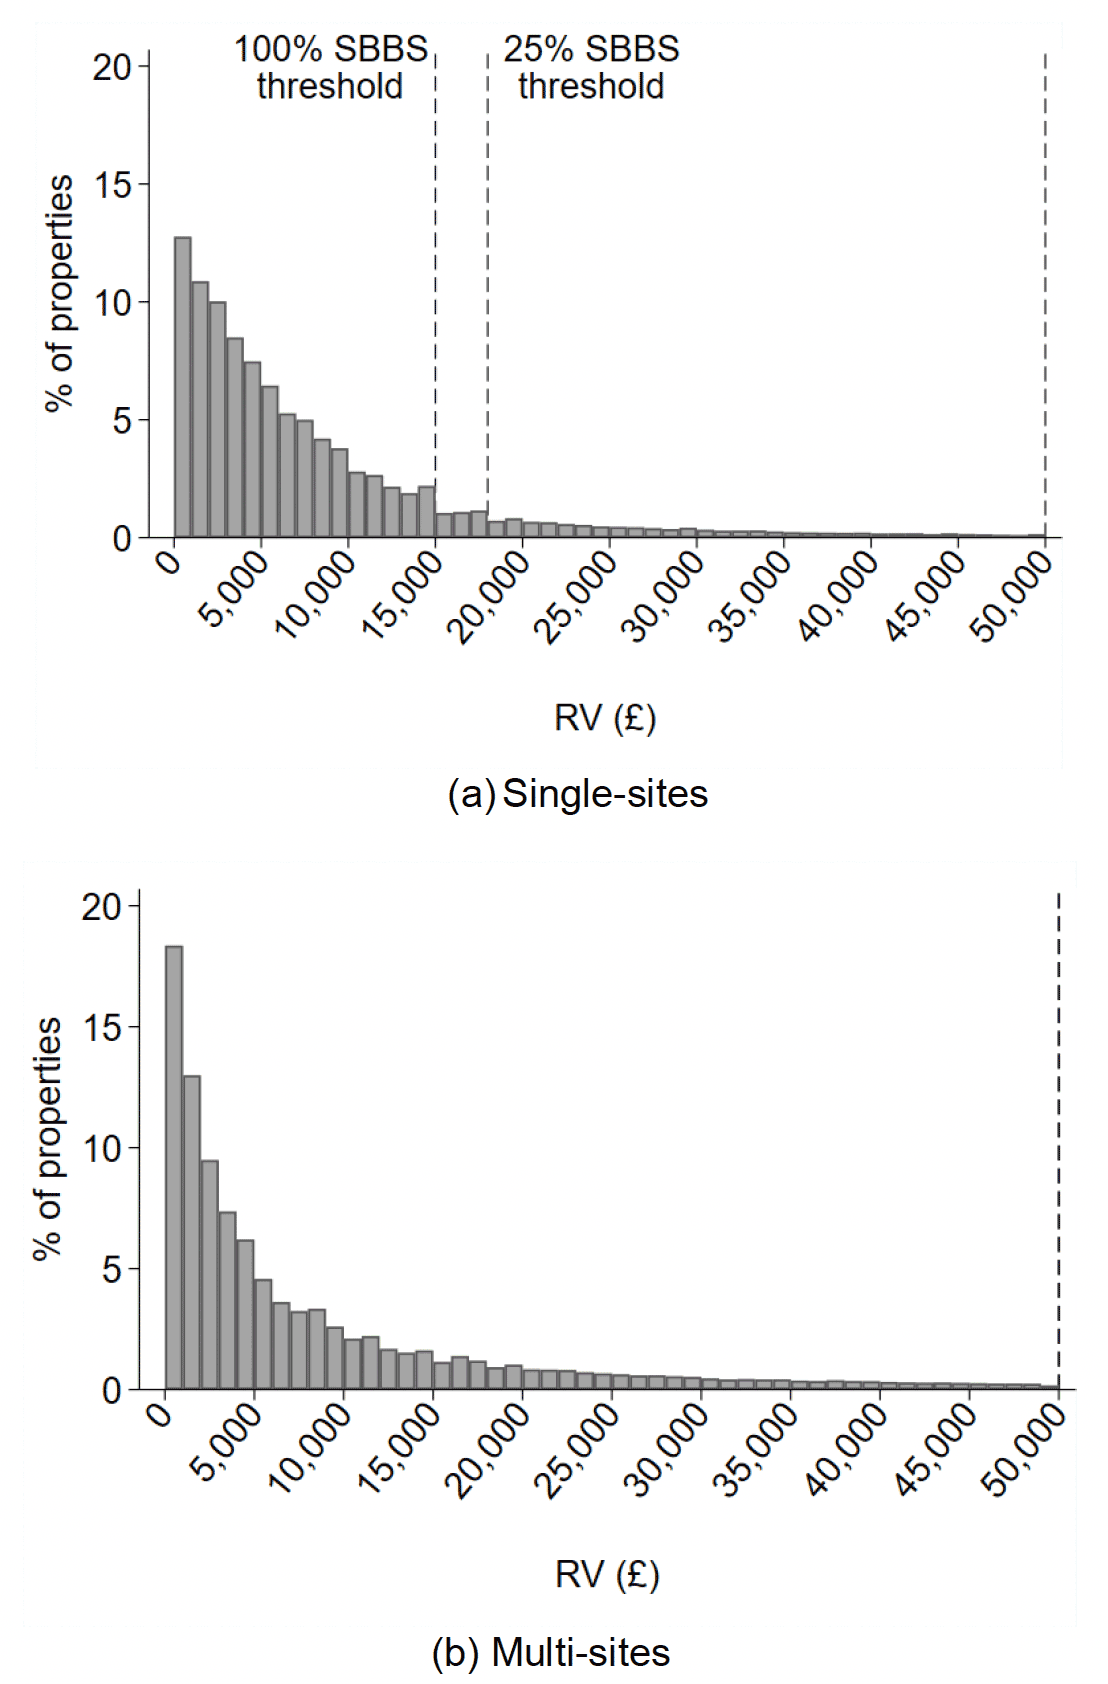
Note: The distributions have been truncated at £50,000 to focus on small businesses. Properties are grouped into £1,000 RV bands. For example, the bar between £1,001 and £2,000 groups all properties with an RV of at least £1,001 and at most £2,000. Where part of a property is used for residential purposes, we deduct the value of this residential portion from its RV.
Figure 4.3 below charts the distribution of multi-site businesses as opposed to properties according to their cumulative RV, highlighting the cumulative RV thresholds that define SBBS eligibility. It shows that a large proportion of businesses have a total RV below the 100% SBBS threshold of a total business RV of £15,000.
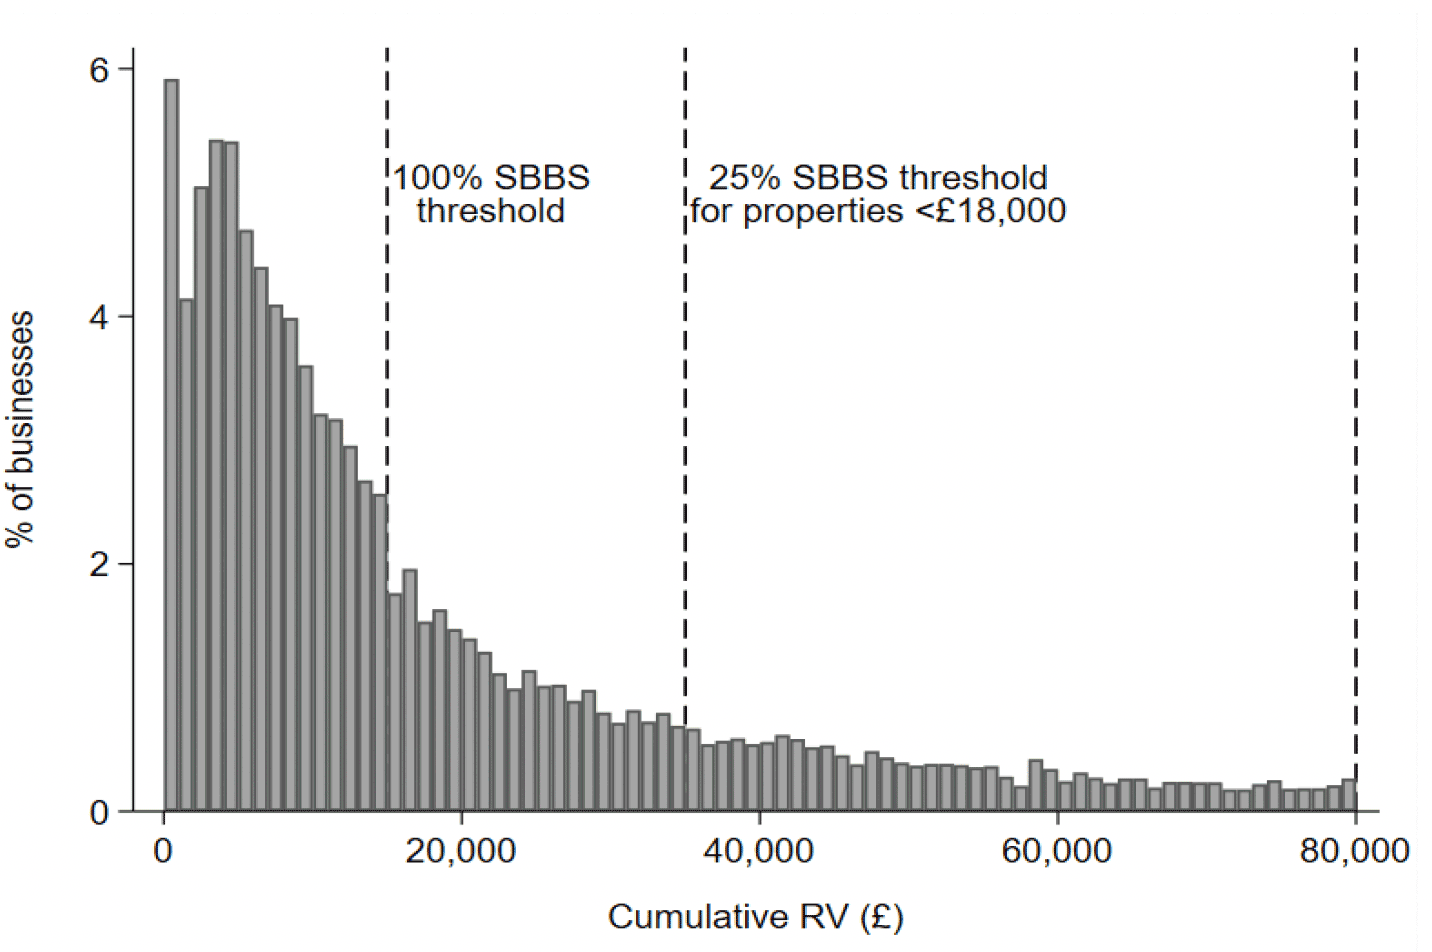
Note: The distribution has been truncated at £80,000 to focus on small businesses. Businesses are grouped into £1,000 RV bands. For example, the bar between £1,001 and £2,000 groups all properties with an RV of at least £1,001 and at most £2,000. Where part of a property is used for residential purposes, we deduct the value of this residential portion from its RV.
As was the case with single-sites, there is a change in the pattern of the distribution of cumulative RV at the £15,000 threshold, but this is less pronounced than for single-site businesses. There is no discernible change in pattern at the £35,000 threshold determining whether a business is eligible for 25% relief on its properties that have a property RV below £18,000.
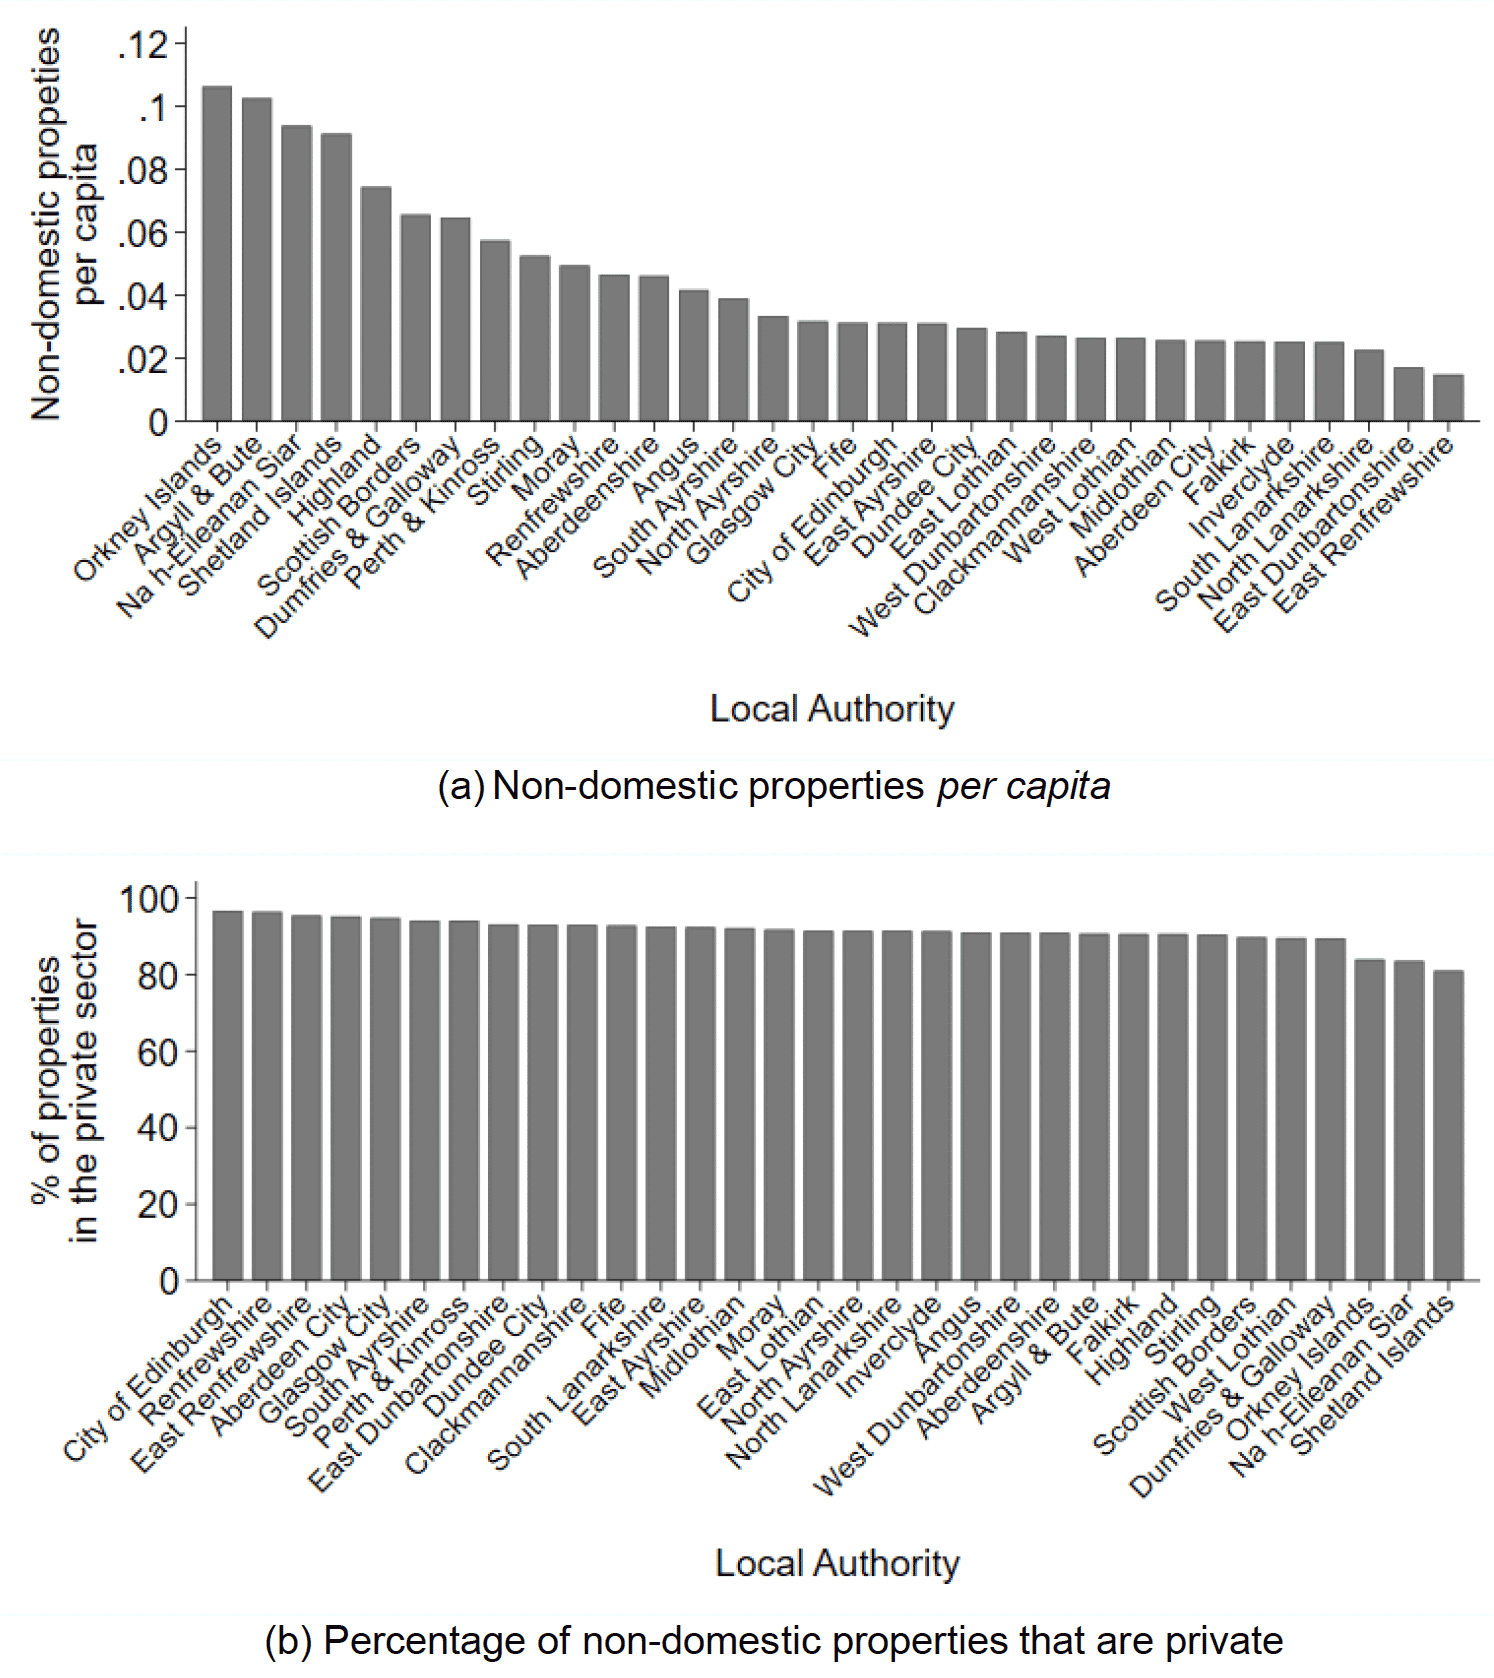
Looking at the geographical distribution of non-domestic properties provides an insight into how areas of Scotland differ in terms of their business base, and so reliance on SBBS relief. Unsurprisingly, the majority of non-domestic properties that are (potentially) eligible for SBBS relief are located in two of Scotland's major cities – Glasgow and Edinburgh – and its largest local authority by land mass, Highland. These three areas account for roughly one-quarter of all non-domestic properties in Scotland. This is also true when considering properties that are part of a single and multi-site business separately. On a per capita basis, however, Glasgow and Edinburgh have far fewer non-domestic properties than some of Scotland's less populated areas (Figure 4.4a). By this measure, Orkney Islands, Argyll and Bute, Na h-Eileanan Siar and the Shetland Islands are the most likely to have non-domestic properties eligible for SBBS relief.
Panel (b) of Figure 4.4 shows that the share of non-domestic properties that are for private use is relatively constant across Local Authorities. The only apparent difference is in the islands, with the Orkney Islands (-8 percentage points), Na h-Eileanan Siar (-8) and Shetland Islands (-11) having a private share substantially below the population share of 91%. Still, these communities have among the highest per capita shares of non-domestic properties, as shown in panel (a) of the same figure.
By far the most common class of non-domestic properties in Scotland are those classified as industrial subjects (i.e. factories, warehouses and stores), shops, and offices, which together make up over two-thirds of all those that are potentially SBBS-eligible.
The same three property classes are also among the most common when separating properties by whether they are the property of a single-site business or part of a larger multi-site business, however offices are far more common among those properties that are part of a multi-site business and shops far more common among single-site businesses (Table 4.1).
Some of these property classes are broad. Appendix Table C.2 provides a brief description of the criteria for inclusion in each property class. For example, it shows that industrial subjects include "Premises used for the manufacture, modification or storage of goods i.e. the legislative definition of "industrial" e.g. bakery, dairy, brewery, cold store, depot, engineering works, factory, garage, jetty, mill, oil storage, depot, sorting office, repeater station, refuse disposal works, warehouse, wind turbine, workshop."; statutory undertakings properties for "electricity undertakings, rail undertakings, water undertakings"; and public service subjects "premises owned and operated by public bodies e.g. airport, bus station, bus shelter, community centre, courthouse, fire station, prison".
The VR also contains a more detailed description of properties' core use. For example, core descriptions include categories such as "car wash", "garden centre" and "warehouse". Appendix Table C.1 gives a full list of core descriptions. It is not the case that all properties in a property class fall under the same core description, however some core descriptions appear predominantly in only one property class. For example, 99% of "shootings" – the term for land used for commercial shooting of game – are classed as sporting subjects, as are 90% of "fishings" – waters used for commercial fishing. Together, these two categories make up around 92% of the sporting subjects category.
Shootings were in fact exempt from NDR from 1 April 1995 until 2017, when the Land Reform Act 2016 came into force. Under this Act, shootings became liable for rating and, by extension, potentially eligible for SBBS relief from 1 April 2017. This meant an additional 12,000 non-domestic properties were eventually added to the Valuation Roll by 1 April 2018. As such, the relative prominence of sporting subjects as a property class in Table 4.1 has been increased by the introduction of shootings to the Valuation Roll from 2017.
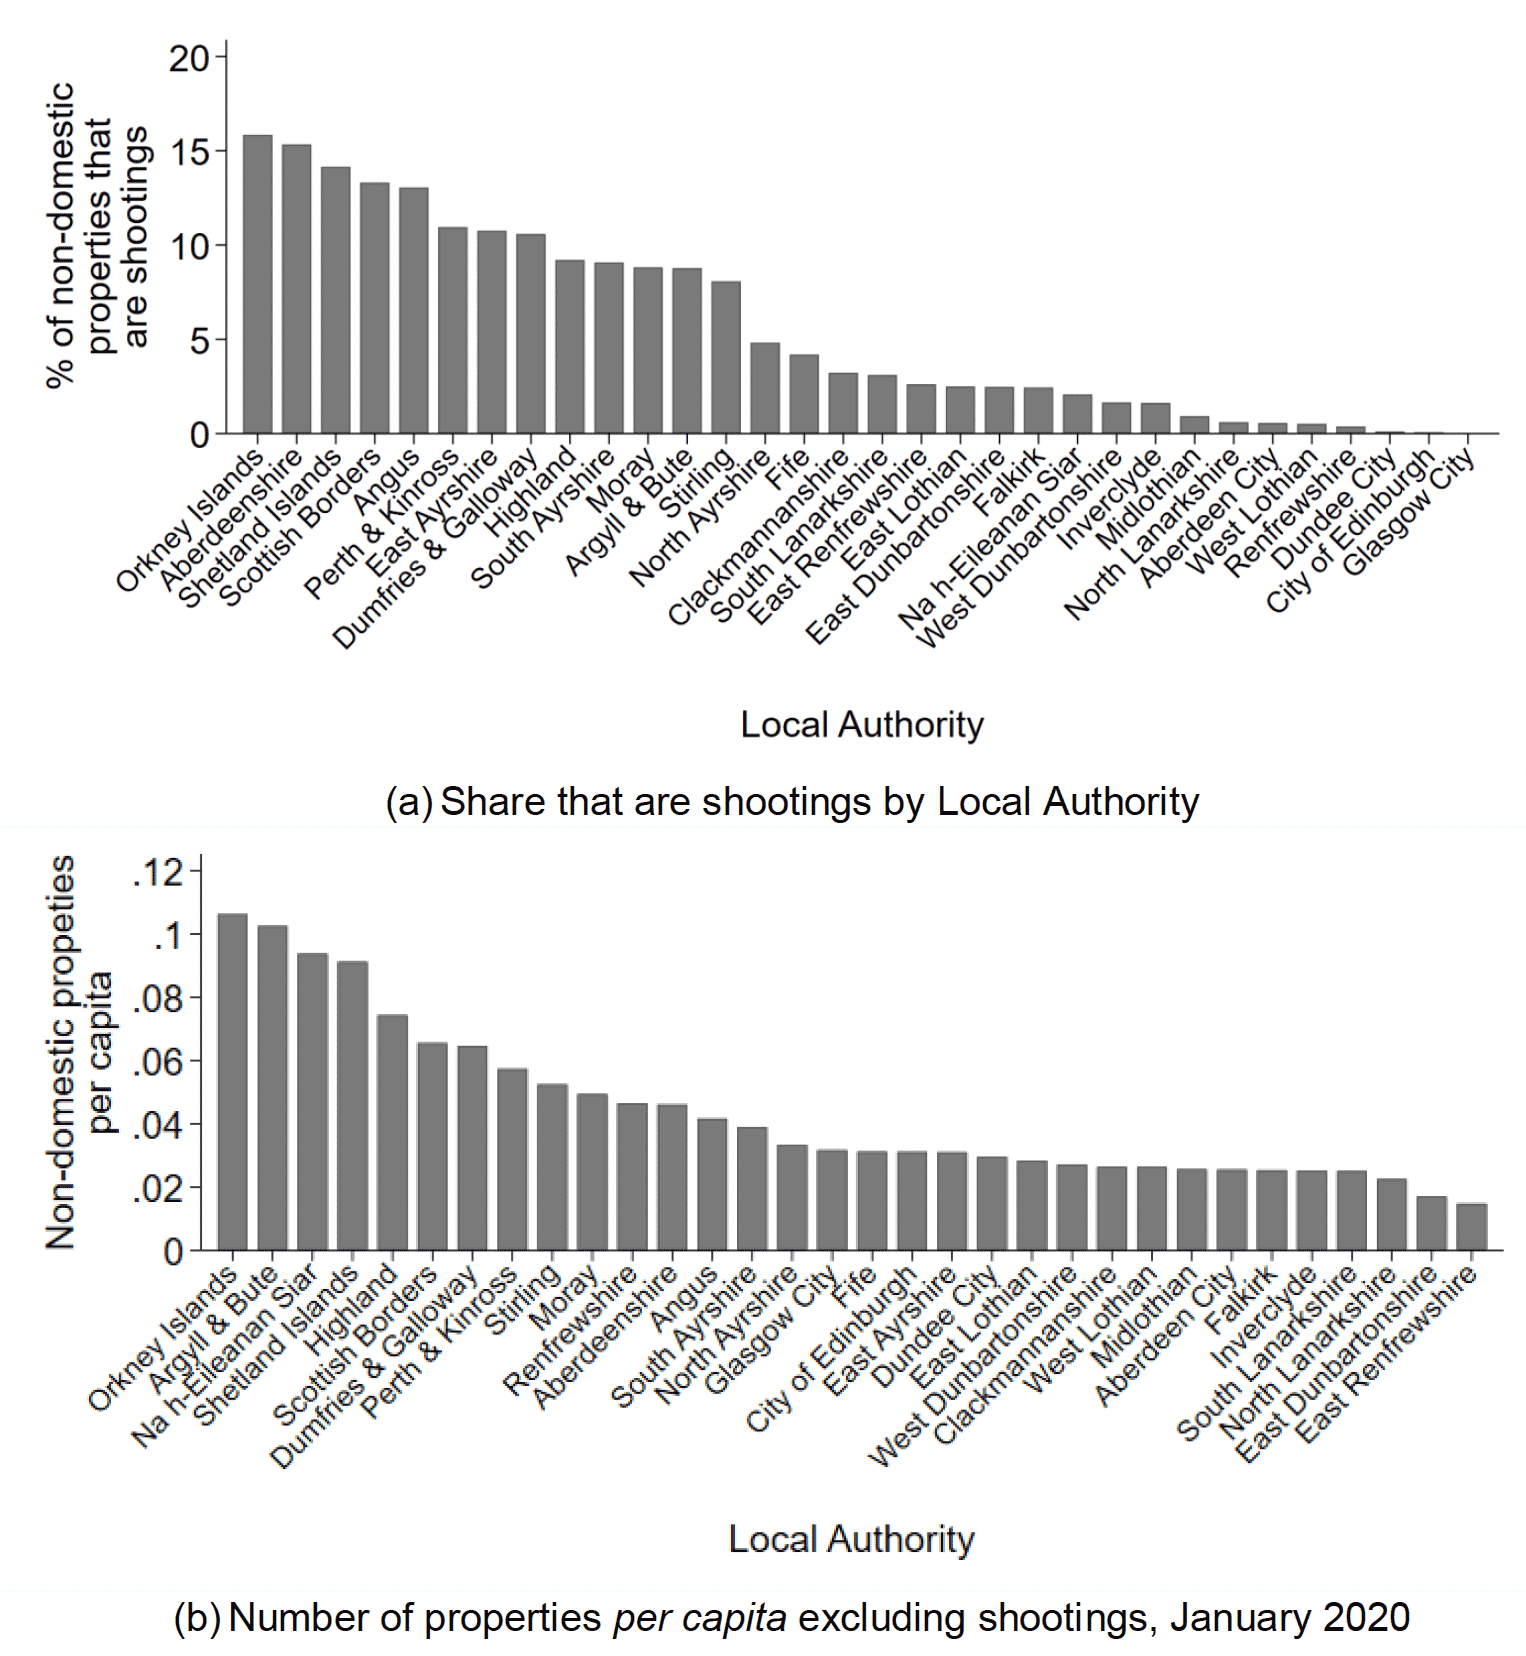
At 1 January 2020, there were 11,732 shootings on the VR, mostly found in rural local authorities. Figure 4.5 shows the share of non-domestic properties with an RV of at most £18,000 in each local authority that are shootings. Orkney Islands and Aberdeenshire have over 15% of their non-domestic properties recorded as shootings, and Shetland Islands, Scottish Borders and Angus have 13-14%. Figure 4.5 below shows that, when compared with Figure 4.4(a), excluding shootings affects per capita numbers of properties to a greater extent within these local authorities, but it does not significantly alter their broad rank in terms of this measure of property density. A more striking change arises when excluding shootings from Table 4.1. In this case, the share of non-domestic properties that are sporting subjects falls from 7.1% to 1.6%, giving them a similar share to garages and petrol stations.
| Overall | Single-site | Multi-site | ||||
|---|---|---|---|---|---|---|
| % | N | % | N | % | N | |
| Industrial subjects* | 20.9 | 43,349 | 21.4 | 23,497 | 20.3 | 19,852 |
| Shops | 19.9 | 41,310 | 26.2 | 28,838 | 12.8 | 12,472 |
| Offices | 17.4 | 36,076 | 12.9 | 14,165 | 22.4 | 21,911 |
| Leisure & Entertainment** | 11.2 | 23,283 | 13.4 | 14,735 | 8.7 | 8,548 |
| Other | 7.7 | 16,027 | 4.3 | 4,737 | 11.6 | 11,290 |
| Sporting subjects | 7.1 | 14,773 | 7.8 | 8,577 | 6.3 | 6,196 |
| Public Service subjects | 3.5 | 7,292 | 2.1 | 2,349 | 5.1 | 4,943 |
| Religious | 2.5 | 5,150 | 1.7 | 1,840 | 3.4 | 3,310 |
| Hotels etc. | 2.1 | 4,335 | 2.8 | 3,098 | 1.3 | 1,237 |
| Garages & Petrol Stations | 1.6 | 3,366 | 1.9 | 2,050 | 1.3 | 1,316 |
| Health & Medical | 0.9 | 1,907 | 1.2 | 1,314 | 0.6 | 593 |
| Advertising | 0.8 | 1,676 | 0.1 | 89 | 1.6 | 1,587 |
| Public Houses | 0.8 | 1,585 | 1.1 | 1,166 | 0.4 | 419 |
| Care Facilities | 0.6 | 1,292 | 0.4 | 439 | 0.9 | 853 |
| Cultural | 0.4 | 918 | 0.4 | 431 | 0.5 | 487 |
| Education & Training | 0.4 | 808 | 0.2 | 221 | 0.6 | 587 |
| Quarries, Mines, etc. | 0.2 | 503 | 0.1 | 109 | 0.4 | 394 |
| Statutory Undertaking | 0.2 | 459 | 0.1 | 124 | 0.3 | 335 |
| Communications | 0.1 | 219 | 0.0 | 53 | 0.2 | 166 |
| Petrochemical | 0.0 | 39 | 0.0 | 8 | 0.0 | 31 |
| Total | 100 | 207,721 | 100 | 110,011 | 100 | 97,710 |
Note: 'Overall' includes both single and multi-sites. * Industrial subjects includes factories, warehouses and stores; ** Leisure & Entertainment includes caravans and holiday sites. Appendix Table C.2 provides more detail on the types of properties included in each class.
4.2 The value of SBBS relief in Scotland
According to the most recently available Billing Snapshot data at the time of writing – from June 2019 – the total value of SBBS relief being received was roughly £266,468,000. Although we cannot attribute relief to single and multi-site groupings exactly, using the Scottish Government's estimates of businesses' site count suggests that around 78% of this total – some £208 million – was awarded to properties that were estimated to be part of a single-site business. The remaining £59 million was awarded to properties that were part of a multi-site business.
The vast majority of this NDR relief is received by properties with an RV below £15,000 and it is fairly evenly spread among those with RVs between £2,001 and £12,000. This pattern in the distribution of SBBS relief is consistent across site type, although it is slightly more concentrated among lower-RV properties that are part of a multi-site business (Figure 4.6(b)). This is in line with the fact there are more low-RV properties among those that are estimated to be part of a multi-site business.
Unsurprisingly given their prevalence among non-domestic properties, shops receive by far the most SBBS relief. From the data, we calculate this class of non-domestic property, whether part of a single or multi-site business, was in receipt of roughly £95.5 million of SBBS relief in June 2019. Industrial subjects (£61.8 million) and offices (£39.4 million) had the second and third highest total relief respectively. Although they have the highest total value, these property classes do not receive the highest average level of relief, however. The median level of relief among shops is roughly £2,600, compared with £4,900 for public houses. This is because public houses have, on average, higher RVs. Table 4.2 shows the total, mean, and median SBBS relief value and RV across property classes.
Geographically, in line with the distribution of non-domestic properties, Glasgow and Edinburgh benefit from the highest total value of SBBS relief. However, on a per capita basis, properties in Argyll and Bute, Na h-Eileanan Siar, Orkney Islands and Highland receive the most relief. These areas also have, on average, lower RV properties – the median RV among eligible properties in Argyll and Bute, for example, is £2,150 compared with £5,400 in Glasgow City.
Note: Properties are grouped into £2,000 RV bands. For example, the bar under £4,000 in each panel groups all properties with an RV of at least £2,001 and at most £4,000. Where part of a property is used for residential purposes, we deduct the value of this residential portion from its RV.
| Class | Total value of SBBS (£ million) | Mean value of SBBS (£) | Median value of SBBS (£) | Median RV (£) |
|---|---|---|---|---|
| Shops | 95.5 | 3,030 | 2,646 | 6,300 |
| Industrial subjects* | 61.8 | 2,228 | 1,764 | 3,600 |
| Offices | 39.4 | 2,232 | 1,764 | 4,500 |
| Leisure & Entertainment** | 26.8 | 1,419 | 1,029 | 2,200 |
| Hotels etc. | 11.6 | 3,285 | 2,940 | 6,500 |
| Garages & Petrol Stations | 5.8 | 2,264 | 1,813 | 4,050 |
| Sporting subjects | 5.7 | 586 | 282 | 550 |
| Public Houses | 5.7 | 4,621 | 4,900 | 12,500 |
| Health & Medical | 4.2 | 3,160 | 2,793 | 7,600 |
| Other | 3.6 | 1,085 | 588 | 550 |
| Public Service subjects | 3.3 | 2,037 | 1,495 | 4,050 |
| Cultural | 0.9 | 2,498 | 1,905 | 5,500 |
| Care Facilities | 0.8 | 2,594 | 2,046 | 7,400 |
| Education & Training | 0.5 | 2,815 | 2,470 | 7,100 |
| Statutory Undertaking | 0.4 | 3,269 | 3,001 | 6,025 |
| Religious | 0.4 | 1,843 | 1,495 | 200 |
| Quarries, Mines, etc. | 0.1 | 1,351 | 815 | 0 |
| Advertising | 0.1 | 735 | 559 | 1,650 |
| Communications | 0.05 | 1,592 | 588 | 600 |
| Petrochemical | 0.01 | 1,247 | 1,016 | 6,450 |
Note: *Industrial subjects includes Factories, Warehouses and Stores. **Leisure & Entertainment includes Caravans and Holiday Sites. Appendix Table C.2 provides more detail on the types of properties included in each class.
4.3 SBBS take-up
The 2019 Billing Snapshot data also allows us to produce crude estimates of take-up of SBBS relief – the proportion of what we believe to be eligible non-domestic properties actually in receipt of SBBS relief. To do so, we first identify three groups that define the rate of take-up:
1. properties that are eligible and receive SBBS relief: eligible claimers;
2. properties that are eligible and do not receive SBBS relief: eligible non-claimers; and
3. properties that are eligible, but claim another type of relief: eligible others.
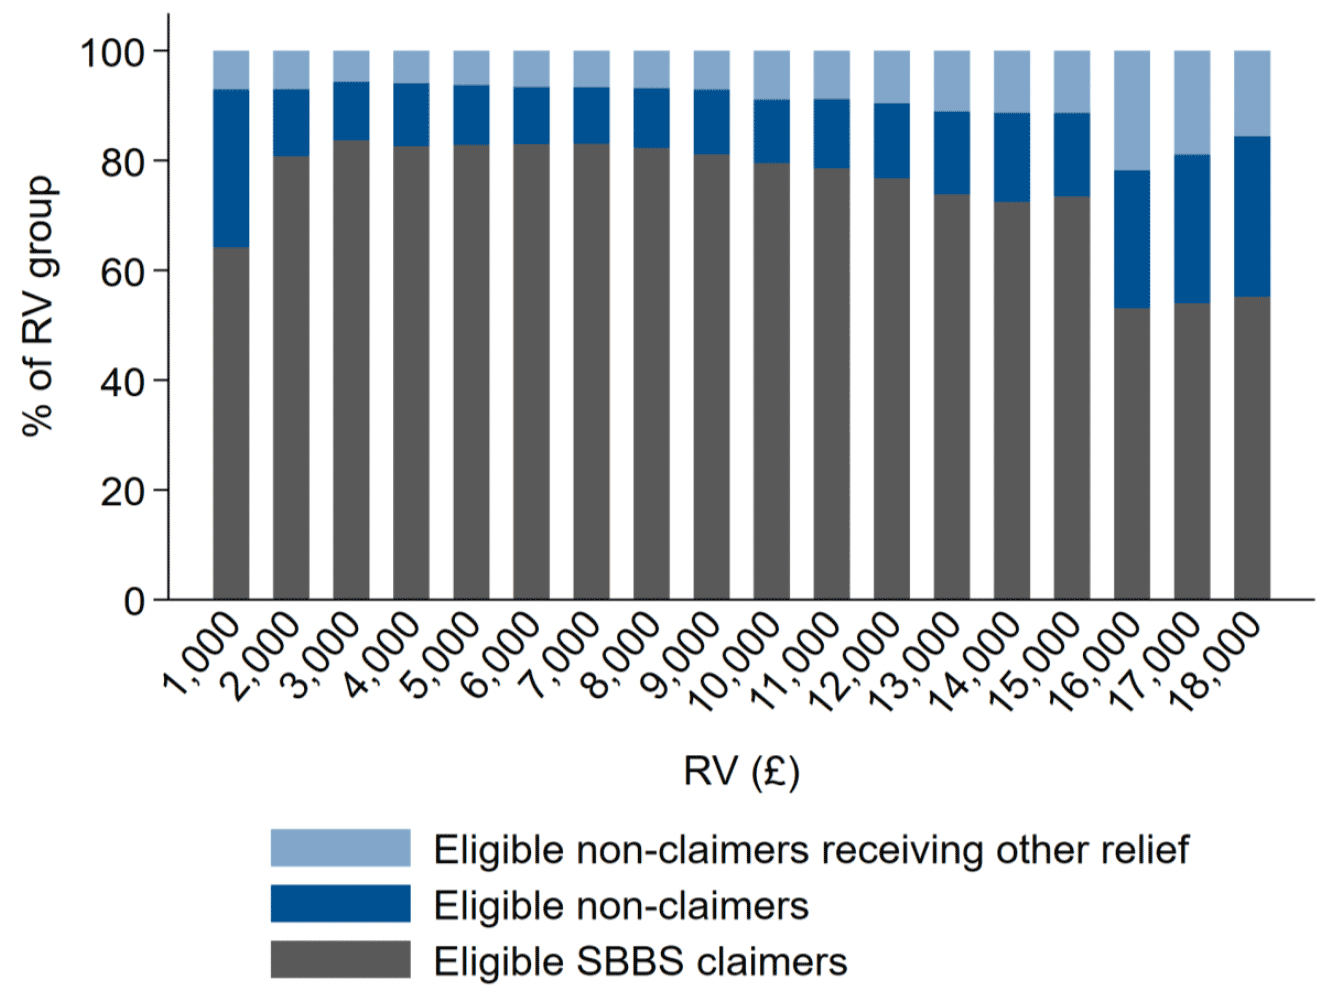
Figure 4.7 plots these three groups for properties that are part of a single-site business as a proportion of the total number of properties within each £1,000 RV band under £18,000. There are a considerable number of businesses that appear to be eligible but do not claim. This may be due to the business actually not claiming, but it could also be attributed to the limitations of the data which mean that we cannot be certain businesses have been accurately identified.[20] Indeed, we take this as partial evidence that there is considerable inaccuracy in identifying businesses from the data.
A particularly large proportion of those properties with an RV of less than £1,000 do not claim SBBS support. This is likely due to the types of property that make up this group perhaps being less likely to claim relief: sporting subjects – which include fields, pitches and tracks – make up over a third of these properties compared with only 8% in the total population of eligible single-property businesses. These types of low-RV property are also more likely to claim empty property relief – 12.5% of those with an RV of £1,000 or less claim relief for unoccupancy compared with 7.4% of all those with an RV greater than £1,000. This is likely an artefact of the eligibility rules for empty property relief: any unoccupied property with an RV less than £1,700 is entitled to 100% NDR relief, whereas the rules for this relief differ for those with an RV over this threshold.[21]
The proportion of those eligible for SBBS relief but not claiming remains largely constant for RVs up to £15,000 (excepting those in the 0-£1,000 category just discussed). There is a noticeable increase in eligible non-claimers for RVs between £15,001 and £18,000, along with an increase in businesses claiming other relief(s). Although it is not possible to tell from the data, the lower take-up rate in this cohort might be a result of decreased incentives to apply for support considering the substantial drop from 100% to 25% relief as the £15,000 threshold is reached. In addition, as the RV of properties increases, it becomes more likely that if properties have not been correctly linked to larger multi-site businesses, the business the property is actually attributable to is ineligible because its cumulative RV exceeds £35,000.
Note: Properties are grouped into £1,000 RV bands. For example, the bar between £1,001 and £2,000 groups all properties with an RV of at least £1,001 and at most £2,000. Where part of a property is used for residential purposes, we deduct the value of this residential portion from its RV.
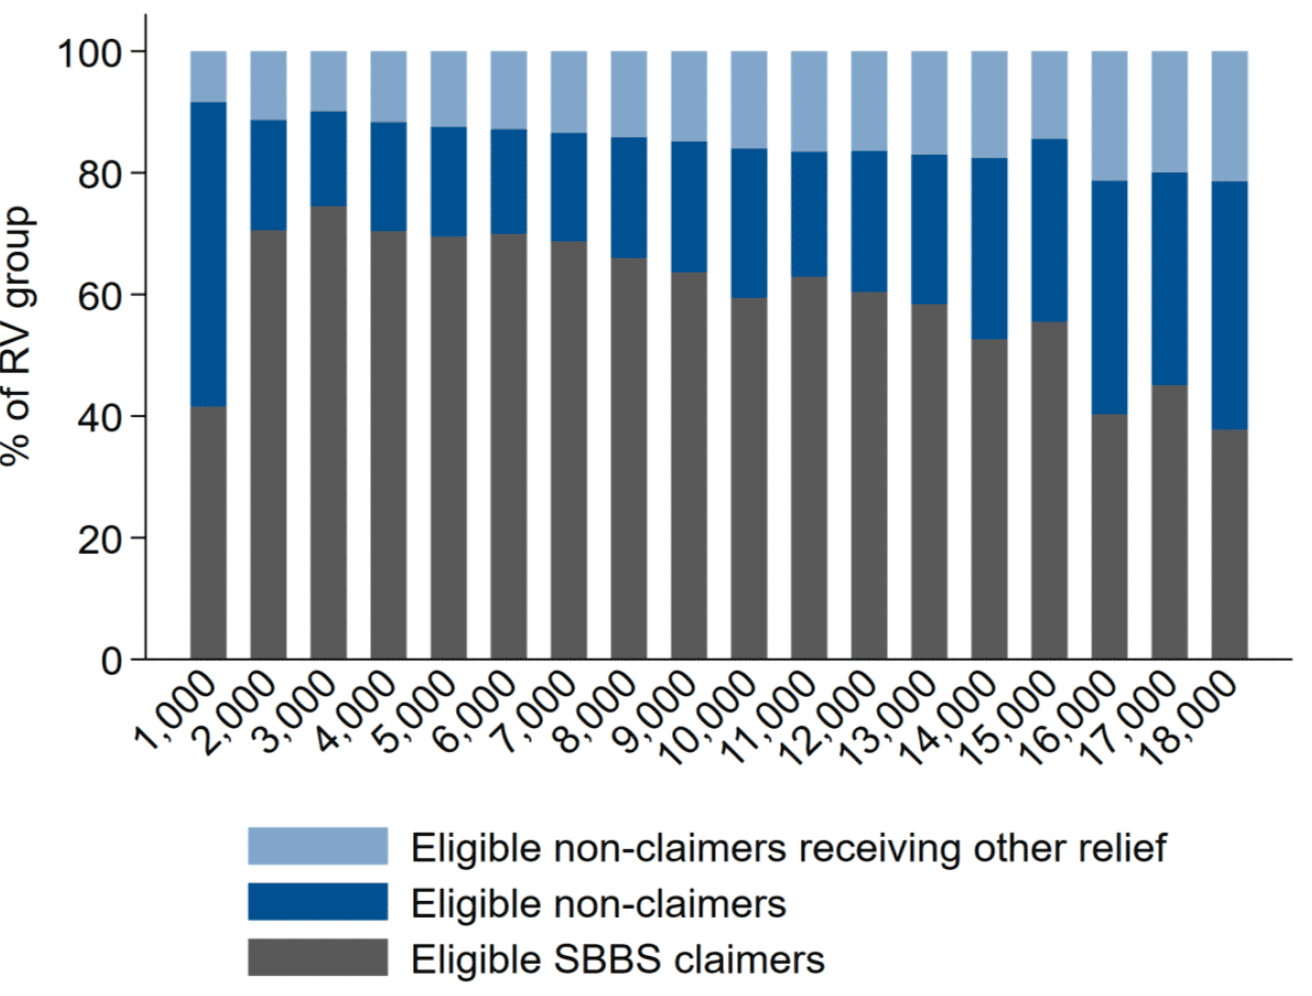
Although broadly similar, the pattern across the RV distribution is less clear for properties that are identified as being part of a multi-site business (Figure 4.8). When analysing take-up among these types of properties, it must again be borne in mind that there is uncertainty surrounding their identification as a multi-site – defining eligibility depends on knowledge of businesses' total RV across all properties. As a result, the proportion of eligible non-claimers in each RV band might be over- or underestimated.
Note: Properties are grouped into £1,000 RV bands. For example, the bar between £1,001 and £2,000 groups all properties with an RV of at least £1,001 and at most £2,000. Where part of a property is used for residential purposes, we deduct the value of this residential portion from its RV.
Table 4.3 first shows the distribution of SBBS claimers across classes of properties for properties part of both single and multi-site businesses combined. It shows that by far the most common properties to receive SBBS relief are those used as shops, industrial subjects, leisure and entertainment facilities, and offices. This is unsurprising given these are also the most common types of eligible non-domestic property in Scotland (Table 4.1), and the classes that receive the most relief (Table 4.2).
For properties that constitute a single-site business, the highest rate of take-up, at 92%, is among hotels and similar properties, closely followed by those used for shops, leisure and entertainment, and garages and petrol stations (Figure 4.9). Industrial subjects and offices have lower take-up rates at around 83% and 75% respectively. Take-up rates are generally lower across most property types for multi-sites, as is the broad pattern in engagement. This could suggest that these types of properties are those that are most likely not to be identified as part of a larger business chain. Again, we calculate the take-up rates in Figure 4.9 based on estimates of whether a property is part of a single or multi-site business.
| Number of properties | Percent | |
|---|---|---|
| Shops | 27,178 | 26.60 |
| Industrial subjects* | 23,218 | 22.73 |
| Leisure & Entertainment** | 16,894 | 16.54 |
| Offices | 13,720 | 13.43 |
| Sporting subjects | 9,107 | 8.91 |
| Hotels etc. | 3,097 | 3.03 |
| Other | 2,758 | 2.70 |
| Garages & Petrol Stations | 2,198 | 2.15 |
| Public Service subjects | 1,057 | 1.03 |
| Health & Medical | 1,033 | 1.01 |
| Public Houses | 883 | 0.86 |
| Cultural | 261 | 0.26 |
| Care Facilities | 248 | 0.24 |
| Religious | 140 | 0.14 |
| Education & Training | 127 | 0.12 |
| Statutory Undertaking | 87 | 0.09 |
| Quarries, Mines, etc. | 63 | 0.06 |
| Advertising | 63 | 0.06 |
| Communications (non-formula) | 23 | 0.02 |
| Petrochemical | 2 | 0.00 |
| Total | 102,157 | 100 |
Note: *Industrial subjects includes factories, warehouses and stores. **Leisure & Entertainment includes caravans and holiday sites. Table includes all properties, part of both single and multi-site businesses.
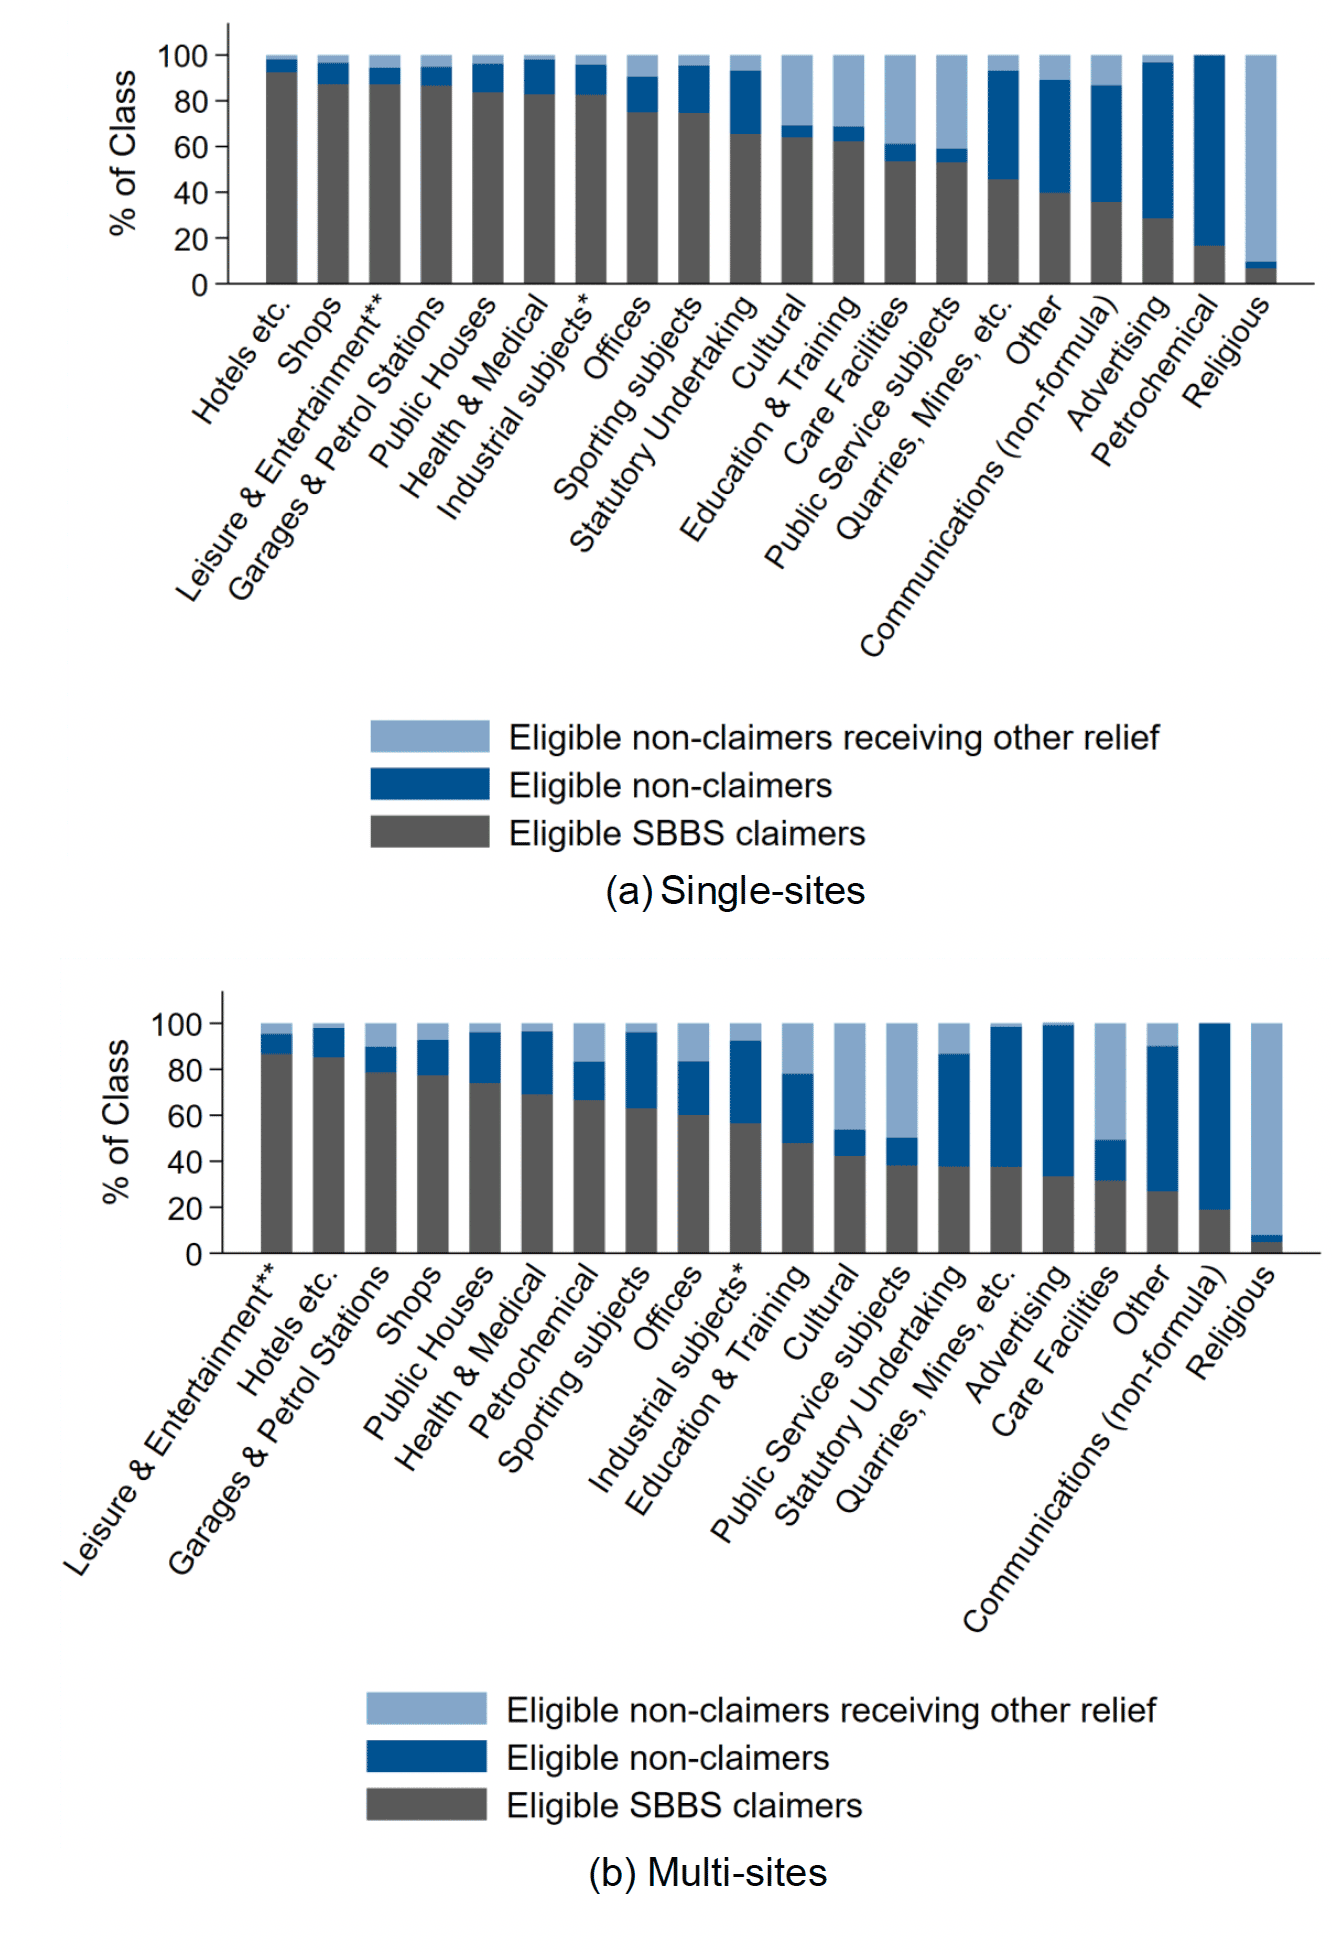
When looking at the rate of take-up across different local authorities, take-up of eligible claimants ranges from roughly 64% (Renfrewshire) to 87% (Dundee City) for single-site businesses, and 14% (Renfrewshire) to 80% (Orkney Islands) for properties part of a multi-site business. Again, the multi-site take-up rates are subject to a considerable degree of uncertainty. There does not appear to be a strong relationship between the prevalence of non-domestic properties and take-up rates, given that of the five local authorities with either the highest number of properties or value of SBBS relief per capita – Argyll and Bute, Na h-Eileanan Siar, Orkney Islands, Highland, and the Shetland Islands – only Orkney Islands is among the ten regions with the highest take-up rate. This is true for both single and multi-sites (see Table 4.4).
| Single-sites (%) | Multi-sites (%) | |||||
|---|---|---|---|---|---|---|
| Local Authority | Eligible Claimers | Eligible Non-claimers | Eligible, claiming other | Eligible Claimers | Eligible Non-claimers | Eligible, claiming other |
| Aberdeen City | 67.78 | 25.06 | 7.16 | 49.64 | 41.12 | 9.25 |
| Aberdeenshire | 82.89 | 8.86 | 8.25 | 58.66 | 30.96 | 10.39 |
| Angus | 85.77 | 6.24 | 7.99 | 69.9 | 12.9 | 17.2 |
| Argyll & Bute | 75.38 | 20.12 | 4.5 | 66.39 | 23.97 | 9.64 |
| City of Edinburgh | 78.89 | 14.51 | 6.6 | 57.9 | 28.52 | 13.58 |
| Clackmannanshire | 78.55 | 16.85 | 4.6 | 58.8 | 26.41 | 14.79 |
| Dumfries & Galloway | 78.53 | 14.11 | 7.37 | 64.93 | 26.62 | 8.45 |
| Dundee City | 86.48 | 7.41 | 6.11 | 62.96 | 19.69 | 17.35 |
| East Ayrshire | 78.95 | 13.53 | 7.52 | 62.44 | 26.97 | 10.59 |
| East Dunbartonshire | 80.98 | 13.2 | 5.82 | 75.08 | 18.24 | 6.69 |
| East Lothian | 81.89 | 6.18 | 11.92 | 70.33 | 10.33 | 19.33 |
| East Renfrewshire | 80.45 | 9.43 | 10.11 | 63.77 | 18.49 | 17.74 |
| Na h-Eileanan Siar | 78.54 | 7.37 | 14.09 | 67.15 | 15.38 | 17.47 |
| Falkirk | 81.57 | 11.45 | 6.98 | 70.53 | 23.06 | 6.41 |
| Fife | 85.34 | 9.12 | 5.54 | 70.01 | 17.25 | 12.74 |
| Glasgow City | 76.83 | 13.84 | 9.33 | 63.45 | 21.05 | 15.5 |
| Highland | 80.15 | 12.77 | 7.08 | 67.25 | 21.26 | 11.5 |
| Inverclyde | 78.22 | 11.87 | 9.91 | 66.57 | 21.53 | 11.9 |
| Midlothian | 74.5 | 15.42 | 10.09 | 65.12 | 19.48 | 15.4 |
| Moray | 79.13 | 12.15 | 8.73 | 55.9 | 33.05 | 11.05 |
| North Ayrshire | 84.92 | 8.64 | 6.43 | 72.97 | 14.53 | 12.5 |
| North Lanarkshire | 76.15 | 14.58 | 9.27 | 65.73 | 22.44 | 11.83 |
| Orkney Islands | 86.01 | 4.88 | 9.11 | 80.39 | 5.56 | 14.05 |
| Perth & Kinross | 79.96 | 14.46 | 5.58 | 61.78 | 28.95 | 9.27 |
| Renfrewshire | 64.42 | 26.13 | 9.45 | 14.36 | 81.31 | 4.32 |
| Scottish Borders | 84.22 | 5.95 | 9.83 | 76.23 | 10.34 | 13.43 |
| Shetland Islands | 72.8 | 6.49 | 20.71 | 62.56 | 11.35 | 26.09 |
| South Ayrshire | 78.77 | 12.58 | 8.65 | 68.08 | 20.04 | 11.88 |
| South Lanarkshire | 72.2 | 23.95 | 3.85 | 57.81 | 35.67 | 6.51 |
| Stirling | 82.32 | 11.7 | 5.99 | 69.22 | 25.53 | 5.25 |
| West Dunbartonshire | 79.96 | 13.81 | 6.24 | 64.25 | 24.75 | 11 |
| West Lothian | 78.06 | 10.86 | 11.07 | 63.3 | 20.41 | 16.29 |
4.4 The interaction of the SBBS with other reliefs
There are two broad types of NDR reliefs: mandatory and discretionary. Mandatory reliefs are fully funded by the Scottish Government and are awarded to businesses operating in any eligible property. There are also mandatory reliefs for properties used to care for people with disabilities or in small, sparsely populated rural areas. Discretionary reliefs are 75% centrally-funded and are used, as the name suggests, at the discretion of local authorities to award new reliefs or to top-up mandatory reliefs.[22]
In analysing SBBS take-up, we identified a group of eligible properties that claimed alternative reliefs. One question might be whether or not businesses that receive SBBS relief might be eligible for other reliefs in its absence. In the 2019 Billing Snapshot data, there are around 8,000 properties with an estimated total business RV below £15,000 that received 100% exemption from mandatory rates reliefs that were not the SBBS. This compared with around 102,000 properties in the same RV range that received full relief from the SBBS. The most common alternative relief is for unoccupancy, followed by charity and religious reliefs, shown in Figure 4.10. This is true regardless of whether we consider single and multi-sites together or separately.
Given that properties qualifying for SBBS relief are, in the majority, occupied, and operating for profit, these alternative mandatory supports would not be available to almost all those receiving SBBS relief, though there may be a small number of religious or charity-affiliated businesses receiving SBBS relief.[23] Mandatory sports relief might be available to some of those non-domestic properties classed as sporting subjects, however, this group only makes up around 9% of properties eligible for 100% SBBS relief (See Table 4.3 in Section 4.3). Rural relief might be a substitute for SBBS relief for some businesses, however the number of properties meeting the criteria for rural support is likely to be small. It is therefore unlikely that the suite of available mandatory reliefs would cover large swathes of this group in the absence of SBBS relief, or if the policy was altered significantly.
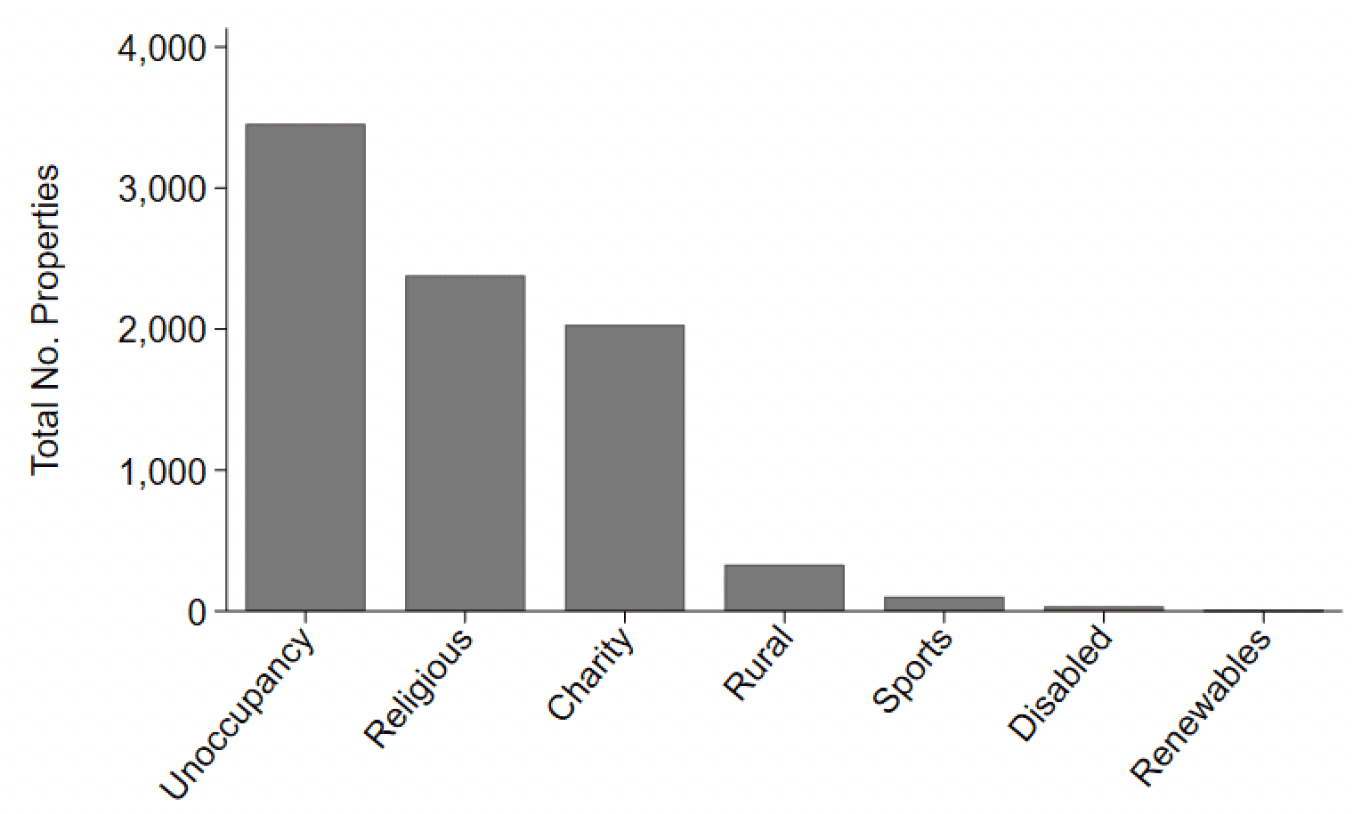
Note: The graph includes all properties eligible for 100% SBBS relief based on their RV.
The discretionary reliefs, which are generally only 75% centrally-funded, are similarly exclusive in that very few properties would be eligible.[24] A more directed question might be the extent to which other reliefs would cover those who need rates relief the most. Given the complex nature of the eligibility criteria for many of the alternative reliefs, and the lack of data on businesses operating within properties, it is not possible to examine such a question in more detail.
4.5 Have things changed over time?
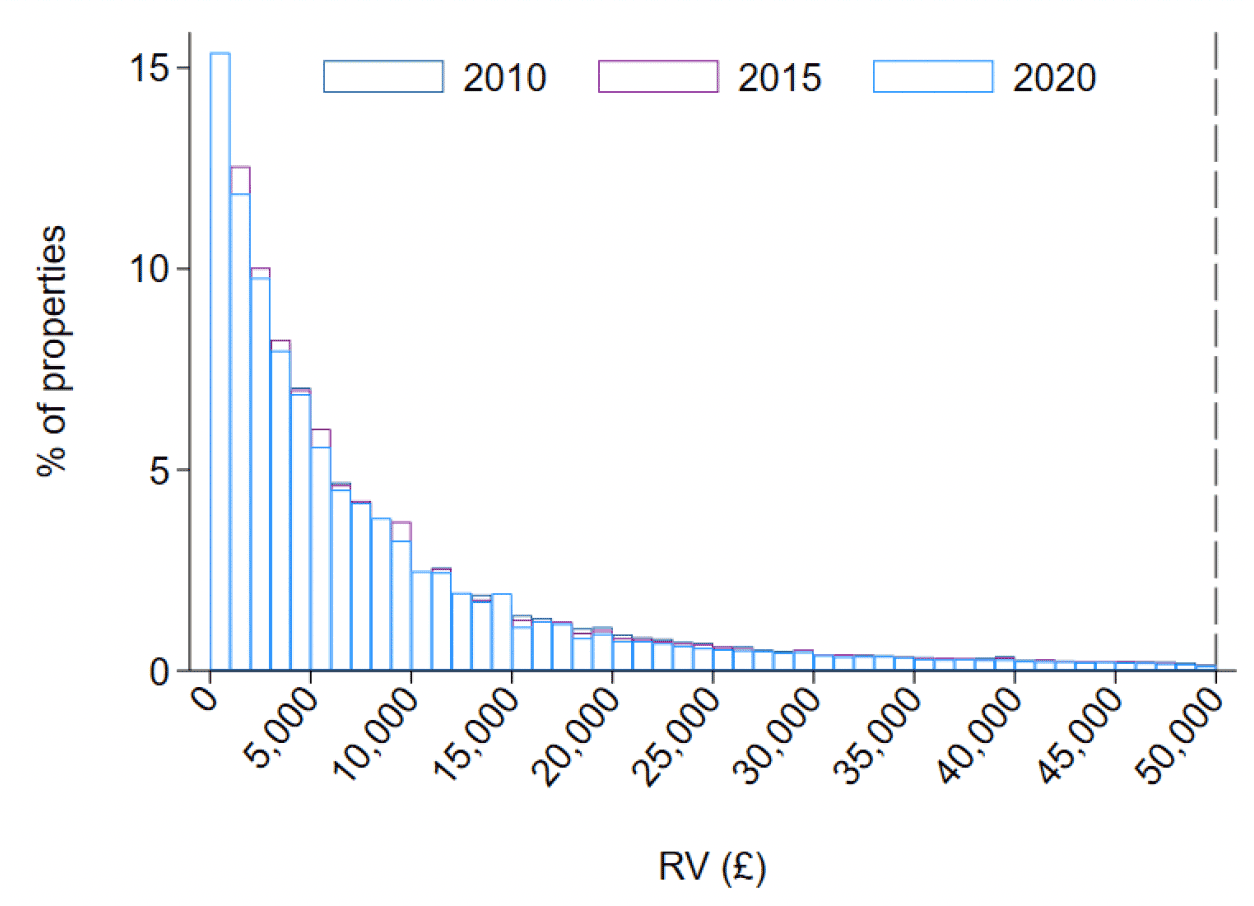
Given that we have the VR, PTOA dataset and Billing Snapshot data as far back as 2009, we are able to examine how many aspects of the small business base and its interaction with the SBBS have changed over time. In Figure 4.11 we first show how the distribution of non-domestic properties compares in 2010, 2015, and 2020.
Between 2010 and 2020 there has been a gradual increase in the overall number of non-domestic-properties in Scotland: there were 41,703 (19.6%) more properties in the VR in January 2020 than in 2010. This growth has been coupled with an increase in the number of properties eligible for SBBS relief: 91% of the new properties have an RV below £15,000.[25] Importantly, in Figure 4.11 the distribution of properties in 2020 includes shootings, which contributes to the seemingly large increase in properties with an RV between £0 and £1,000.
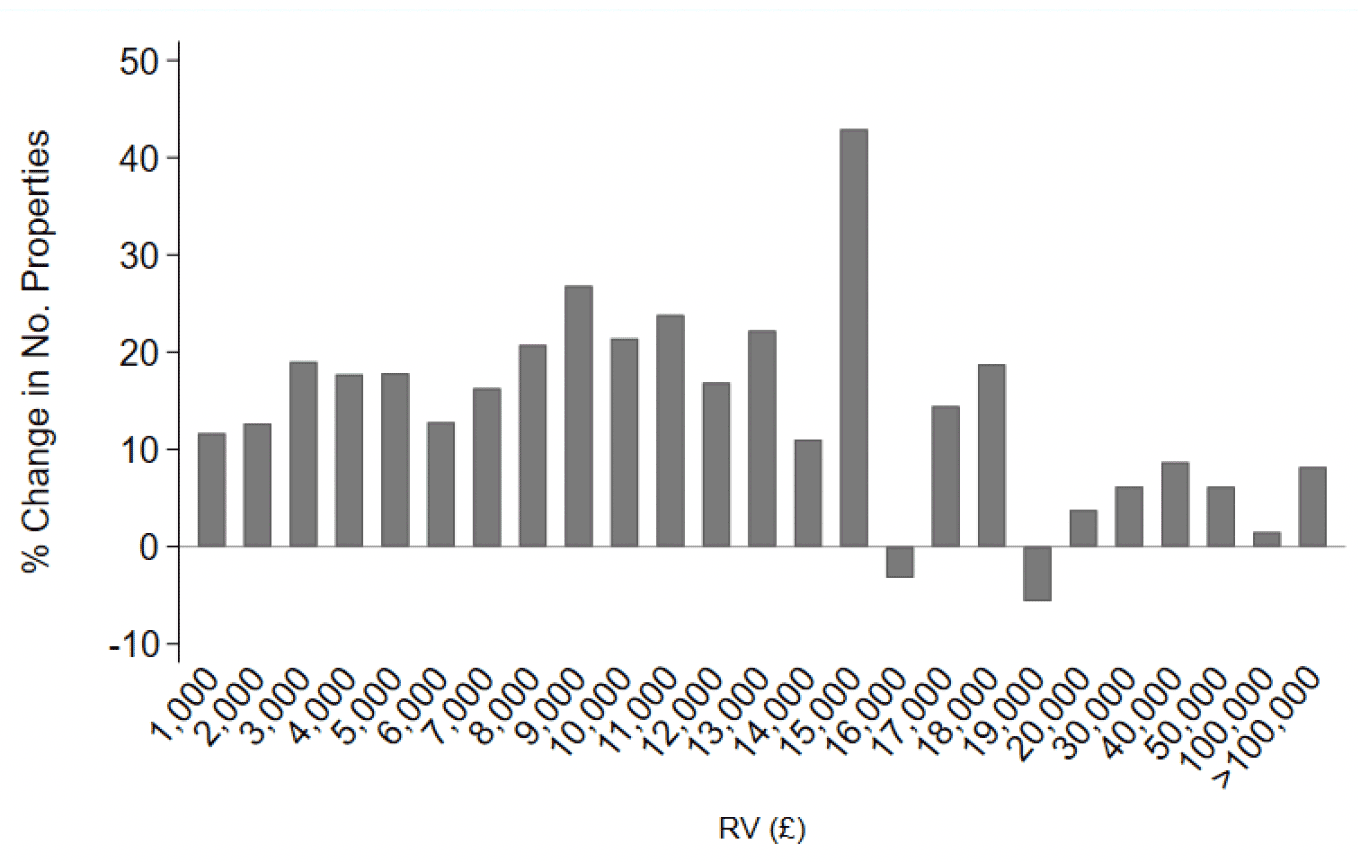
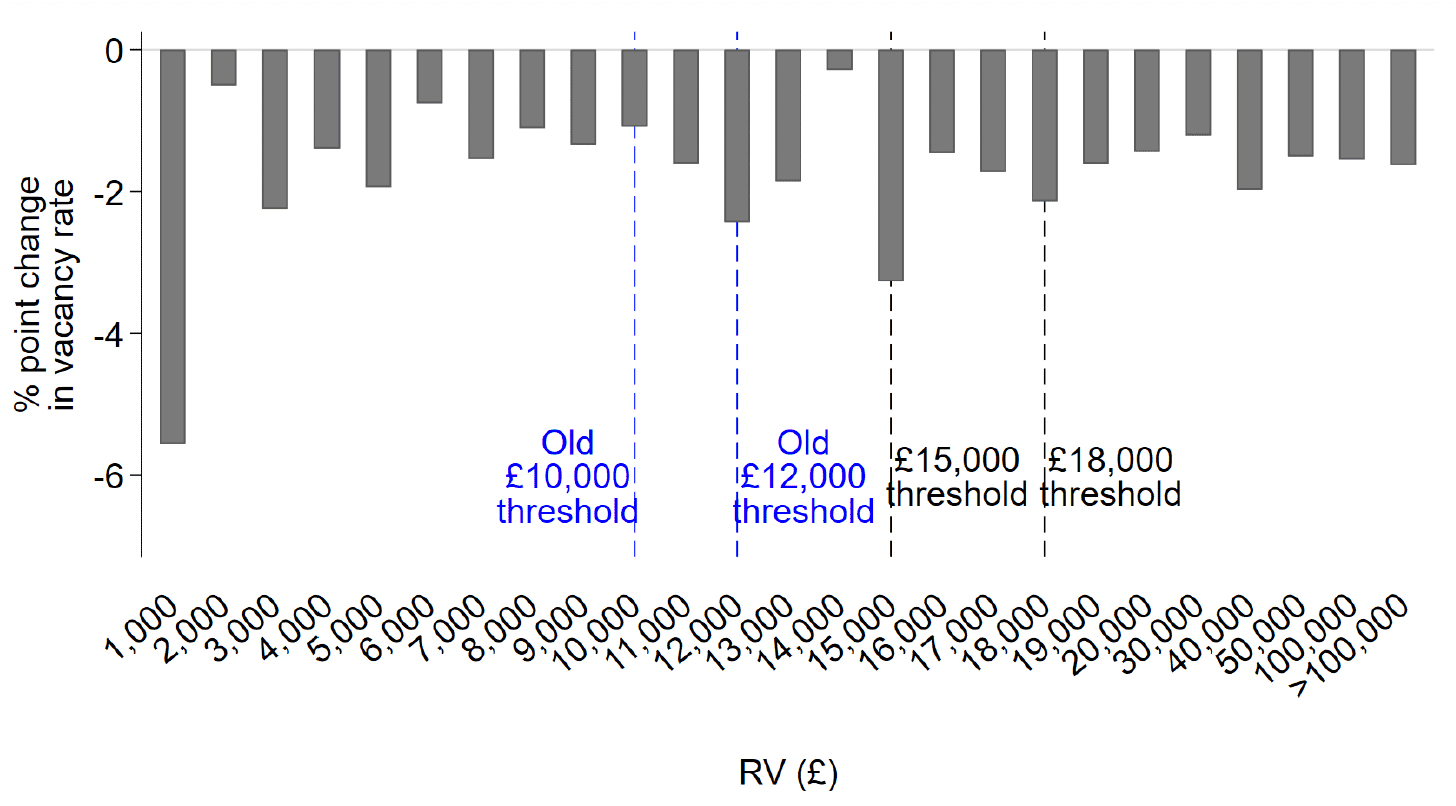
Figure 4.12 then shows the change in the number of properties across the RV distribution and the percentage change in the number of properties within each £1,000 grouping of properties over time. It highlights that the increase in non-domestic properties has been driven by an increased number of those that have a relatively low RV. The figure also shows that the largest percentage change in the number of non-domestic properties between 2010 and 2020 came among those valued between £14,000 and £15,000, just below the threshold for 100% relief that was established in 2017 (consistent with our identification of bunching around the £15,000 threshold in Figure 4.2).
It also shows that the growth in the number of properties among those whose RV is just above both current policy thresholds – £15,001-£16,000 and £18,001-£19,000 – was negative over the period. These were the only two groups that declined in size. Unlike Figure 4.11, Figure 4.12 now excludes shootings given they were only added to the VR in 2017. Considering this addition results in growth in the 0-£1,000 RV band increasing by close to 40%. This is a result of shootings having, on average, very low RVs.
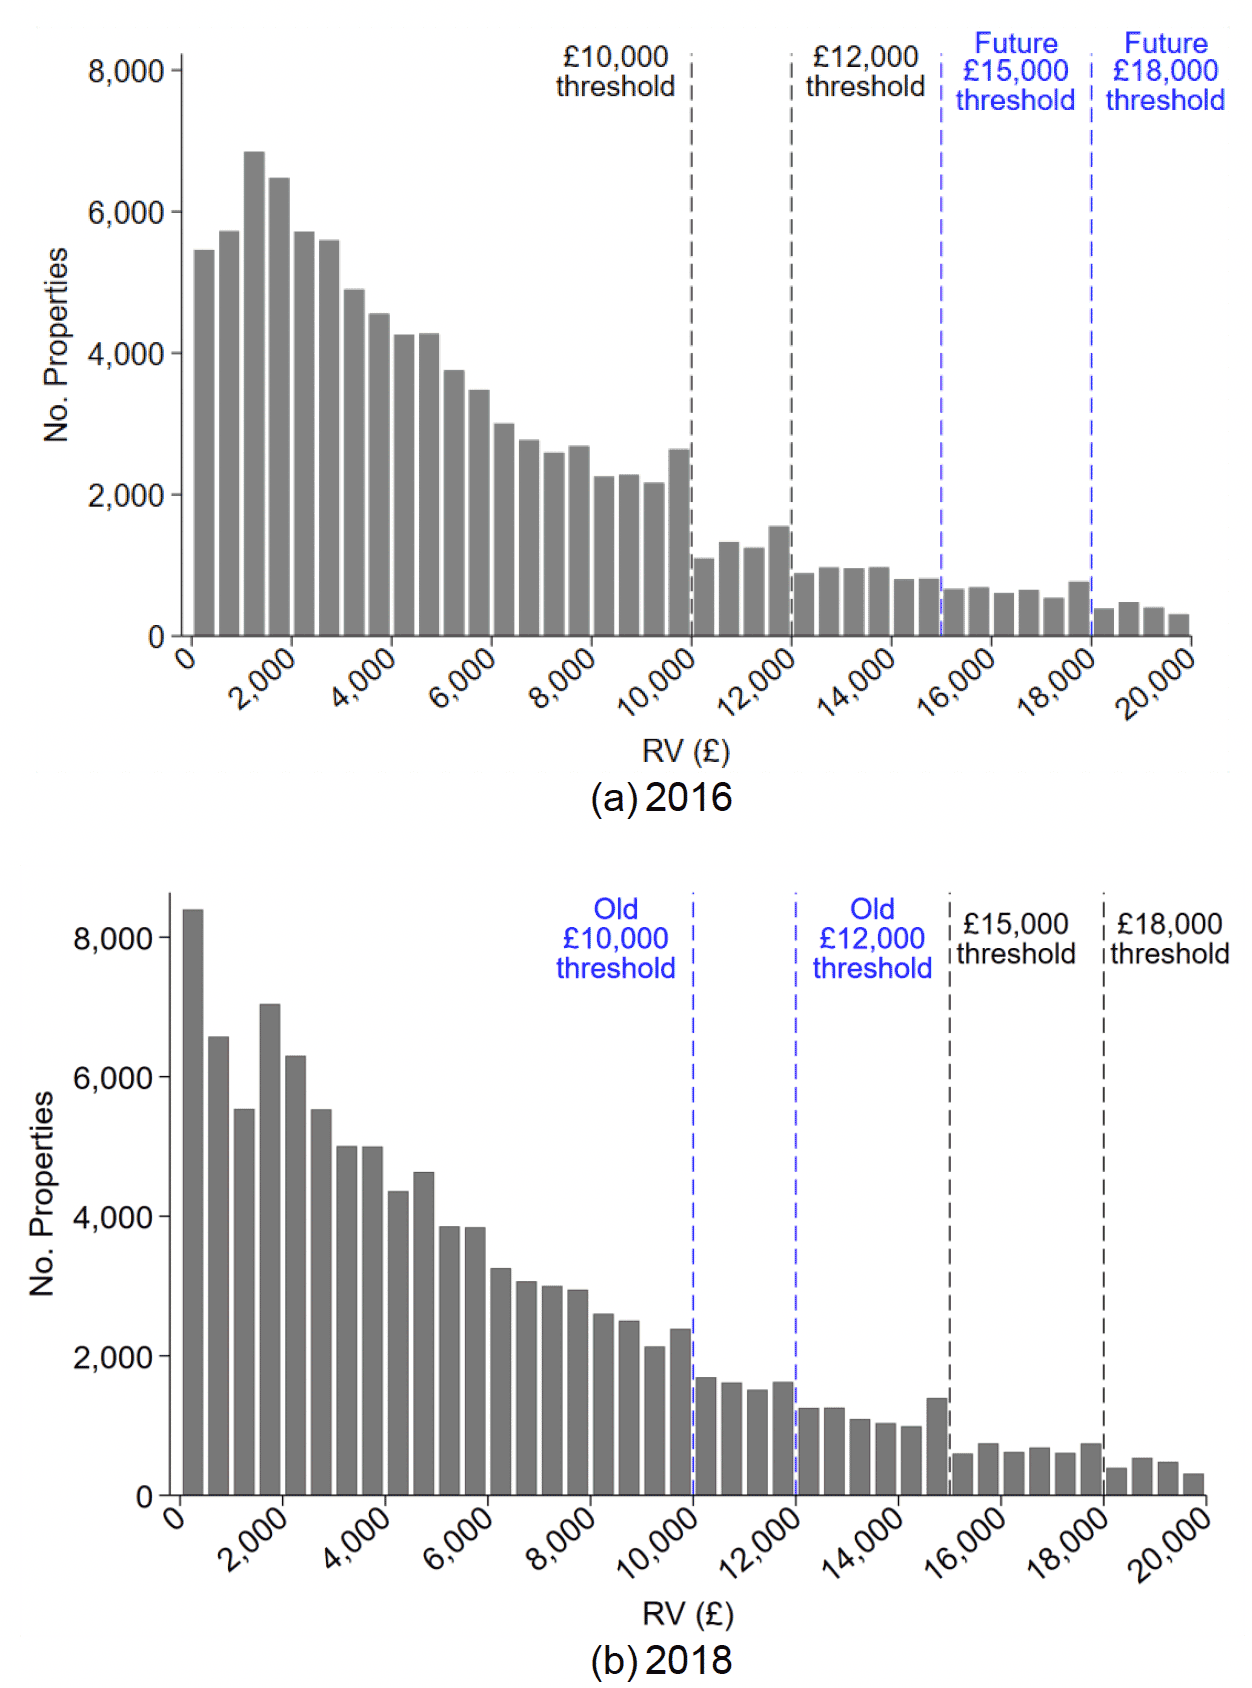
This bunching around the thresholds – which we have referred to several times – can be clearly seen by focusing in on the lower end of the distribution of properties, and by comparing the distribution of non-domestic properties before and after the 2017 policy change. Figure 4.13 shows the distribution of non-domestic properties that were estimated to be part of a single-site business in 2016 and 2018, before and after the changes to the SBBS thresholds respectively. It shows two things. Firstly, in 2016 there are clear spikes in the number of properties valued just below the policy thresholds active at that time (£10,000; £12,000; and £18,000), but no discernible spike at an RV of £15,000. Secondly, it shows that as new thresholds were introduced in 2017, a new spike at the £15,000 threshold appears in the data that did not exist previously, and the spikes around the old thresholds (at £10,000 and £12,000) became smaller.
Note: The graph includes all properties, part of both single and multi-site businesses. For example, the bar between £1,001 and £2,000 groups all properties with an RV of at least £1,001 and at most £2,000. Where part of a property is used for residential purposes, we deduct the value of this residential portion from its RV.
Figure 4.13, combined with Figures 4.11 and 4.12 presents evidence that there is bunching of properties around the policy thresholds that results from their location along the RV distribution. Potential reasons include, amongst other factors, properties being constructed to fit within the thresholds; the RV of properties being assessed to fit within the thresholds; and properties the RV of which is assessed to be above the thresholds engaging in an appeal process which then results in the property being revalued to below the threshold. We discuss the latter of these explanations in more detail in Section 4.7, however we unfortunately cannot know the extent to which the other two factors contribute.
The overall increase in the number of properties has been driven by increases in five classes of property: sporting subjects, industrial subjects, offices, leisure and entertainment and those without a standard classification, combined into an "other" category (see Appendix Table C.2 for a description of property classes). As we outlined in Section 4.1, the current prevalence of sporting subjects is a result of the introduction of shootings to the Valuation Roll from 2017. This change has also driven the growth in the number of sporting subjects between 2010 and 2020, and is responsible for 28% of the overall increase in domestic properties in Scotland over the same period.
Note: The graph includes all properties, part of both single and multi-site businesses, excluding shootings. Properties are grouped in £1,000 RV bands. For example, the bar between £1,001 and £2,000 groups all properties with an RV of at least £1,001 and at most £2,000. Where part of a property is used for residential purposes, we deduct the value of this residential portion from its RV.
Sporting subjects, industrial subjects, offices, leisure and entertainment and the "other" properties category all have a median RV lower than the overall mean among all SBBS eligible properties. For example, the inclusion of shootings has meant that sporting subjects have increased in number by almost 12,000 over the past decade (a roughly 400% increase). These properties have a median RV of roughly £600 compared with £3,700 among all those properties with an RV of £18,000 or less.
Note: The graph includes all properties, part of both single and multi-site businesses. Properties are grouped in £500 RV bands. For example, the bar between £2,001 and £2,500 groups all properties with an RV of at least £2,001 and at most £2,500. Where part of a property is used for residential purposes, we deduct the value of this residential portion from its RV.
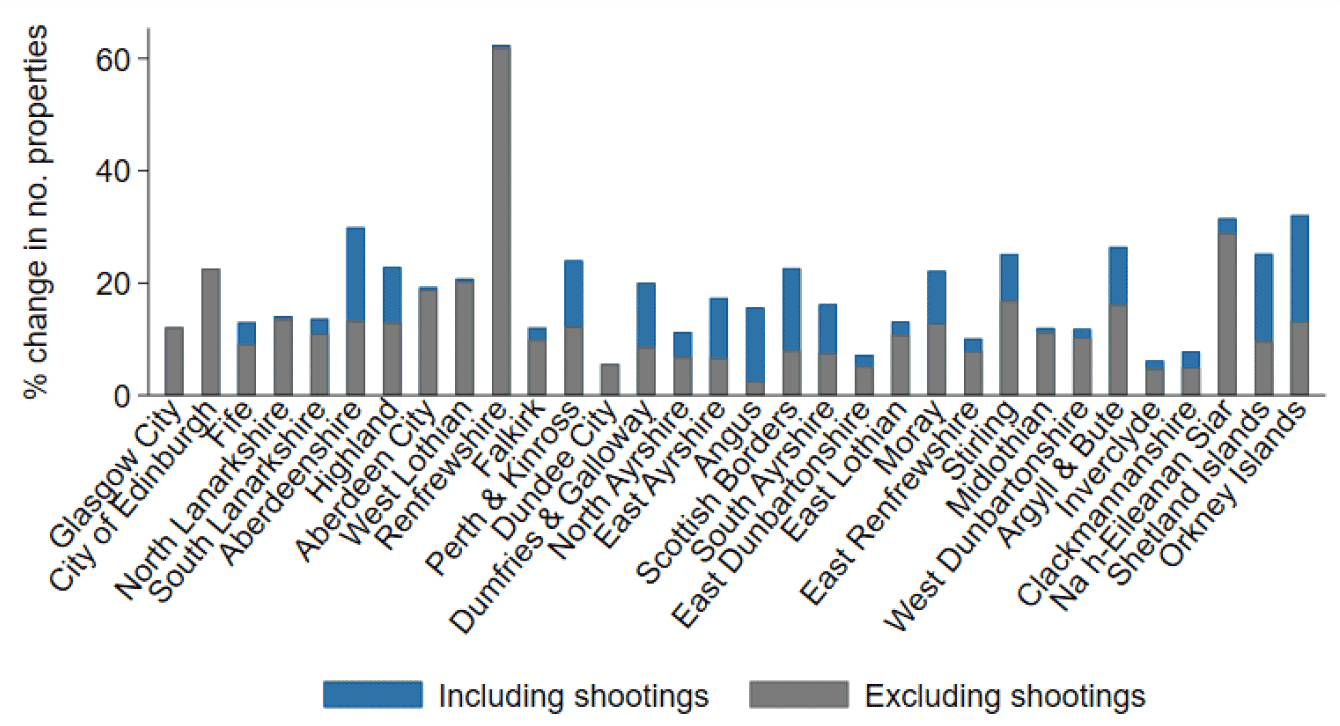
The increase in non-domestic properties has also varied geographically. Figure 4.14 shows that Renfrewshire, the outlier, has experienced over a 60% increase in its non-domestic property base in the past decade. Whilst there does not appear to be a strong relationship between growth in the number of non-domestic properties and population, areas such as the Orkney Islands, Na h-Eileanan Siar, Argyll and Bute and the Shetland Islands, which are among the areas with the most non-domestic properties and expenditure on SBBS relief per capita, have experienced the highest growth in properties.
Given we showed in Figure 4.5 that the location of shootings – which, as mentioned, were only required to be included in the VR by law from April 2017– is dependent on geographical location, Figure 4.14 also shows the growth in non-domestic properties between 2010 and 2020 when excluding these properties, represented by the grey portion of the bars. Unsurprisingly, the growth in non-domestic properties in areas like Aberdeenshire, Highland, Perth and Kinross, and Dumfries and Galloway is drastically reduced by doing so.
Take-up of SBBS relief has also broadly increased over time. Figure 4.15a plots our estimates of the proportion of both eligible single-site and multi-site businesses that claim SBBS relief in each year for which we have Billing Snapshot data. Between 2011 and 2019, this proportion has increased more for the latter group, which we estimate has consistently had a lower rate of take-up relative to the single-sites. Again, however, it must be noted that eligibility is difficult to define here given the uncertainty surrounding groupings of properties into businesses and their resultant total RV.
Figure 4.15b also shows estimates of SBBS take-up excluding shootings. If these types of property have a particularly high rate of take-up, then the increase shown in 4.15a might be driven by their inclusion in the VR. The figure shows that imposing this restriction results in only very small changes to our estimates of take-up rates. Shootings that are estimated to be part of a single-site business have a slightly lower take-up rate than the overall population (73.6% vs 76.1%), whereas those that are part of a multi-site business are more likely to be eligible claimers (73.5% vs 61%). The number of shootings is relatively small, however, meaning they do not significantly change estimates of the overall take-up.
The data also shows that there has been a decrease in the proportion of properties classed as vacant over time, particularly since 2016. Figure 4.16 plots the proportion of properties classed as vacant by assessors in the VR in each year for which we have data. This line excludes shootings given they were only included from 2017. Although very few shootings are vacant – 0.3% are deemed vacant compared with 11.3% of all properties – there are relatively few of them (2.5% of total properties), meaning this has only a very small effect on the vacancy rate.
There were, of course, significant changes to the SBBS in 2017 that expanded its coverage and generosity. The Scottish Government also wrote to all businesses about this expansion, perhaps increasing awareness of the policy. However, it is not possible to attribute any patterns in take-up, growth in non-domestic properties, or decreases in vacancy rates to a specific cause with the data we have.
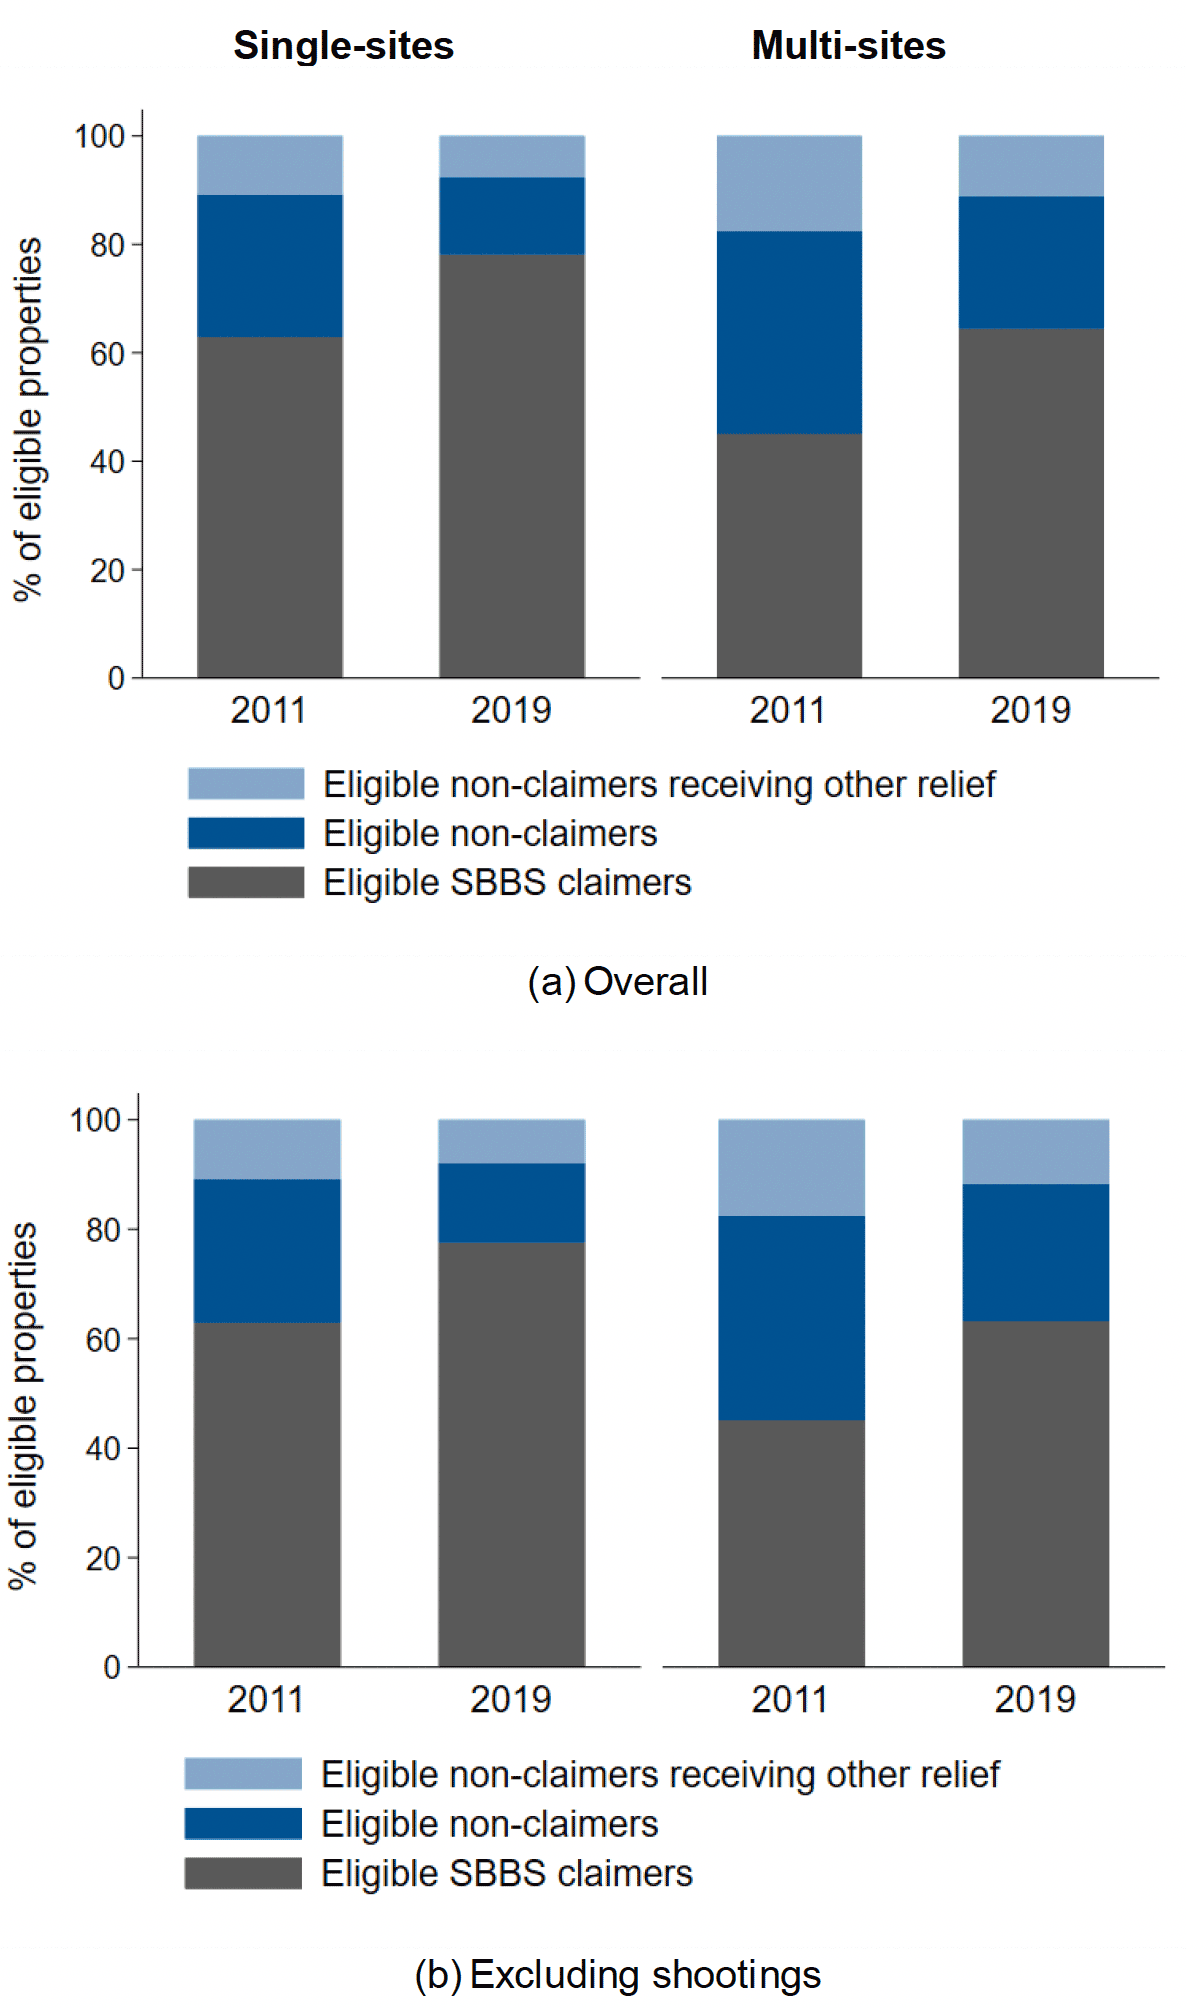 Figure 4.16: Non-domestic properties and vacancies over time, excluding shootings
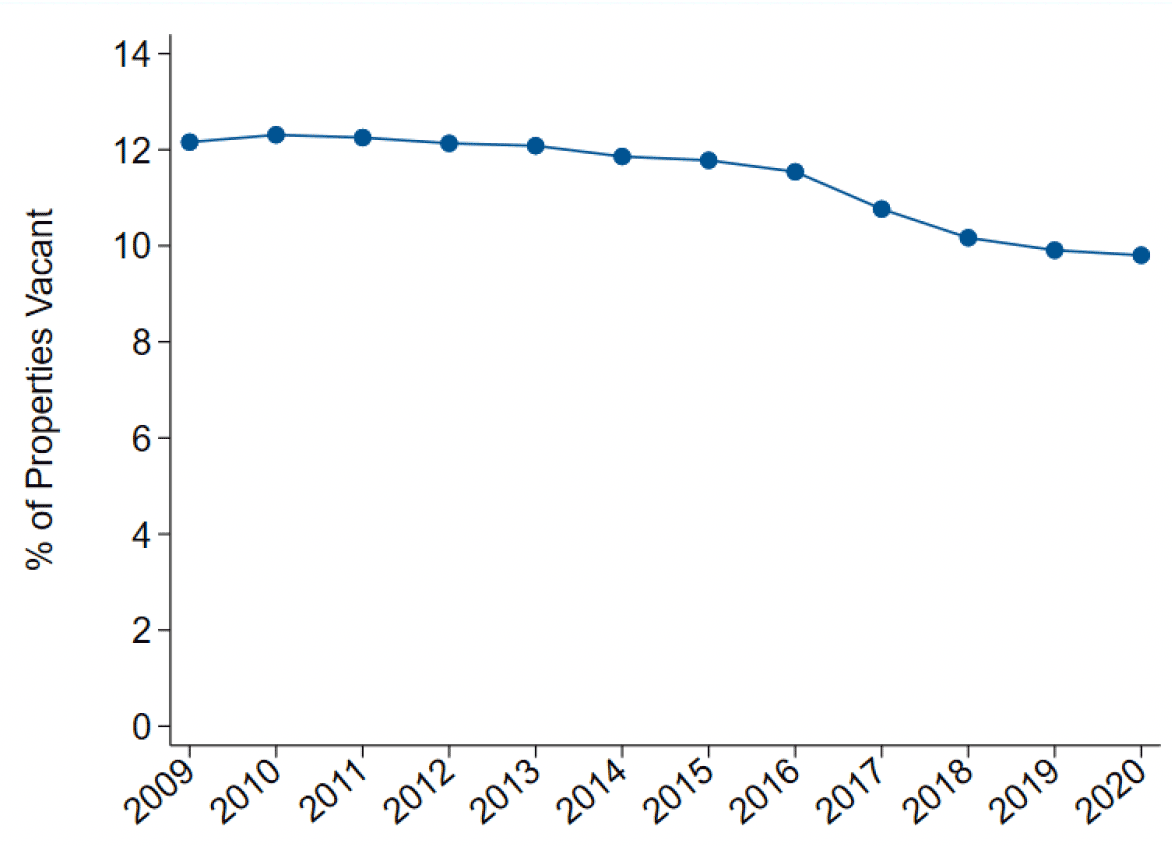
Note: Shootings are excluded due to only being included in the VR from April 2017
4.6 Can we infer anything from the policy thresholds?
One way to ascertain whether a policy like the SBBS has impacted businesses/properties is to compare the outcomes of those it affects on either side of its eligibility thresholds. This can in principle provide robust estimates of policy impacts given that businesses just above and below the thresholds should be, broadly speaking, comparable. In the case of the SBBS, if we wanted to evaluate how the policy has affected, for example, profits, or the likelihood that the business continues to operate, we could in principle compare businesses operating in a property just below the £15,000 threshold which receive 100% relief with those in properties just above which receive only 25% relief, based on an assumption that this is the only way in which these two groups of businesses substantively differ. This comparison would not tell us the effect of receiving 100% versus 25% SBBS relief, on average, across all businesses/properties. However, it would allow us to assess how receiving 100% relief affects the marginal business/property. We revisit the formal definition of this type of comparison, and what conclusions can be drawn from it, in our econometric analysis in Section 7.
There are two main reasons why this is not entirely possible with the data used in this section. Firstly, the VR, PTOA dataset, and Billing Snapshot do not contain measures of business outcomes of interest such as profits, nor do they accurately identify and track businesses over time which may stay or move between properties. We therefore cannot make any comparisons at the business level. Secondly, and as outlined earlier in this section, there appears to be significant bunching around the thresholds of the policy, which suggests that properties or their RVs have been influenced by the policy thresholds.
In the next subsection (Section 4.7) we show that revaluation appeals are more prominent for properties assigned an RV just above the 100% SBBS threshold. If appeals, or any other cause of the sorting, are influenced by business need for support, then any estimates of the effect of the SBBS obtained by comparing outcomes across the threshold would be biased. We return to this point in more detail later in our econometric analysis where we utilise administrative data on business outcomes in an attempt to understand the effect of the policy (Section 7). Here, we look descriptively at the vacancy rate – one property-level outcome on which we do have information in the VR/Billing Snapshot/PTOA data – across the RV distribution to understand whether the SBBS has an influence on property occupancy.
Figure 4.17 shows that there are no obvious differences in the proportion of properties that are vacant on both sides of the pre- and post-2017 policy thresholds, and Figure 4.18 shows that the largest reduction in vacancy rate between 2010-2020 was among those properties with an RV of £1,000 or below. Across the rest of the RV distribution, the decline in vacancy rates was relatively broad-based, even among those not eligible for SBBS relief.
There is arguably evidence of a slightly larger decline in vacancy rates in the £14,001 to £15,000 RV band – where a single site business would have received 25% relief until 2017 and then 100% relief from 2017 onward – than in the £15,001-16,000 RV band where a business would receive 25% relief for the entire period. It is important to note here that Figure 4.17 is based on final (i.e. post-appeal) RVs. Properties which were revalued to marginally above the 100% SBBS threshold are more likely to appeal if they are occupied – something we show in the next subsection – given that those which are unoccupied are eligible for empty property relief. As a result, this decline in vacancy rate among properties valued at £14,001-£15,000 is mechanically linked to the characteristics of appealers. This makes it difficult to interpret the decline in the absence of any further knowledge of the characteristics of appealers.
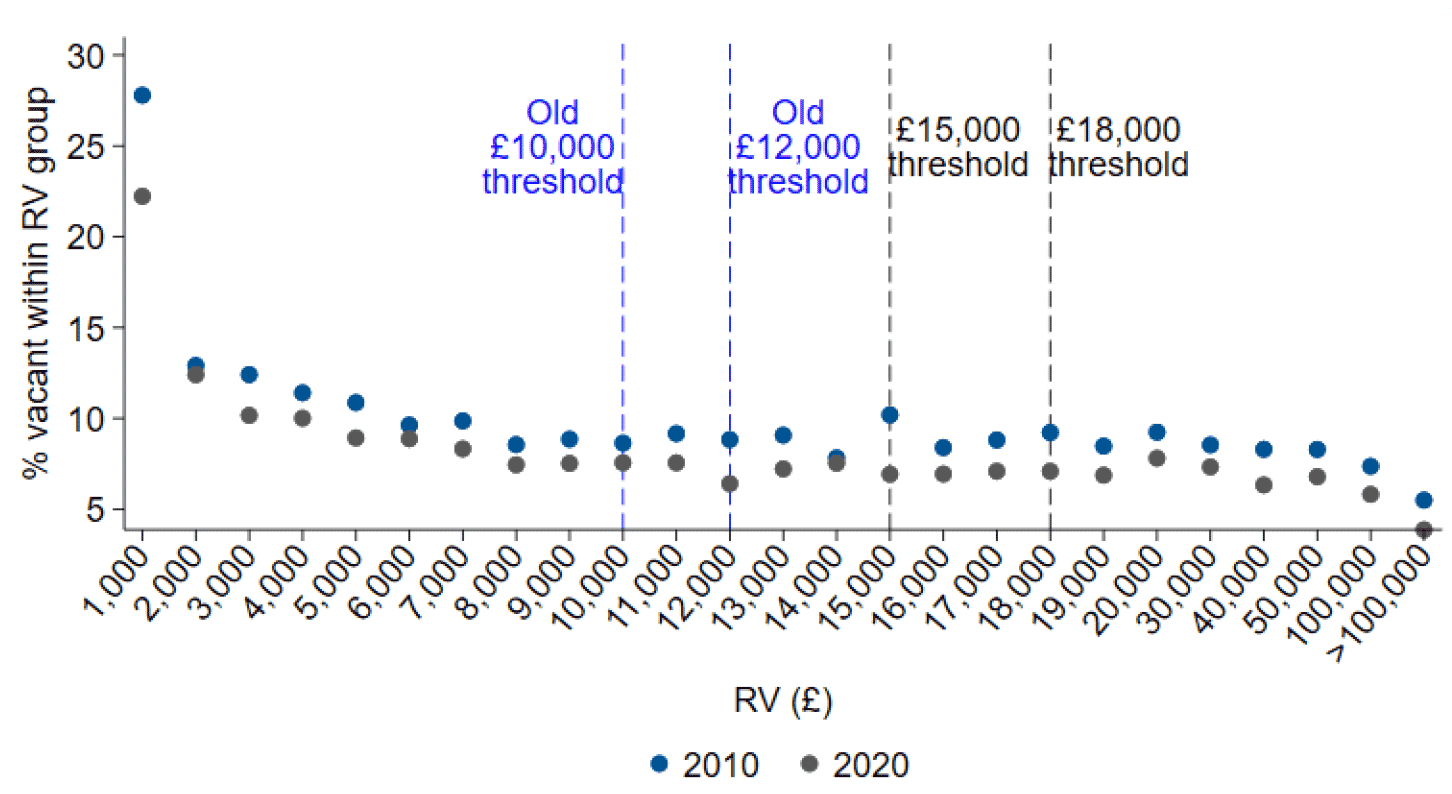
Note: Shootings are excluded due to only being included in the VR from 2017. Properties are grouped in £1,000 RV bands. For example, the bar between £1,001 and £2,000 groups all properties with an RV of at least £1,001 and at most £2,000. Where part of a property is used for residential purposes, we deduct the value of this residential portion from its RV. The £15,000 threshold was present in both 2010 and 2020. From 2008-10 there was a threshold at £8,000 however we do not show it here.
There is a similar drop in the vacancy rate just below the £12,000 threshold that was in place until 2017 and determined whether businesses were eligible for 50% or 25% relief. Between 2010 and 2017 these properties would have been eligible for 50% SBBS relief, but from 2017 this increased to 100% relief. This could be interpreted as slight evidence supporting the notion that the SBBS facilitates the occupancy of non-domestic properties. However, this should be taken with caution as our previous analysis suggested a growth in properties in the £14,001 to £15,000 band and a decline in those in the £15,001-16,000 range between 2010-2020 (Figure 4.12), and these "new" properties would, of course, be more likely to be occupied. Similarly, we have shown in Figure 4.13 that there is significant bunching around these thresholds that changes over time.
Note: Shootings are excluded due to only being included in the VR from 2017. Properties are grouped in £1,000 RV bands. For example, the bar between £1,001 and £2,000 groups all properties with an RV of at least £1,001 and at most £2,000. Where part of a property is used for residential purposes, we deduct the value of this residential portion from its RV. The £15,000 threshold was present in both 2010 and 2020. From 2008-2010 there was a threshold at £8,000, however we do not show it here.
4.7 Revaluations, appeals, and bunching
In the descriptive analyis to this point we have highlighted the bunching of non-domestic properties around the SBBS eligibility thresholds, particularly the £15,000 cut-off at which the SBBS relief for which properties are eligible drops from 100% to 25%. We also noted that one potential reason for this bunching may be that businesses which own/operate in a single property that was assigned an RV just above the 100% SBBS threshold as part of the 2017 revaluation had an incentive to lodge an appeal against that decision, which would increase their relief from 25% to 100%.
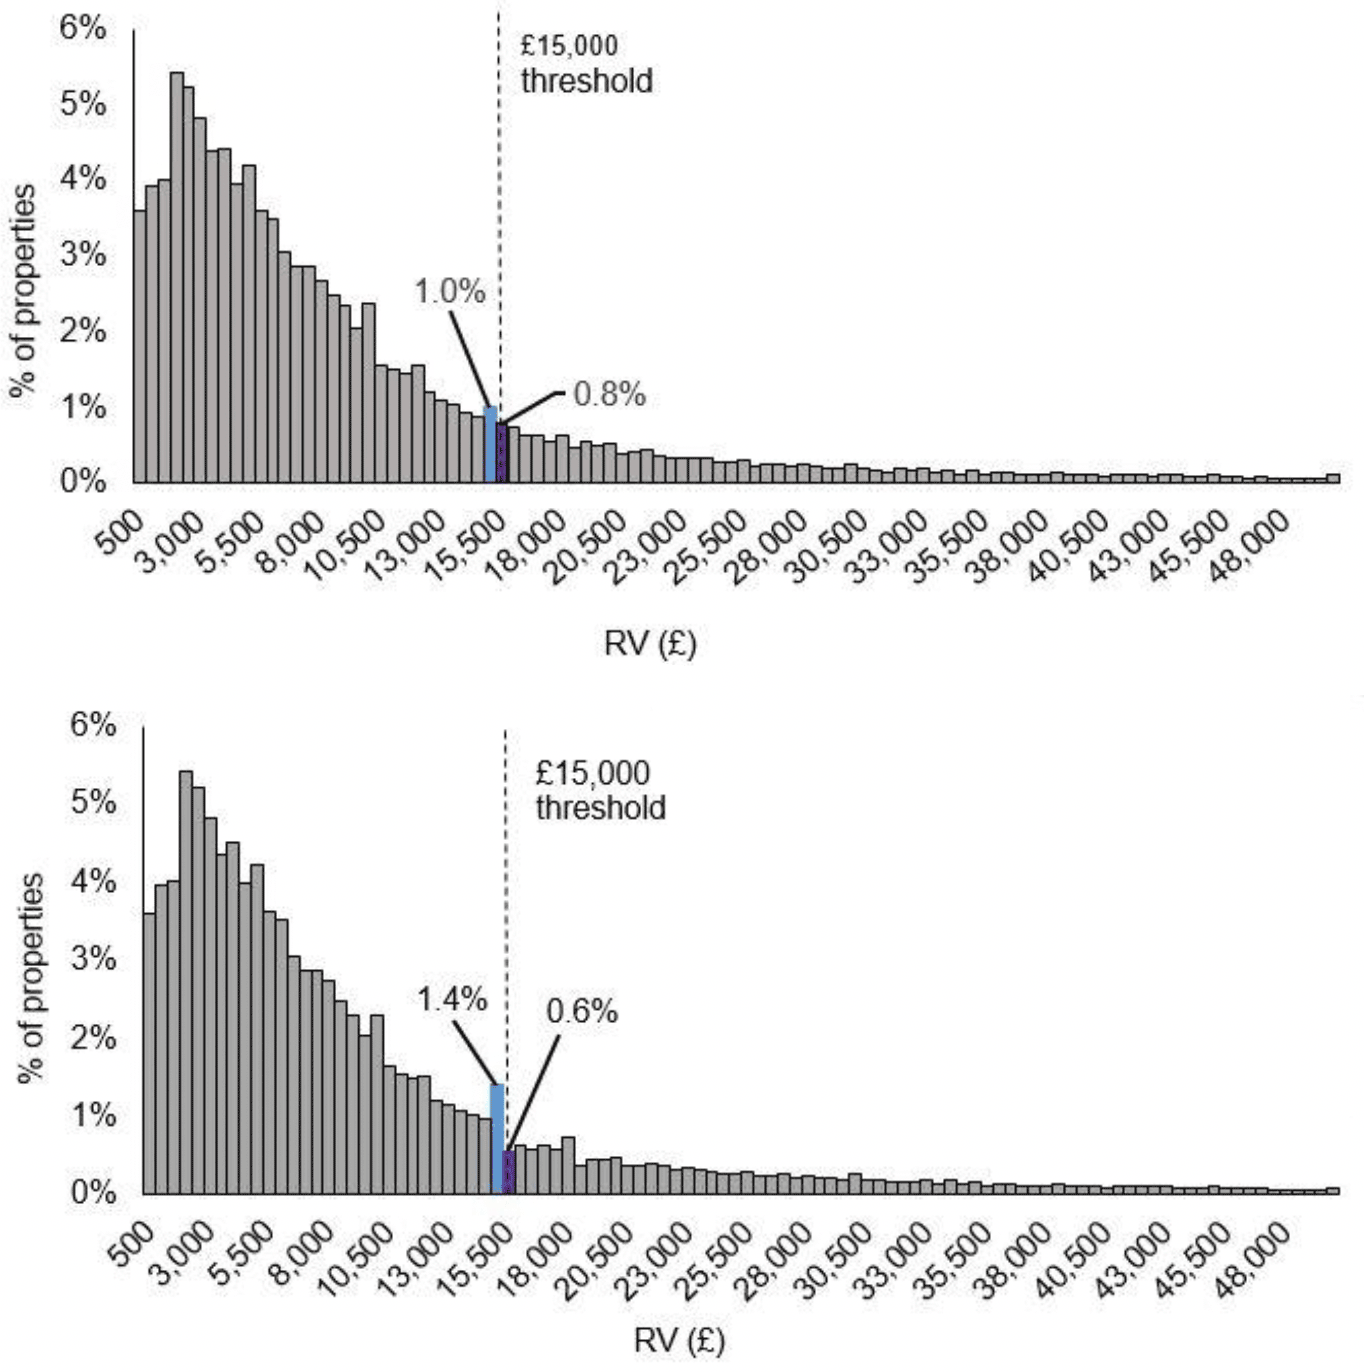
A revaluation involves ascribing a new RV for a property, which is then finalised and updated in the VR. Figure 4.19a plots the distribution of properties according to their 2016 draft RV. This represents the distribution of properties in Scotland, before any re-adjustments due to appeals. It shows that the bunching around the £15,000 threshold is less pronounced than in the previous distributions based on final RVs (for example, Figures 4.3a, 4.11 and 4.13b). Figure 4.19b then shows that the extent of the bunching below the threshold increases significantly by 2020.
From Figure 4.19, it might be reasonable to infer that appeals against the draft valuations contributed substantially to the spike in non-domestic properties marginally below the 100% SBBS eligibility threshold. Figure 4.20 shows that properties estimated to be part of single-site businesses with an RV over £15,000 did in fact engage in appeals at a much higher rate than those below. Each dot in the figure – either light or dark blue – represents the proportion of businesses in £1,000 RV bands that had engaged in an appeal, and the two dotted lines represent the predicted appeal rate across the RV distribution using data from those below (dark blue) and above (light blue) the threshold.
Both predictions show an upward trend in the appeal rate as RV increases. This is intuitive given that a higher RV means having higher NDR liability. However, there is a clear discontinuous jump in the appeal rate at the 100% SBBS threshold.
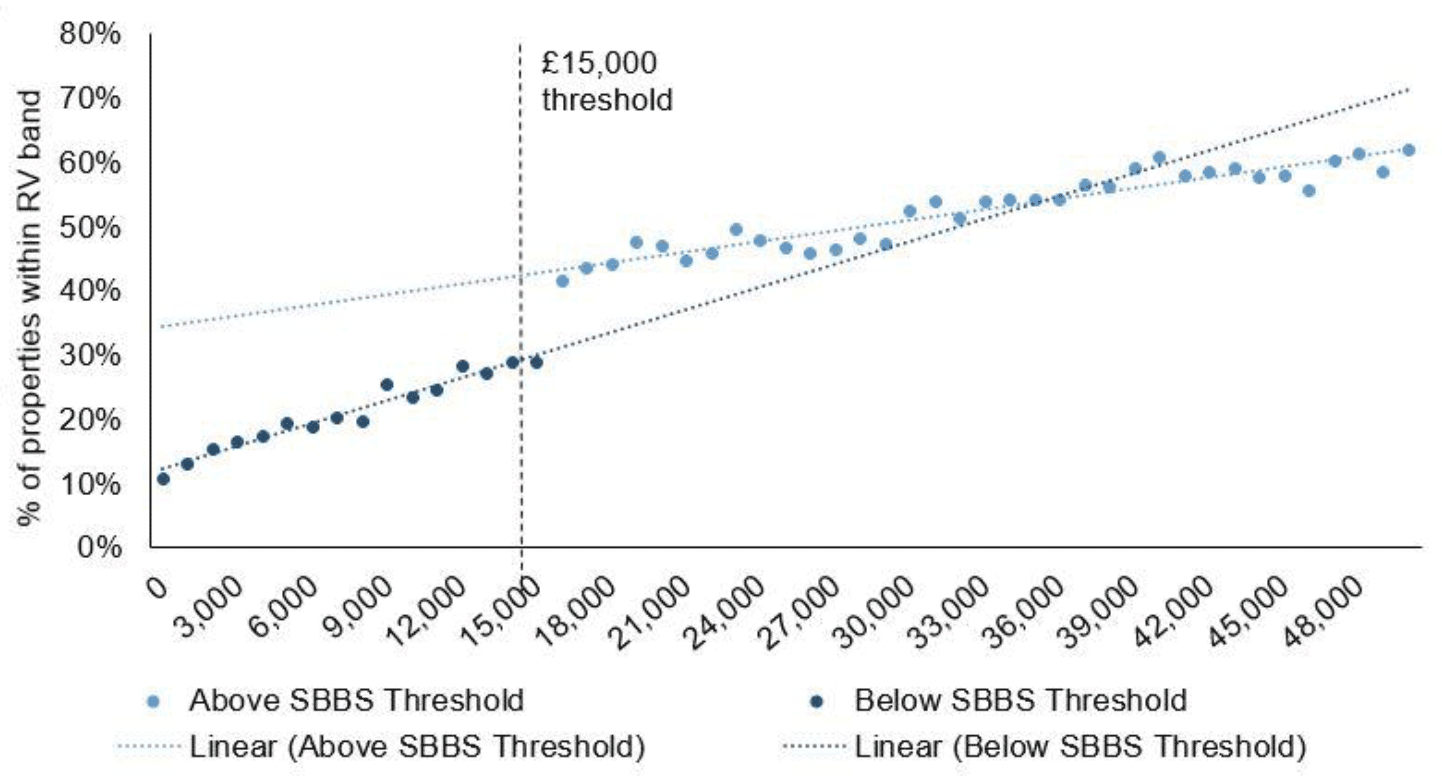
Together Figures 4.19 and 4.20 suggest that bunching around the 100% eligibility threshold was minor when draft RVs were assigned as part of the 2017 revaluation; but that this bunching became increasingly apparent as RVs were finalised; and properties with an RV above the 100% SBBS threshold were significantly more likely to have engaged in an appeal. It is therefore reasonable to conclude that appeals to RVs assigned as part of the 2017 revaluation have substantially contributed to the bunching that is clear in the most recent data used for this evaluation (January 2021).
4.8 Summary of the descriptive analysis
In this section, we have summarised the data that has been made available to us by the Scottish Government under the caveat, documented in Section 3, that there are inherent inaccuracies in constructing a database of business entities from this data.
We documented how the small business base in Scotland is distributed by the RV of the properties the business occupies, geographical location, and the class of the business. We also documented the value of SBBS relief received by businesses operating in Scotland. When investigating take-up of SBBS relief, we found a surprisingly large number of properties that appear from the data to be eligible to claim SBBS relief, but do not claim it. This may, however, be due to the fact it is not possible to accurately construct business entities from the data to ascertain eligibility.
We then considered how the characteristics of the business base have changed between 2010 and 2020. The number of non-domestic properties has increased by 19.6% over this period, which seems to be due to an increase in the number of low-RV properties. It is bolstered, however, by the addition of shootings to the VR from 2017 onward – 28% of the overall increase in non-domestic properties between 2010 and 2020 resulted from this change. Even when we account for the increase in shootings, we still see a substantial increase in non-domestic properties over the past decade (30,876 properties, 14.5%).
We also documented evidence that suggests that the change in the policy thresholds in 2017, at which point an RV of £15,000 became the threshold for SBBS relief to drop from 100% to 25%, promoted a relative increase in the number of properties with an RV just below this threshold and a relative reduction in the number of properties just above it, which is also true (but to a lesser extent) with the £18,000 threshold.
Additionally, we undertook some investigation into whether the SBBS influences the likelihood that properties become vacant, exploiting the policy thresholds to undertake the analysis (a methodology that we will return to in Section 7 of the report). A tentative conclusion, by comparing properties with an RV between £14,000 and £15,000 that are more likely to receive 100% relief with those between £15,000 and £16,000 that are more likely to receive 25% relief is that the SBBS supports properties remaining occupied. This is, however, subject to all the caveats documented in the analysis.
Contact
Email: ndr@gov.scot