Coronavirus (COVID-19): state of the epidemic - 29 April 2022
This report brings together the different sources of evidence and data about the Covid epidemic to summarise the current situation, why we are at that place, and what is likely to happen next.
Looking ahead
Scottish Contact Survey
Changes in patterns of mixing will likely impact on future Covid-19 prevalence. The Scottish Contact Survey measures the times and settings in which people mix where they could potentially spread Covid-19. Average contacts from the most recent Panel A cohort of the Scottish Contact Survey (week ending 20 April) indicate an average of 5.3.
Mean contacts within the home and other setting (contacts outside home, school and work) have increased in the last two weeks by 10% and 43% respectively. Contacts within the work setting have decreased by 17% over the same period. The youngest (18 to 29 years old) and oldest (aged 70 or older) age groups have reported an increase in contacts within the last two weeks, by at least 54%. Those within the remaining age groups have decreased their contacts in the last two weeks, with those aged 30-39 decreasing the most, by 40%.
Modelling the Epidemic
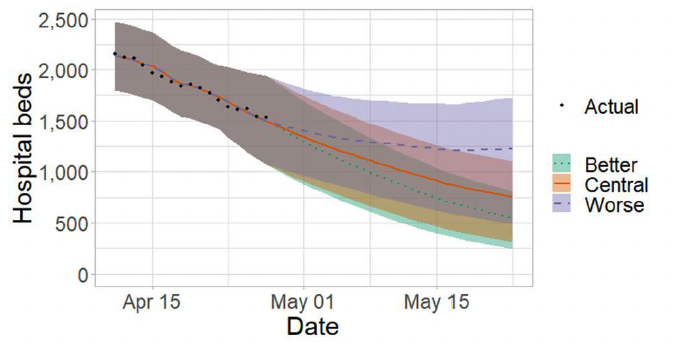
The Scottish Government assesses the potential impact of Covid-19 on the NHS in the next few weeks. The latest Modelling the Epidemic report includes infection and hospital bed projections over the next four weeks. These projections include the effect of vaccines rolled out so far and projected future vaccine rollout including the rollout of fourth doses, and the effect of the announcement on 13 April on the end of the legal requirement for wearing face masks. The 'Central' scenario assumes that transmissibility remains at current levels. 'Worse' assumes a higher transmissibility for Covid-19 whereas 'Better' assumes a lower transmissibility. With this taken into account, it is estimated that daily infections may be up to 88,000 in mid-May. However, the future trajectory of infections is uncertain especially given the change in the methodology to use wastewater Epidemia as the data source for estimating infections[77].
Figure 14 shows the impact of the daily infection projections on the number of people in hospital. The modelling includes all hospital stays, whereas the actuals only include stays up to 28 days' duration that are linked to Covid-19. There continues to be uncertainty over hospital occupancy and intensive care in the next four weeks[78].
Long Covid
Estimates on the proportion of people in the private residential population in Scotland that experience long Covid symptoms are published by the ONS Covid-19 Infection Survey on a monthly basis. The next scheduled release of long Covid data from the Covid-19 Infection Survey is expected to be summarised in the State of the Epidemic report on 13 May. For information on the most recent estimates, see the State of the Epidemic report published on 14 April 2022.
Fortnightly modelled estimates for Scotland are also usually published in the Modelling the Epidemic report. However, a report on the rate of long Covid-19 has not been included this week. This will resume again once updated estimates of self-reported long Covid-19 prevalence amongst those infected with the less severe Omicron variant become available.