Coronavirus (COVID-19): state of the epidemic - 29 April 2022
This report brings together the different sources of evidence and data about the Covid epidemic to summarise the current situation, why we are at that place, and what is likely to happen next.
Estimated Infection Levels and Case Numbers
Estimated Infection Levels
The UK Health Security Agency's (UKHSA) consensus estimate for R in Scotland as at 12 April is between 0.8 and 1.0. The lower and upper limits of the R value have both remained unchanged since the previous publication (Figure 1)[3] [4].
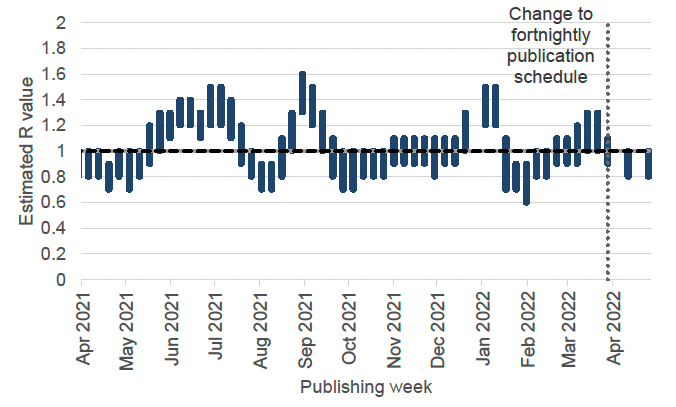
As at 12 April, the UKHSA's consensus view was that the incidence of new daily infections in Scotland was between 191 and 569 per 100,000 people. This equates to between 10,400 and 31,100 people becoming infected each day in Scotland[6] [7].
The latest growth rate for Scotland as at 12 April was between -5% and -1%. The upper growth and lower growth limit have both decreased since the last published figure[8] [9].
Covid Infection Survey
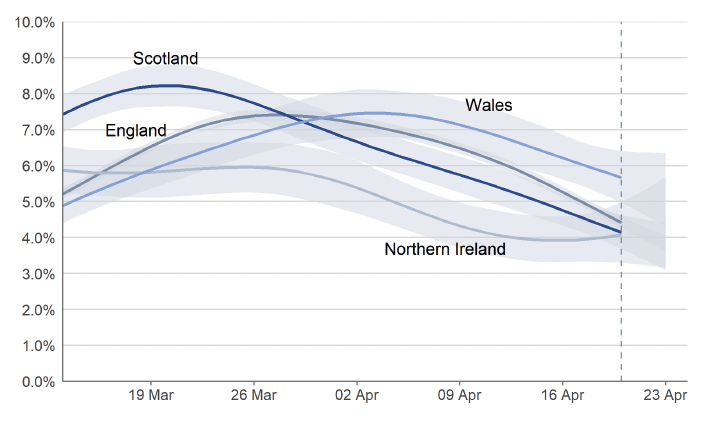
In Scotland, the percentage of people testing positive for Covid-19 as estimated by the Covid-19 Infection Survey continued to decrease in the most recent week (17 to 23 April), as seen in Figure 2[10]. The estimated percentage of people testing positive in Scotland has been decreasing since late-March. This follows a peak in the week 14 to 20 March 2022 which saw the highest estimate for Scotland since the survey began. The estimated percentage of people testing positive for Covid-19 in the private residential population in the week 17 to 23 April in Scotland is 4.14% (95% credible interval: 3.68% to 4.63%)[11], equating to around 1 in 25 people (95% credible interval: 1 in 25 to 1 in 20).
In the week 17 to 23 April 2022, estimates for the other nations of the UK are as follows and can be seen in Figure 2:
- In England, the percentage of people testing positive continued to decrease: 4.42% (95% credible interval: 4.27% to 4.58%), equating to around 1 in 25 people (95% credible interval: 1 in 25 to 1 in 20).
- In Wales, the percentage of people testing positive continued to decrease: 5.67% (95% credible interval: 4.98% to 6.41%), equating to around 1 in 18 people (95% credible interval: 1 in 20 to 1 in 16).
- In Northern Ireland, the percentage of people testing positive decreased over the most recent two weeks, but the trend was uncertain in the most recent week: 4.07% (95% credible interval: 3.30% to 5.00%), equating to around 1 in 25 people (95% credible interval: 1 in 30 to 1 in 20).
In Scotland, the estimated percentage of people testing positive has decreased among older adults. However, the trend was uncertain in young adults and children of nursery/primary and secondary school ages[13].
Wastewater Estimates
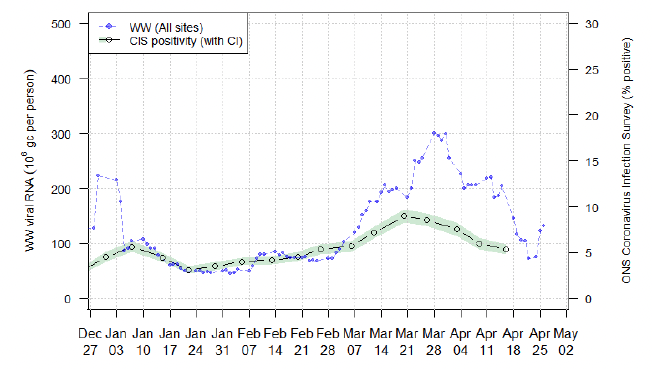
Nationwide, wastewater Covid-19 levels have overall reduced in the last two weeks. The week ending 26 April saw levels of around 130 million gene copies per person per day (Mgc/p/d), a slight rise compared to 116 Mgc/p/d the previous week (week ending 19 April), but lower than 220 Mgc/p/d the week before (week ending 12 April) (Figure 3)[14].
Although overall there are decreases in wastewater Covid-19 levels across most of Scotland in the last two weeks, 18 local authorities have increased their levels over the past week. Increases were reported in Aberdeen City, Aberdeenshire, Angus, Argyll and Bute, Clackmannanshire, Dumfries and Galloway, Dundee City, East Ayrshire, East Dunbartonshire, Fife, Glasgow City, Highland, Inverclyde, North Ayrshire, Perth and Kinross, South Ayrshire, South Lanarkshire and West Lothian. Please note that comparisons for Na h-Eileanan Siar, Shetland and Stirling are not possible due to sampling coverage.
Covid-19 Cases
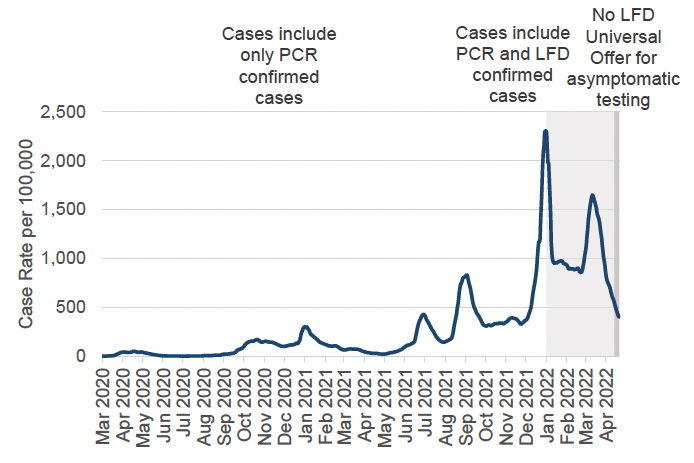
By specimen date, the seven-day combined PCR and LFD case rate (including reinfections) continued to decrease in Scotland in the week leading up to 24 April. This follows a period of sharply increasing case rates from late February to mid-March. There were 400 weekly combined PCR and LFD cases per 100,000 population in the week to 24 April, which is a 28% decrease from 557 weekly cases per 100,000 on 17 April (Figure 4)[18].
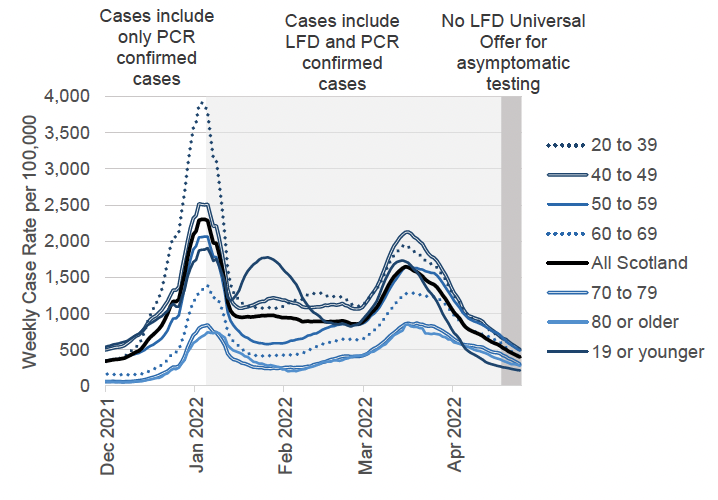
The week leading up to 24 April saw decreasing case rates in all age groups compared to the week ending 17 April. In the most recent week, the decrease ranged from 20% for those aged 19 or younger, to 34% for those aged 60 to 69 (Figure 5)[21]. Meanwhile CIS estimates indicate the estimated percentage of people testing positive has decreased among older adults. However, the trend was uncertain in young adults and children of nursery/primary and secondary school ages[22].
Rising numbers of weekly Covid-19 cases among care home residents throughout February and March were in line with the increasing case numbers among older age groups in the same period. The number of Covid-19 cases among care home residents peaked in the week to 11 March, with 938 reported cases. Case numbers have since decreased, and in the week to 22 April there were 170 reported cases among care home residents, which is a decrease of 41% from the previous week ending 15 April (287 cases)[25].
According to data from ARHAI Scotland, 98.1% of the 50,451 Covid-19 Cases reported in the week ending 3 April 2022 were reported as community onset cases. 389 cases in the same period were reported as nosocomial cases[26]. This is an 18% decrease from the previous week ending 27 March (473 nosocomial cases). This follows a period of increasing numbers of nosocomial cases since the beginning of February (following a peak in late December 2021 and early January 2022). The number of cases in all categories of inpatient diagnosed COVID-19 cases increased during the same time period, including those diagnosed on day one or two, reflecting the high levels of transmission in the community[27].
Reinfections
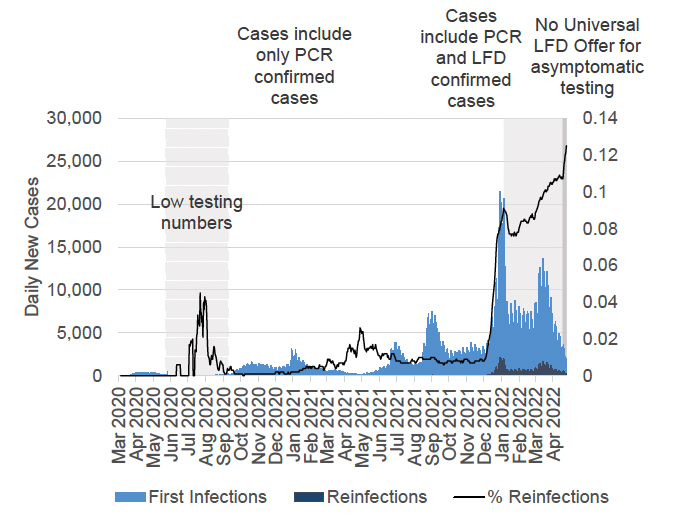
The increase in the proportion of reinfections seen in late 2021 corresponds to the emergence of the Omicron BA.1 variant in the UK. The proportion of reinfections in Scotland when Omicron BA.1 was first detected on 29 November[28] was 0.8% percent of total cases. These are cases in individuals for whom it has been 90 or more days since their last positive Covid-19 test.
The proportion of reinfections among the total weekly cases has increased in the most recent week. By specimen date, there was an total number of 2,726 reinfection cases confirmed by either a PCR or LFD test in the week leading up to 24 April. These represent 12.5% of reported cases, which is an increase from 10.7% in the week leading up to 17 April. This is the highest level of reinfections seen in the pandemic (Figure 6)[29].
LFD Testing
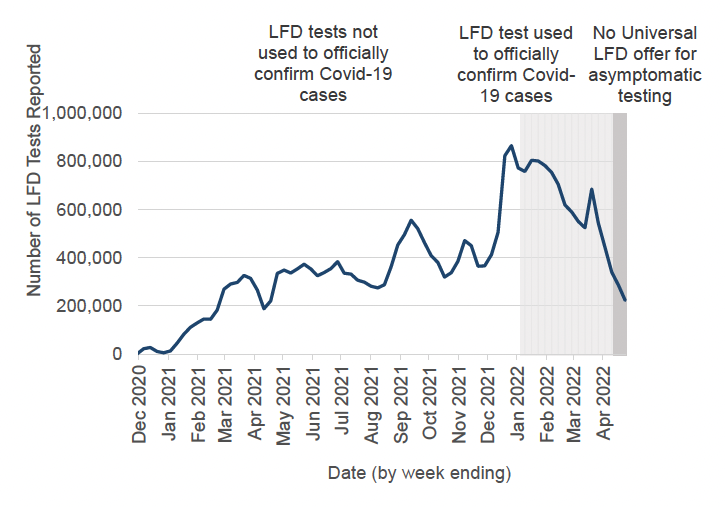
The weekly total number of LFD tests reported in the week to 24 April decreased by 22% from the previous week leading up to 17 April. There were 223,503 reported tests in the week to 24 April (Figure 7)[32]. Please note that from 18 April LFD Universal Offer for asymptomatic testing is no longer available.
The Scottish Contact Survey[35] asks whether people use LFD tests and if so how often. Approximately 68% of individuals had taken at least one lateral flow test within the last 7 days for the survey pertaining to the period 14 April to 20 April, decreasing from 77% two weeks prior[36].