Coronavirus (COVID-19): state of the epidemic - 29 April 2022
This report brings together the different sources of evidence and data about the Covid epidemic to summarise the current situation, why we are at that place, and what is likely to happen next.
Severe Illness: Hospitalisation, ICU and Deaths
Hospital and ICU Occupancy and Admissions
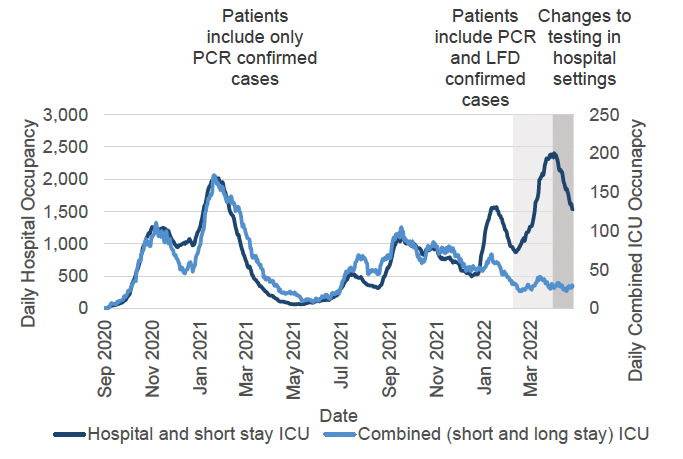
In the week to 26 April, daily Covid-19 hospital occupancy continued to decrease[37]. NHS boards reported 1,529 patients in hospital or in short stay ICU on 26 April with recently confirmed Covid-19, compared to 1,820 on 19 April. This is a decrease of 291 patients, or 16%, from a week previously, and follows a period of sharply increasing hospital occupancy numbers which peaked on 2 April with the highest figure seen throughout the pandemic at 2,406 patients (Figure 8)[38].
Combined ICU occupancy (including short and long stay) has increased to 28 patients on 26 April, an increase of 2 patients or 8% compared to a week previously on 19 April. However, ICU occupancy has been fluctuating on daily basis. The number of combined ICU occupancy remains lower than the peak of 172 ICU patients recorded in January 2021 (Figure 8). There were 25 patients in short stay ICU on 26 April, compared to 20 a week previously (19 April). This is an increase of 5 patients. There were 3 patients in long stay ICU on 26 April, compared to 6 a week previously (19 April). This is a decrease of 3 patients[39].
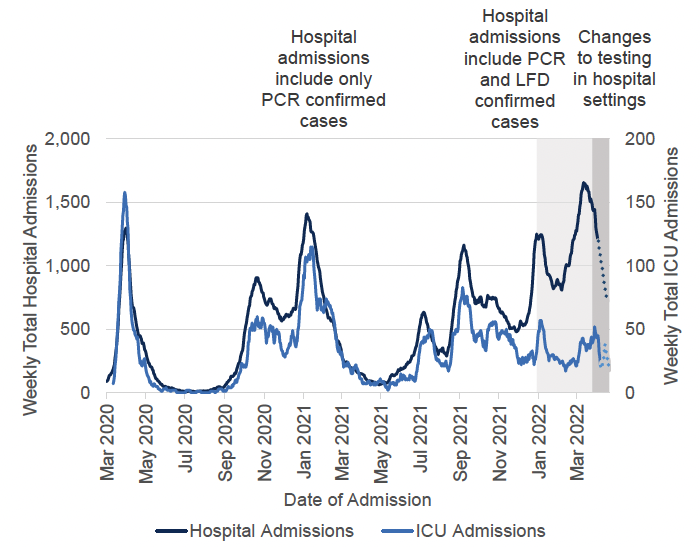
Covid-19 related admissions to hospital[42] have decreased over the latest week, with 1,203 admissions to hospital for people with confirmed Covid-19 in the week to 9 April compared to 1,435 in the week to 2 April. This is a 16% decrease. This follows a period of sharply increasing numbers of Covid-19 related hospital admissions, reaching the highest levels seen throughout the pandemic in the week to 18 March 2022 (1,657 admissions)[43]. As noted above, we are continuing to see a large number of daily revisions, so comparisons for the latest two weeks of data have not been made[44].
There were 29 new Covid-19 patients admitted to ICU in the week to 12 April, compared to 48 in the week to 5 April. This is a 40% decrease, and compares to 57 weekly ICU admissions during the most recent peak in early January 2022. As noted above we are currently seeing a large number of daily revisions, so the number of admissions to ICU for the latest two weeks are likely to change (Figure 9)[45].
The highest number of hospital admissions in the week to 12 April were among those aged 80 and over. In the same week, approximately 66% of the hospital admissions related to patients aged 60 or older. This is an increase from 61% in the week to 5 April. According to the latest data, 60% of the hospital admissions in the week to 19 April related to patients aged 60 or older. However, the latest data does not have a lag applied to account for revisions[49].
According to data from the PHS Education Dashboard, average hospital admissions related to Covid-19 in children and young adults have continued to decrease by 20% in the three-week period to 20 April, at 114 average weekly admissions, compared to the previous three-week period to 13 April (142 average weekly admissions). This comes after a period of increasing numbers of hospital admissions among children and young people, peaking in the three-week period to 30 March, at 188 weekly average admissions[49] [50].
In the period 30 March to 12 April 2022, around 59% of Covid-19 hospital admissions stayed longer than 48 hours after being admitted. Analysis from Public Health Scotland on the same time period shows that length of stay tends to increase with age, as 59% of hospital stays for those aged 17 or younger had a length of stay of less than 24 hours, while 77% of hospital stays for those aged 80 or older had a length of stay of over 48 hours[51]. Please note that length of stay can be influenced by a variety of factors, and that the figures above may be subject to future revisions due to the completeness of discharge summary information. For more information, please see the PHS Weekly report.
Due to the testing differences across the four nations mentioned above, we have removed the four nations comparisons on hospital admissions and occupancy. We will continue to monitor the data to see if it will become appropriate to reintroduce this analysis.
Deaths
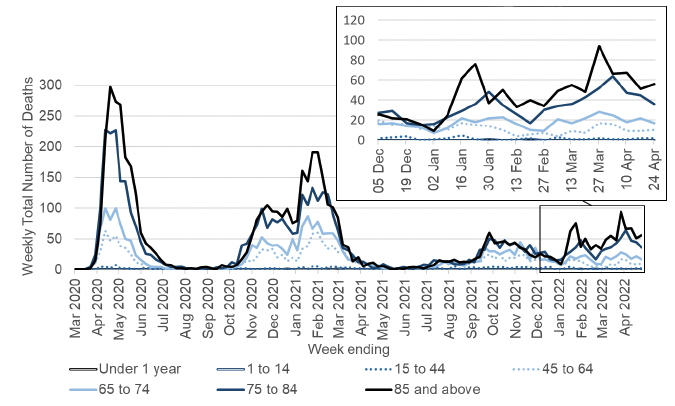
There were 121 deaths where Covid-19 was mentioned on the death certificate in the week to 24 April. Out of these, there were 72 deaths where Covid-19 was the underlying cause. The number of deaths where Covid-19 was mentioned on the death certificate decreased by 6%, or 8 deaths, compared to the previous week (129 deaths in the week to 17 April). The 121 deaths where Covid-19 was mentioned on the death certificate in the week to 24 April 2022 is 82% lower than the peak in 2020, when the week ending 27 April 2020 saw a total of 663 deaths where Covid-19 was mentioned on the death certificate[52]. The number of deaths are higher among those aged 45 and older but are fluctuating on a weekly basis. Covid-19 deaths among younger age groups have remained at low levels throughout the pandemic (Figure 10).National Records of Scotland publish a detailed analysis on deaths involving Covid-19 in Scotland in their monthly report[53].
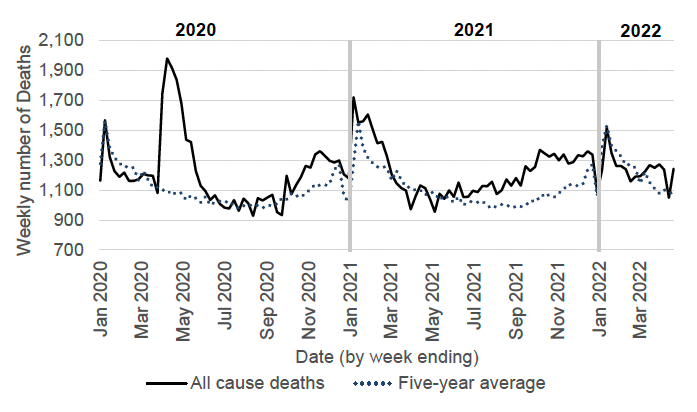
In the week ending 24 April, the total number of deaths registered in Scotland was 1,242. This was 16%, or 171 deaths, above the five-year average for this week (Figure 11)[54] [55]. In the same week, the number of deaths from circulatory diseases were 27 above the previous five-year average for this week, and the number of deaths from cancer diseases were 24 above the average. Deaths from Dementia and Alzheimer's disease were 16 above the previous five-year average for this week, and deaths from respiratory disease (not including Covid-19) were 13 above the average. There were 22 excess deaths from other causes[56].
There was one average daily death per one million where Covid-19 was mentioned on the death certificate in the week leading up to 15 April 2022 in Scotland. This compares to four weekly deaths per one million in the week to 8 April 2022. In the same time period, seven-day average daily Covid-19 deaths for the other UK nations were as follows [57] [58]:
- England: one per one million. This compares to two average deaths per one million in the week to 8 April 2022,
- Northern Ireland: one per one million. This compares to two average deaths per one million in the week to 8 April 2022,
Wales: two per one million. This compares to three average deaths per one million in the week to 8 April 2022.