Climate change monitoring report 2023
The second annual statutory monitoring report against the updated 2018 Climate Change Plan, as per the Climate Change (Emissions Reduction Targets) (Scotland) Act 2019.
Overview
This set of monitoring reports on the CCP is complementary both to the CCPu (which in itself updates the 2018 CCP) and the most recent Official Statistics on Scotland’s greenhouse gas emissions (which are for 2020), and is best read alongside these documents.
The Monitoring Framework for each of the sectors of the CCPu is structured on three levels: greenhouse gas emissions statistics provide the highest level measure of progress at an economy wide and sectoral level; a suite of policy outcome indicators measure the success of policies in achieving the changes that are needed; and a policy tracker monitoring implementation of specific policies and proposals.
Greenhouse Gas Emissions Statistics
Official Statistics on Scottish greenhouse gas emissions determine progress towards national emissions reduction targets and also provide information on total annual emissions at a sectoral level.
Statistics are published annually, typically in June, and two years in arrears. For example, the most recent figures, published in June 2022, cover emissions during 2020.
Those figures show that, on the basis used for reporting progress to Scotland’s statutory economy-wide targets, emissions are now down by 58.7% (between the 1990 baseline and 2020). The Climate Change (Emissions Reduction Targets) (Scotland) Act 2019 specified a target of a 56.0% reduction over the same period.
We recognise that emissions during 2020 were significantly influenced by the impacts of COVID-19 - in particular in the transport sector. We remain absolutely committed to ensuring Scotland plays its full part on delivering on the Glasgow Climate Pact, which reaffirmed the global goal of limiting warming to 1.5 degrees Celsius. The latest emissions data for 2020 shows that Scotland’s emissions are down by over 50% since the 1990 baseline, over half way to net zero. While there can be no satisfaction taken in emissions reductions resulting from such economic and social harms, the data highlights the scale of the transformational changes needed in response to the climate emergency and the centrality of transport emissions to achieving that aim. The challenge is to achieve these outcomes in ways that are sustainable and just. The latest emissions data does not yet reflect the strengthening of action through the CCPu.
Future monitoring reports alongside the published sets off emissions statistics, will allow us to keep the progress under regular review and make further adjustments as needed. It should be noted that the indicators set out in this monitoring framework largely relate to policies within the control of the Scottish Government. Nonetheless, the overall economy-wide emissions outcomes, and therefore whether statutory targets are able to be met, also depends on a range of wider actions – including action taken by the UK Government – given, as the CCC has noted, many key levers are reserved to the UK Government -and the private sector, and the pace of development and availability of technologies required to decarbonise certain sectors.
Policy Outcome Indicators
The CCP includes key policy outcomes for each sector, defined as a measurable change on the ground resulting from a policy or combination of related policies. The Framework will measure progress towards achieving these with a set of policy outcome indicators. A policy outcome indicator is a specific, objective measure closely aligned to achieving the outcome. It will underpin monitoring of long-term progress towards the outcome, but should also be responsive to change in the near term, so that it can be used to evaluate whether the CCP is on track. Specific milestones (or targets) are set, where appropriate, for the level of the indicator to be achieved at a given time.
In the CCPu, the set of outcome indicators from the 2018 CCP were reviewed to ensure that they reflect the updated policy commitments and to improve the quality and clarity of indicators. This led to new outcome indicators being identified, others being revised, and a few being removed where they were no longer appropriate or there were significant issues with robustness. In the last year of reporting, we have amended several indicators meaning there are now 43 indicators in total. An explanation of where indicators have been amended is included in each sector’s chapter. The following figure and table show the overview of progress against all policy outcome indicators across the sectors.
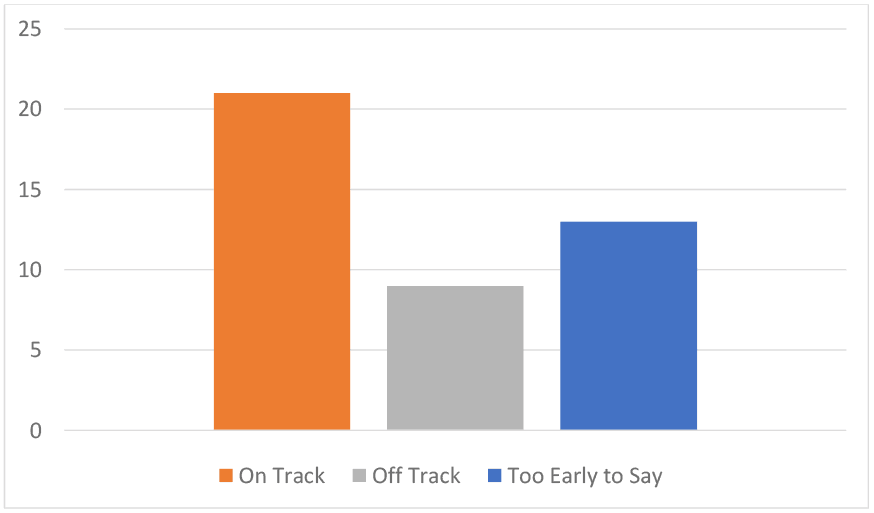
Compared to last year’s report, more indicators are now assessed as “too early to say”. The reasons for such assessments on an individual basis are laid out in more detail in sector chapters, reasons for such an assessment include lack of available data in some cases, cases where indicators measuring technologies not yet on-stream (e.g. % reduction in emissions from scheduled flights within Scotland ) and cases where monitoring frameworks are yet to be established.
| On Track | Off Track | Too Early to Say | |
|---|---|---|---|
| Chapter 1: Electricity | |||
| Electricity grid intensity (CO2e per kilowatt hour) | X | ||
| Installed capacity of renewable generation (GW) | X | ||
| Renewable capacity at planning stages (GW: 3 categories) | X | ||
| Loss of Load Expectation (hours per year) | X | ||
| Chapter 2: Buildings | |||
| Number of existing domestic properties using low and zero greenhouse gas emissions heating (LZDEH) systems | X | ||
| Services sector fossil fuel heat consumption | X | ||
| % of non-electrical heat consumption met from renewable sources | X | ||
| Energy intensity of residential buildings (MWh per household) | X | ||
| Emissions intensity of non-domestic buildings (tonnes of CO2e per £ million Gross Value Added) | X | ||
| % of homes with an EPC[2] (EER,[3] or equivalent) of at least C | X | ||
| % new homes built with a calculated space heating demand of not more than 20 kWh/m²/yrT | X | ||
| Percentage of households in fuel poverty | X | ||
| Chapter 3: Transport | |||
| % reduction in car kilometres | X | ||
| % of new car registrations that are ULEV | X | ||
| % of new van registrations that are ULEV | X | ||
| % of new HGV registrations that are ULEV | X | ||
| % of new bus registrations that are ULEV | X | ||
| % reduction in emissions from scheduled flights within Scotland | X | ||
| % of ferries that are low emissions | X | ||
| % of single track kilometres electrified | X | ||
| % of train kilometres powered by alternative traction | X | ||
| Chapter 4: Industry | |||
| Industrial energy productivity (£GVAm per GWh) | X | ||
| Industrial emissions intensity (tCO2e per £GVAm) | X | ||
| % of Scottish gas demand accounted for by biomethane and hydrogen blended into the gas network | X | ||
| Chapter 5: Waste | |||
| Total amount of landfilled waste (tonnes) | X | ||
| Total amount of biodegradable landfilled waste (tonnes) | X | ||
| Number of closed landfill sites with exploratory landfill gas capture/ flaring | X | ||
| Household and non-household food waste reduced (tonnes) | X | ||
| Total waste generated (tonnes) | X | ||
| Chapter 6: LULUCF | |||
| Hectares of woodland created per year | X | ||
| Woodland ecological condition | X | ||
| Woodland Carbon Code: Projected carbon sequestration (validated credits) | X | ||
| Annual volume (in millions of cubic metres) of Scottish produced sawn wood and panel boards used in construction | X | ||
| Hectares of peatland restored per year | X | ||
| Peatland Carbon Code: Projected emissions reduction (validated units) | X | ||
| Chapter 7: Agriculture | |||
| Increased engagement with Farm Advisory Services on environmental issues and climate change | X | ||
| Use of Nitrogen fertilisers | X | ||
| Spreading precision of Nitrogen fertilisers | X | ||
| Nitrogen use efficiency for crop production | X | ||
| Time taken from birth to slaughter and increased efficiency through improved health and reduced losses | X | ||
| Improvement in covered slurry storage | X | ||
| Precision application of manure and slurry | X | ||
| Area of woodland on agricultural land | X |
Policy Tracker
The CCPu includes a set of specific policies and proposals for each sector to achieve the policy outcomes. Part C of each policy chapter monitors progress towards implementing policies and developing proposals. This consistently records progress and next steps for policies, and where possible includes implementation indicators for specific policies.
Contact
Email: climate.change@gov.scot