Wellbeing economy monitor: December 2022 update
The monitor brings together a range of indicators to provide a baseline for assessing progress towards the development of a wellbeing economy in Scotland.
8. Charts in detail
Natural capital
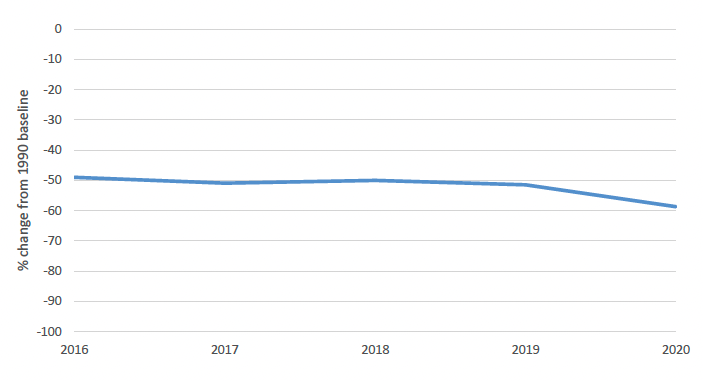
Source: Greenhouse Gas Inventories for England, Scotland, Wales & Northern Ireland: 1990-2020; Scottish Greenhouse Gas Statistics 2020
A wellbeing economy should play its role in tackling the global climate emergency and limiting temperature rises. Achieving this outcome means ending our contribution to climate change by reaching net zero greenhouse gas emissions by 2045[7].
This indicator measures Scotland's greenhouse gas emissions as a percentage change achieved from the baseline figure in 1990. It includes the greenhouse gas emissions that are produced within Scotland's territory (or economic sphere), including a share of emissions from international aviation and shipping. The basket of greenhouse gases consists of carbon dioxide, methane, nitrous oxide, and the four F-gases (hydrofluorocarbons, perfluorocarbons, sulphur hexafluoride, and nitrogen trifluoride). 1990 is used as a baseline for carbon dioxide, methane and nitrous oxide and 1995 for the F-gases[8].
Compared to the initial Wellbeing Economy Monitor published in June 2022, this publication uses a slightly different indicator of greenhouse gas emissions. In order to allow us to assess whether Scotland is improving, worsening or maintaining progress relative to our statutory emissions reductions targets in Table 1, this publication reports on total emissions including land use, land use change and forestry (LULUCF). The earlier publication reported emissions per capita excluding LULUCF, which allowed comparison with other countries.
Playing our full role in tackling the global climate emergency also means reducing Scotland's carbon footprint (emissions associated with all consumption including imported products). This refers to emissions which are associated with the spending of Scottish residents on goods and services, wherever in the world these emissions arise together with emissions directly generated by Scottish households, through private heating and motoring. Scotland's consumption-based emissions are presented within the NPF indicator: 'Scotland's carbon footprint[9]'.
Figure 2 shows Scotland's GHG Account for assessing progress to statutory targets indicated a reduction of 58.7 per cent in 2020, compared to a target of a 56.0 per cent reduction. As a result, the emissions reduction target was met in 2020.
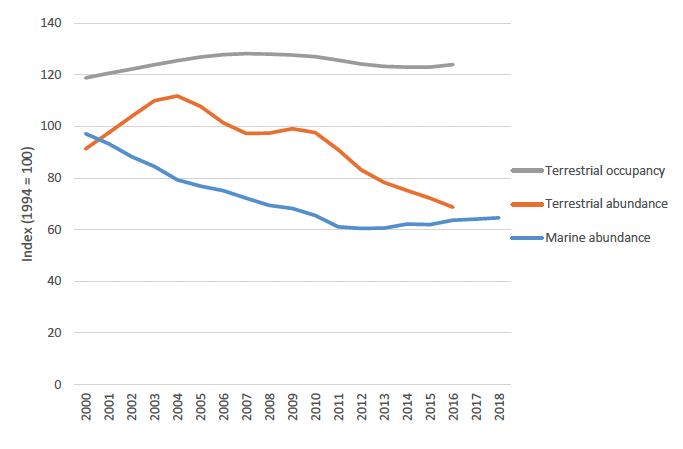
Source: NatureScot
A wellbeing economy should ensure essential life-supporting environments are protected, allowing for a restored and safe natural world for all life. Biodiversity is the foundation of life on earth and is crucial for the functioning of ecosystems, which provide us with products and services without which we couldn't live. Halting and reversing any decline in biodiversity and improving the health and quality of our air, water, seas and soils will help to ensure that our natural environment is resilient whatever the future may bring[10].
Figure 3 shows the three metrics that compose Scotland's biodiversity index. Marine and terrestrial abundance lines reflect changes in the number of individuals of a species in these areas, whilst terrestrial occupancy reflects the number of sites where a species is present (therefore the size of the range within which it is found). This indicator helps measure progress towards national biodiversity commitments including the Scottish Biodiversity Strategy[11] and the national (NPF) environment outcome to 'value, enjoy, protect and enhance our environment'.
Quantitative data of changes to Scottish biodiversity prior to 1994 is not captured in this indicator. However, the State of Nature Scotland Report 2019[12] highlighted a sustained decline in biodiversity between 1970 and 1994 and concluded that these trends should be "viewed against a backdrop of profound historic human influences on nature in Scotland".
The marine elements of the indicator continue to be under development as new species data becomes available. Further information on marine biodiversity status can be found in the Scotland Marine Assessment 2020[13].
Figure 3 shows marine abundance index fell from 2000 to 2012 before recovering slightly from 2012 to 2018. By 2018 it stood at 64.6% of the 1994 level. Between 2000 and 2004, the terrestrial abundance index was rising, but then fell for most of the period from 2004 to 2016, when it reached 68.7% of the 1994 level. The terrestrial occupancy index rose from 118.8 to 124 over the period from 2000 to 2016.
Human capital
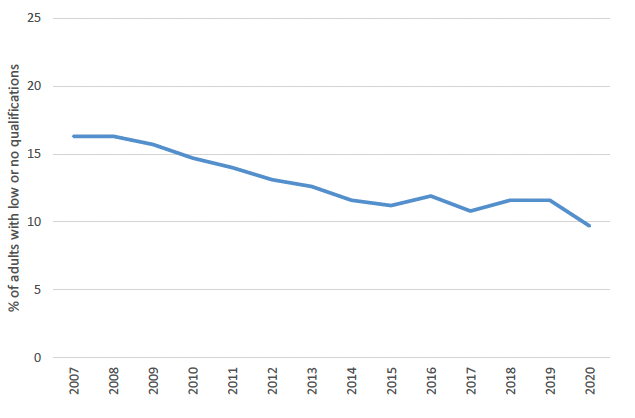
Source: OECD
A wellbeing economy should allow citizens to realise their full potential and contribute to society. Skills enable people to more effectively participate and progress in the labour market and lead fulfilling lives[14]. Evidence suggests that for those with low life satisfaction, education is important and may act as a positive buffer against shocks by opening up different life trajectories[15]. Education is also linked with other wellbeing outcomes[16] including increased awareness of threats to the natural environment, which can be used as a tool to communicate the urgency of climate action. Education also supports an understanding of multiple world-views and perspectives, necessary for building meaningful relationships and promoting peace/non-violence. Education can also empower people to adopt healthier lifestyles.
This indicator measures the proportion of adults aged 16 to 64 whose highest qualification was SCQF level 4 or below (SCQF level 4 is equivalent to the current National 4 level).
Compared to the initial Wellbeing Economy Monitor published in June 2022, this publication uses a slightly different indicator of low educational attainment, in line with that used in the National Performance Framework. We can now similarly assess (and come to the same conclusion as the NPF on) whether Scotland is improving, worsening or maintaining progress on this indicator.
The low educational attainment indicator in the previous publication used OECD data, which allowed for comparison with other countries. Differences between the two measures include the age groups covered, the inclusion/exclusion of respondents who do not know their highest qualification level, and small differences in the qualifications included.
It is recognised that some people outside the 16-64 age group will have issues around literacy and numeracy which also need to be addressed. This indicator also does not tell us about the relevance of people's qualifications or about the skills they may have acquired for which they don't have formal qualifications.
Figure 4 shows that in 2020 the proportion of people in Scotland aged 16-64 with low or no qualifications was 9.7%, a decrease of 1.9 percentage points since 2019.
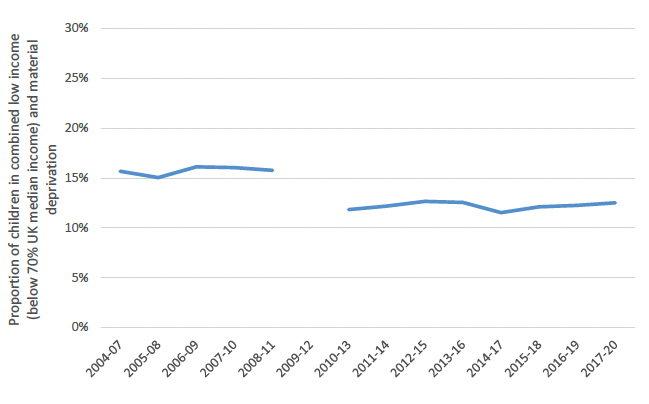
Source: Poverty and Income Inequality in Scotland 2017-20
A wellbeing economy should allow children to grow up loved, safe and respected, which will increase their likelihood of realising their full potential. The effects of poverty on children can be life-long, with impacts on health, education and employment outcomes. For example, evidence suggests children in lower income households are more likely to have high rates of emotional and behavioural difficulties[17] and experience of child poverty can be a key predictor of youth homelessness.
This indicator measures the proportion of children in combined material deprivation and low income after housing costs (below 70% UK median income). Therefore, this indicator tells us the proportion of children living in households that are relatively income poor and that are unable to afford basic necessities after housing costs. This indicator helps measure progress towards national child poverty commitments, including the ambitious targets set within the Child Poverty (Scotland) Act 2017[18], and the national (NPF) children and young people outcome to ensure 'children grow up loved, safe and respected so that they realise their full potential'.
The Child Poverty (Scotland) Act 2017 sets out targets to reduce the proportion of children in poverty by 2030. The targets state that by 2030, of children living in Scottish households:
- less than 10% should be living in relative poverty. This means fewer than one in ten children living in households on low incomes by 2030, compared to the average UK household;
- less than 5% should be living in absolute poverty. This means fewer than one in twenty children living in low-income households where living standards are not increasing by 2030;
- less than 5% should be living with combined low income and material deprivation. This means fewer than one in twenty children living in low-income households who can't afford basic essential goods and services by 2030;
- less than 5% should be living in persistent poverty. This means fewer than one in twenty children living in households in poverty for three years out of four by 2030.
Figure 5 shows the proportion of children in combined material deprivation and low income after housing costs (below 70% UK median income) has remained broadly stable over the period. Due to a change in methodology, there is a break in the series.
Source: Scottish Household Survey
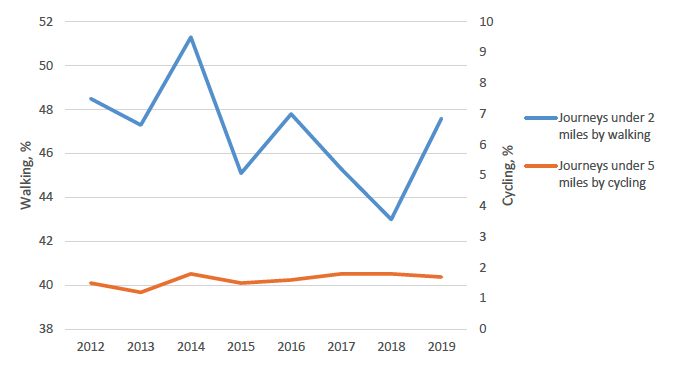
A wellbeing economy should promote healthy lifestyle behaviours through education, access and behavioural change. Active travel leads to better physical and mental health and is also important for decarbonising transport systems; reducing inequalities through widening access to jobs, services and leisure; and improving people's connection to, and pride in, place[19].
This indicator tells us the proportion of short journeys made by adults (aged 16+) by walking or cycling. A short journey is defined as less than 2 miles for walking or less than five miles for cycling. This indicator helps measure progress towards the national (NPF) health outcome 'we are healthy and happy'.
Figure 6 shows the percentage of journeys under 2 miles taken by walking was 48.5% in 2012. It has fluctuated between 43% and 51.3%. It was 47.6% in 2019. The percentage of journeys under 5 miles taken by cycling has remained between 1.2% and 1.8% throughout the period from 2012 to 2019. It was 1.7% in 2019.
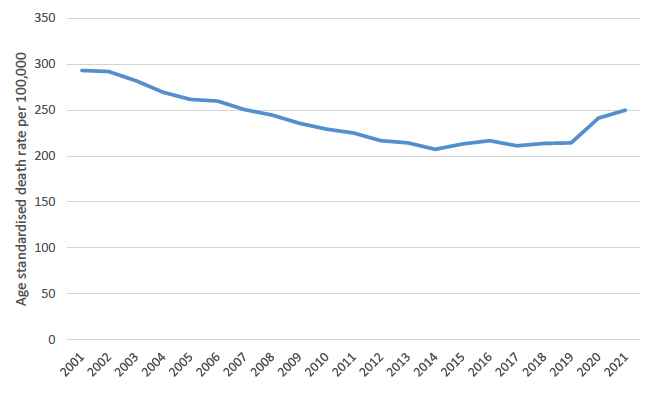
Source: Avoidable mortality | National Records of Scotland
A wellbeing economy should allow its citizens to live long, healthy and active lifestyles and should be preventative to avoid causing harm to people. For example, it should proactively tackle health risks such as air pollution which have been associated with causing preventable deaths[20].
This indicator measures age-standardised death rate per 100,000 of the population. This indicator tells us the number of deaths from causes that could have been avoided through effective public health and primary prevention interventions. It is based on an international definition by the OECD/Eurostat[21] and looks only at deaths under the age of 75.
A similar indicator ('Premature mortality[22]') helps measure progress towards the national (NPF) health outcome, 'we are healthy and happy'. That indicator is a wider measure as it includes deaths under the age of 75 from all causes, rather than just the specific causes which have been classed as 'preventable'.
Figure 7 shows that preventable deaths in Scotland fell from 293.2 in 2001 to 207.3 in 2014. They remained relatively consistent from 2014 to 2019 but rose from 214.3 in 2019 to 250.1 in 2020. This was because 2020-2021 figures included deaths from COVID-19. When excluding COVID-19 preventable deaths, the rate actually decreased by 0.7% from 2019 to 2020 to 212.7 but increased by 1.1% from 2020 to 2021 to 215.1.
Source: Poverty and Income Inequality in Scotland 2017-20
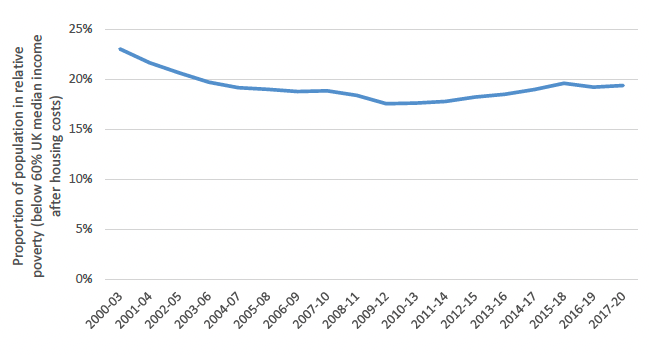
A wellbeing economy should enable everyone in society to live dignified lives and meet their basic needs. Poverty limits access to key experiences and material resources and is linked with other negative wellbeing outcomes such as poor mental health[23].
This indicator measures the percentage of individuals living in private households with an equivalised income of less than 60% of the UK median after housing costs. In other words, it tells us whether the incomes of the poorest households are keeping pace with middle-income households across the UK. Looking at relative incomes after housing costs takes into account the impact that housing costs have on poverty.
Relative poverty after housing costs is the most commonly used poverty indicator in Scotland and the indicator helps measure progress towards the national (NPF) poverty outcome to 'tackle poverty by sharing opportunities, wealth and power more equally'.
Figure 8 shows that relative poverty had been falling slightly in the early 2000s and the lowest point in this time series was 2009-12. After that, it started to rise again up until 2017-20, when the rise appeared to stop.
Social capital
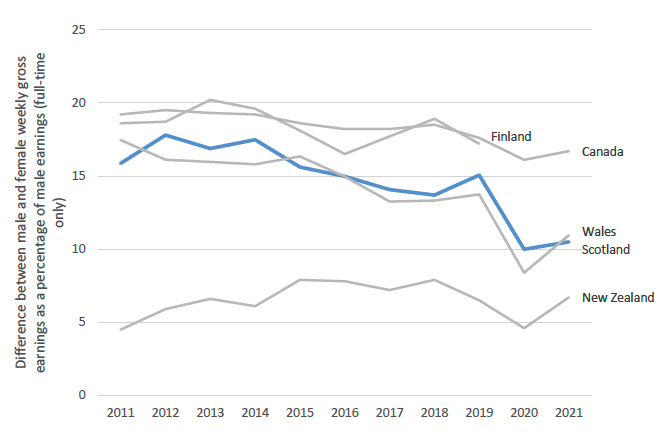
Figure 9: Gender Pay Gap
Source: Annual survey of hours and earnings: 2021; OECD
A wellbeing economy should value diversity and recognise the fundamental equality of all people. The existence of a gender pay gap suggests that economic benefits are not being spread widely or fairly because women are facing systemic barriers. We should aim to close the gender pay gap as it reflects the divergent experiences women and men have not only in employment but also in education, training, care and other unpaid domestic labour, which have caused a persistent undervaluing of women's contribution to the economy[24].
This indicator tells us the difference between full-time male and female median earnings (gross weekly earnings excluding overtime) as a percentage of male earnings. It does not reflect the earnings of people who work part time (38% of women in employment, 13% of men in employment[25]).
Gender pay gap indicators help measure progress towards national Fair Work commitments, including the national (NPF) outcome to ensure 'we have thriving and innovative businesses, with quality jobs and fair work for everyone'; the Covid Recovery Strategyoutcome, 'more jobs in the labour market are fair work and green jobs[26]'; and the Fair Work Convention outcome to ensure 'security of employment, work and income[27]'. Gender pay gaps are reported in these contexts in terms of gaps in hourly earnings. In this publication, weekly earnings have been used to allow for international comparisons, noting that weekly earnings will be affected by the number of hours worked as well as by the hourly wage.
Figure 9 showsthe gender pay gap narrowing over the period from 2014 to 2021 overall, despite a slight increase from 10.0% in 2020 to 10.5% in 2021. Scotland's gender pay gap is seen to be larger than New Zealand's, but smaller than those in Canada and Finland throughout the period. The gender pay gap in Scotland and Wales has been broadly similar throughout the period.
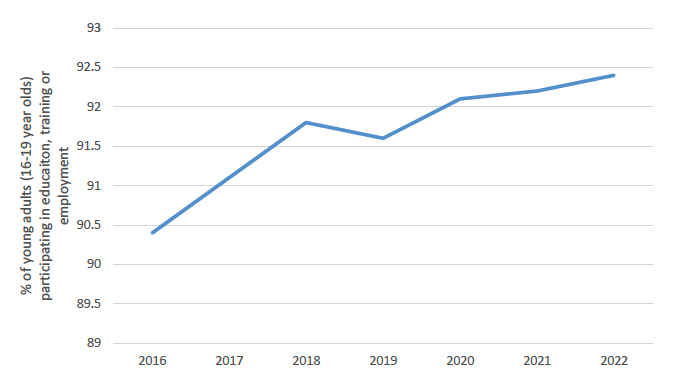
Source: Annual Participation Measure | Skills Development Scotland
A wellbeing economy should be resilient and able to effectively respond to external risks and shocks as this will provide wellbeing for both current and future generations. We want to ensure young people are actively participating in productive activities that will build their capabilities to increase the nation's economic resilience and collective wellbeing.
This indicator tells us what percentage of the nation's aged 16-19 cohort (not just those that have left school) are participating in education, training or employment. Participation is defined as: School pupil; Further Education; Higher Education; Modern Apprenticeship; Full-Time Employment; Part-Time Employment; Self-Employed; Data Import (Employed); Employability Fund Stages 2-4 Participants (Reported between 2016 and 2022); Other Formal Training; Personal/Skills Development; Voluntary Work; Activity Agreements (Reported between 2016 and 2019)[28]. Participation classification is based on whether an individual spent the greatest number of days within the year participating in one or more of these activities. This indicator helps measure progress towards the national (NPF) education outcome to ensure 'we are well educated, skilled and able to contribute to society'.
Figure 10shows the percentage of young adults (16–19-year-olds) participating in education, training or employment rising from 90.4% in 2016 to 92.4% in 2022.
Produced and financial capital
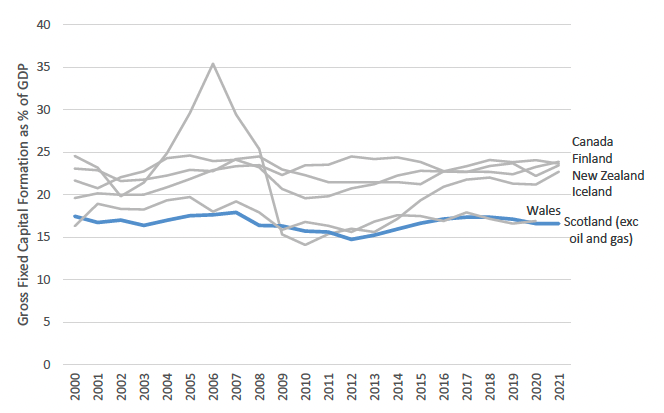
Source: GDP Quarterly National Accounts: 2021 Quarter 4 (October to December); Regional gross fixed capital formation; OECD
A wellbeing economy should serve the collective wellbeing of both current and future generations, implying a need for investment in the future alongside current consumption. Investment in capital increases our capacity to deliver goods and services which can in turn improve people's quality of life.
This indicator tells us the value of net capital expenditure by both the public and private sector as a % of national GDP. Capital expenditure includes spending on dwellings, other buildings and structures, transport, intellectual property, ICT, and cultivated assets[29]. This indicator does not include spending on stockpiles and work in progress as these are not fixed capital assets. Considering Gross Fixed Capital Formation (GFCF) as a % of GDP gives an indication of the balance in the economy between consumption and investment.
Figure 11 shows Scotland below the comparator countries in 2021 (the latest year for which data is available) at 16.6%, while the comparators are clustered between 22% and 24%. Wales data is only available up until 2020 and performance was broadly similar to Scotland's throughout the period.
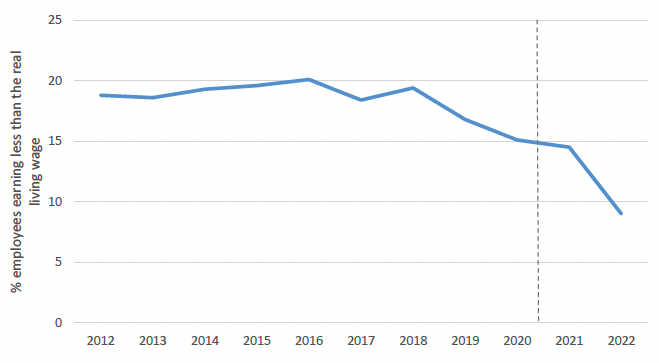
Source: Annual Survey of Hours and Earnings
A wellbeing economy should address deep-seated poverty challenges by transforming the sectors where low pay or precarious work are most prevalent. Business models that rely on low pay are not sustainable and are incompatible with our vision of a wellbeing economy[30]. Evidence has suggested that not earning the living wage is linked with negative wellbeing outcomes such as being unable to afford basic necessities and being unable to spend desired quality time with family[31].
This indicator tells us the proportion of employees aged 18 and over who are earning less than the real living wage. The real living wage rates have been independently calculated by the Resolution Foundation according to the cost of living based on household goods and services and are overseen by the Living Wage Commission[32]".
This indicator helps measure progress towards national Fair Work commitments, including the national (NPF) fair work and business outcome to ensure 'we have thriving and innovative businesses, with quality jobs and fair work for everyone'; the Covid Recovery Strategyoutcome, 'more jobs in the labour market are fair work and green jobs[33]'; and the Fair Work Convention outcome to ensure 'security of employment, work and income[34]'.
Figure 12shows the proportion of employees earning less than the real living wage decreased from 14.5% in 2021 to 9.0% in 2022[35]. This continues the downward trend seen since 2018[36].
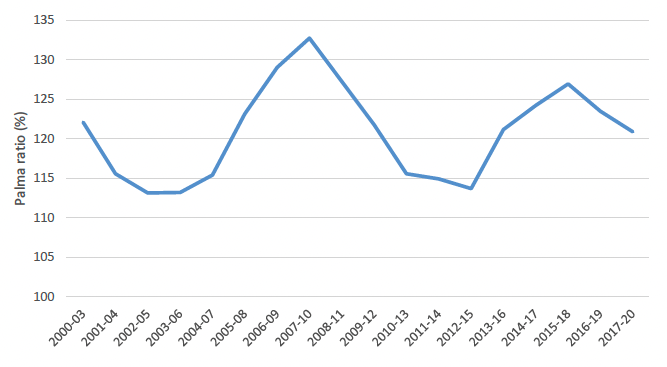
Source: Poverty and Income Inequality in Scotland 2017-20
A wellbeing economy should promote equality and ensure a just distribution of income, wealth and power. The evidence that large income differences have damaging health and social consequences is strong. Narrowing the gap will improve the population's health and wellbeing[37].
This indicator measures income inequality in Scotland by the Palma ratio (the total income of the top ten percent of the population divided by the total income of the bottom forty percent of the population). Therefore, this indicator tells us how much more income top-income households have compared to those at the bottom. This indicator estimates income from all sources (including earnings, benefits, tax credits, pensions, and investments) after deductions for income tax, national insurance contributions, council tax, pension contributions and maintenance payments, but before deductions for housing costs such as rent and/or mortgage payments. This indicator is usually calculated from income before housing costs. After-housing-costs incomes are distributed more unequally. Household income has been equivalised to adjust for the fact that larger families require larger, but less than proportionally larger, incomes to achieve similar standards of living.
This indicator helps measure progress towards the national (NPF) economy outcome to 'have a globally competitive, entrepreneurial, inclusive and sustainable economy'.
Figure 13 shows income inequality fluctuating throughout the period, reaching a high of 132.7% in 2007-10. It had been decreasing from the most recent high in 2015-18.
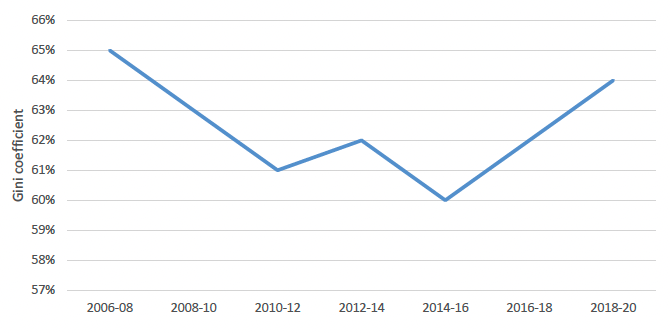
Source: Wealth in Scotland 2006-20
As previously mentioned, a wellbeing economy should promote equality and ensure a just distribution of income, wealth and power. Wealth is a key component of wellbeing as people use their wealth to improve current or future living standards, to invest in opportunities such as education or entrepreneurial activities, or to provide a buffer for emergencies such as unemployment or illness[38].
This indicator tells us how wealth is distributed within the population overall by referring to the personal wealth of households, including the financial, physical, property and pension wealth of all household members[39]. Business assets are not part of this. This indicator uses the Gini coefficient, which is a statistical measure of dispersion often used to assess economic inequality. The Gini coefficient ranges from 0% to 100%. 0% means all households have the same wealth, and 100% means one household has all the wealth and all other households have none. The Gini coefficient is widely used, but it is sometimes considered overly sensitive to changes in the middle, and not sensitive enough to changes at the top and the bottom. The Palma ratio[40] focuses on the top and the bottom of the distribution only. In practice however, both Gini and Palma measures show very similar trends. The Gini coefficient helps measure progress towards our national (NPF) poverty outcome 'to tackle poverty by sharing opportunities, wealth and power more equally'.
Figure 14 shows the Gini coefficient of total wealth was 64% in 2018-2020. It had been broadly stable since 2006-2008, when data collection began, ranging between 60% and 65%.
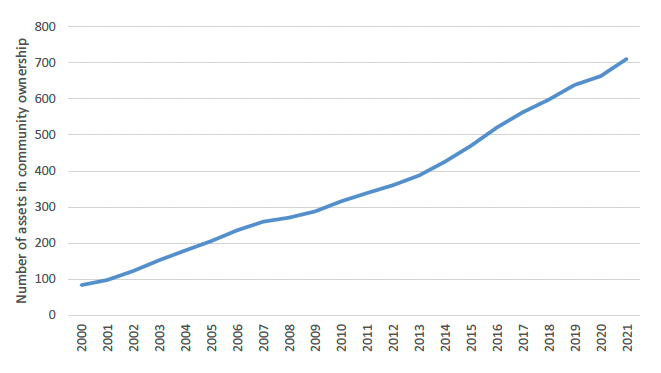
Source: Community ownership in Scotland
A wellbeing economy should be shaped and formed so that it is locally rooted and determined by active engagement of communities. Community ownership of assets allows citizens to take on a degree of responsibility for their communities and can ensure that valued local resources are nurtured and protected.
This indicator tells us the number of assets (defined as areas of land, buildings or anything else of substantial value) that community groups own. A community group is locally led; has a sufficient level of community support; membership is open to all in that community; it is non-profit distributing; and its main purpose is the furthering of sustainable development in the local area. As there is currently no definitive source of assets in community ownership, the data published by the Scottish Government is sourced from a variety of organisations involved in community asset ownership, including those involved in providing community groups with funding to purchase assets. The data collected from these sources is quality assured by the Scottish Government and then is sent to the Registers of Scotland who verify it against the Land Register[41]. Only those assets where the transfer of ownership has completed are included in the published statistics.
Depending on the complexity of the legal process, there may be a period of years between an asset first being reported to the Scottish Government and its inclusion in the published statistics. Note that where the year of purchase or transfer of the asset is unknown, it has been defaulted to 2000, the start of the series. In addition, the whole time series is revised, where necessary, with the release of each publication to take into account assets which have been in community ownership for some years but only in the most recent year been reported to the Scottish Government. Or where assets are found to be no longer in community ownership so are removed from the time series.
This indicator helps measure progress towards the national (NPF) communities outcome, 'we live in communities that are inclusive, empowered, resilient and safe'.
Figure 15 shows that 711 assets were in community ownership as at 31st December 2021. This is a 7% increase from 663 assets in 2020 and an eightfold increase from 84 assets in 2000. These assets were owned by 484 groups and covered an area of 211,998 hectares.
Contact
Email: polly.legrand@gov.scot