Understanding the local economic impacts of natural capital investment
This report outlines new economic analysis that quantifies the typical contributions to local economies, measured as output and jobs created, from four key natural capital investments, including peatland restoration and woodland creation.
Case studies
To ensure that the Input-Output (I-O) models are fit for purpose and to demonstrate their capabilities, three case study assessments were undertaken as part of this project. The case studies were identified during the desk top review process and through collaboration with the Borderlands Inclusive Growth Deal team. The case studies were chosen to represent common scenarios for each of the natural capital investments considered.
A summary of the case study results is provided in Figure 8 and Figure 9, and the main findings of the assessment are described below. The results include the project area of the case study and the total capital expenditure, which provide an insight into the difference in scale of the three case studies. The output effect is always greater than capital expenditure and represents the indirect impact of any capital expenditure on natural capital projects in the local economy. The potential number of jobs created by the capital expenditure and the output effect is shown as the direct jobs and direct + indirect jobs respectively.
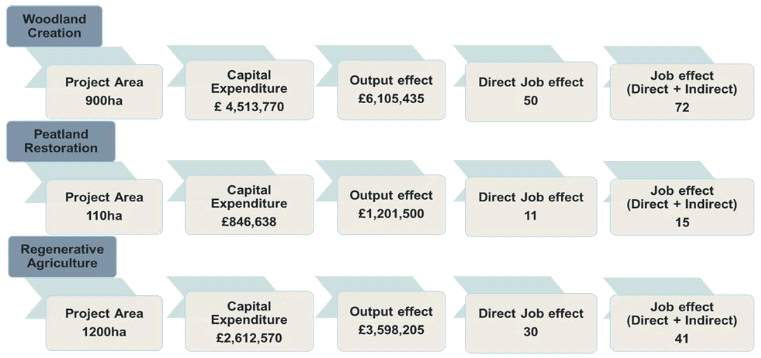
All three case studies require substantial labour inputs, which is a good indicator that they will support local jobs. However, some of these jobs require skilled workers so any future investments in these types of natural capital project should consider provision of adequate training and skills development, regionally and locally.
For the case study investments considered, the capital expenditure per hectare is around £5k, £7.7k and £2.2k for woodland creation, peatland restoration and regenerative agriculture respectively. This variation in expenditure per hectare should be taken into consideration on a site-by-site basis as the costs of the activities can vary significantly for the three different natural capital investment categories. The capital expenditure share is unique to the case study inputs and attributes and is likely to change under different natural capital investment scenarios (e.g. in terms of stocking density in the case of woodland).
Expenditure per job is £36,998, £32,563 and £36,797 for woodland creation, peatland restoration and regenerative agriculture respectively, suggesting that for a given level of investment, the three case study projects would generate more or less similar numbers of jobs.
Woodland creation case study data inputs
The woodland creation case study assessment used a natural capital project in the Borderlands Inclusive Growth Deal: Strategic Proposition. The case study includes the creation of 900 hectares of woodland within currently unproductive farmland. The woodland would be created across several sites by a group of farms working collaboratively. The aim of project is to create a low density broadleaf woodland that provides profitability at the farm scale. As part of the case study there would be no additional fencing added to the perimeter of the woodland creation sites. The scenario characteristics used in the case study are shown in Table 3 below.
| Site Characteristics | |
|---|---|
| Size (ha) | 900 |
| Perimeter to be fenced (M) | 0 |
| Planting density per hectare | 950 |
Peatland restoration case study data inputs
The peatland restoration case study was based on a real life project in the Cairngorms. This multi-year project, aimed to restore over 110ha blanket bog within the region and assist in reducing organic sediment load in the Spey catchment, reverse carbon loss through erosion and improve habitat for biodiversity. The project used a number of techniques:
- Re-profiling of eroded gullies;
- Repairing areas of micro erosion;
- the installation of stone dams; and
- The use of mulch filled hessian bales.
The scenario characteristics used in the case study are shown below in Table 4.
| Site Characteristics | |
|---|---|
| Size (ha) | 110 |
| Perimeter to be fenced (M) | 0 |
| Area requiring hand restoration (ha) | 5 |
| Number of dams to be installed | 20 |
Regenerative agriculture case study data inputs
The regenerative agriculture case study assessment used a natural capital project in the Borderlands Inclusive Growth Deal: Strategic Proposition. The proposed project is a pilot to deliver a sustainable approach to agricultural production across 1,200 ha of land. Within the project, 300 ha of priority meadow habitat will be improved, and 120 ha of new woodland will be created. The rest of the study will be transition to conservation management techniques including no till ploughing and rotational grazing. The whole project would require upskilling in regenerative agricultural land management techniques. The scenario characteristics used in the case study are shown below in Table 5.
| Site Characteristics | Ha |
|---|---|
| Size | 1200 |
| Area of rotational grazing | 350 |
| Area of no till soil management | 350 |
| Area of cover crops | 350 |
| Area of wildflower planting | 300 |
| Area of wetland creation | 0 |
| Area of woodland planting | 120 |
| Area of Peatland Restoration | 0 |
Summary of total economic impacts
A summary of the total capital expenditure estimated for each case study scenario is provided below (Table 6, Table 7, Table 8). The woodland creation scenario was estimated to have the highest capital expenditure of £4,514,000 with the peatland restoration case having the lowest at £846,638.
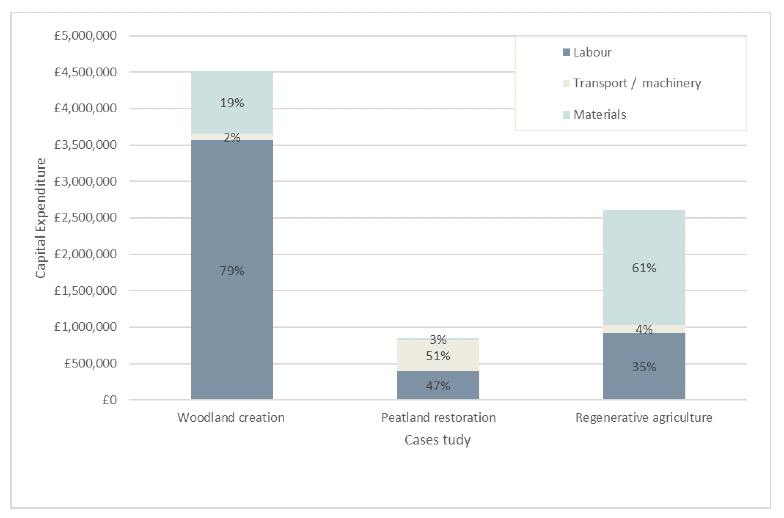
Across all case studies, the majority of the activities (by number) were classified within the 'labour' economic linkage category, however the 'materials' category contained the highest capital expenditure value for the both woodland creation and regenerative agriculture cases. It was noted that there were no products from any of the case studies due their characteristics (e.g. the lack of timber production within the woodland creation case study).
| Economic Linkage Category | Distribution of Economic categories | ||
|---|---|---|---|
| Activity count | Capital Expenditure | Capital Expenditure % | |
| Labour | 18 | £3,568,770 | 79% |
| Transportation / Machinery | 2 | £90,000 | 2% |
| Materials | 6 | £855,000 | 19% |
| Products | 0 | £0 | 0% |
| Total | 23 | £ 4,513,770 | 100% |
| Economic Linkage Category | Distribution of Economic categories | ||
|---|---|---|---|
| Activity count | Capital expenditure | Capital expenditure % | |
| Labour | 9 | £394,210 | 47% |
| Transportation / Machinery | 5 | £429,000 | 51% |
| Materials | 3 | £23,428 | 3% |
| Products | 0 | £0 | 0% |
| Total | 17 | £846,638 | 100% |
| Economic Linkage Category | Distribution of Economic categories | ||
|---|---|---|---|
| Activity count | Capital expenditure | Capital expenditure share | |
| Labour | 15 | £920,950 | 35% |
| Transportation / Machinery | 5 | £109,500 | 4% |
| Materials | 6 | £1,582,120 | 61% |
| Products | 0 | £0 | 0% |
| Total | 26 | £2,612,570 | 100% |
The I-O model also provided a breakdown of the total cost (capital expenditure) for each SIC code in the economic linkage categories across the three case studies (Table 9). In the woodland creation and peatland restoration case studies, the majority of the cost was in the 'support services to forestry' SIC code (64% and 51% respectively). For the regenerative agriculture case study, the majority of the cost (57%) was in the 'wholesale of agricultural machinery etc' SIC code.
Other areas of higher cost (capital expenditure) across the case studies included: 'environmental consulting activities' in the peatland case (46%); 'plant propagation' in the forestry case (18%); and 'support activities for crop production' in the regenerative agriculture case (25%).
| Economic linkage category | SIC Code Description | Sum of Financial cost (capital expenditure) | |||||
|---|---|---|---|---|---|---|---|
| Woodland creation | % of total cost | Peatland Restoration | % of total cost | Regenerative Agriculture | % of total cost | ||
| Labour | Environmental consulting activities | £40,950 | 1% | £390,250 | 46% | £450 | 0% |
| Hunting, trapping and related service activities | £455,400 | 10% | £660 | 0% | £0 | 0% | |
| Support services to forestry | £2,892,240 | 64% | £429,000 | 51% | £312,120 | 12% | |
| Construction of other civil engineering projects | £27,000 | 1% | £18,588 | 2% | £0 | 0% | |
| Other professional, scientific and technical activities (not environmental consultancy) | £0 | 0% | £0 | 0% | £25,000 | 1% | |
| Support activities for crop production | £0 | 0% | £0 | 0% | £652,500 | 25% | |
| Machinery / transportation | Renting and leasing of agricultural machinery and equipment | £90,000 | 2% | £8,140 | 1% | £109,500 | 4% |
| Materials | Plant propagation | £810,000 | 18% | £0 | 0% | £28,000 | 1% |
| Wholesale of agricultural machinery, equipment and supplies | £0 | 0% | £8,140 | 1% | £1,485,000 | 57% | |
| Grand Total | £4,513,770 | 100% | £846,638 | 100% | £2,612,570 | 100% | |
The output from the I-O model also included the total output effect, employment effect and the Employment effect (Direct + indirect) for each of the SIC codes across the three case studies. Overall the woodland creation employment multipliers predicted that a total of 50 jobs would be created as part of the woodland creation case study (Table 10, Table 11, Table 12). Model estimates suggest less jobs generated as part of the other case studies, particularly in the case of peatland restoration (11 jobs). The regenerative agriculture case was predicted to generate 30 jobs. Though as noted above, for a given level of investment, the jobs impact would be similar across all three case studies.
The woodland creation case study also had the largest output effect of £6,105,435 showing a larger contribution to the local economy than just the overall cost. This larger output effect than total captial expenditure was seen across all three cases studies.
| SIC Description | Sum of Output effect | Sum of Employment effect | Sum of Employment effect (Direct + indirect) |
|---|---|---|---|
| Construction of other civil engineering projects | £41,554 | 0.4 | 0.5 |
| Environmental consulting activities | £54,474 | 0.6 | 0.8 |
| Hunting, trapping and related service activities | £693,890 | 6.0 | 9.1 |
| Plant propagation | £1,234,191 | 11.2 | 17.1 |
| Renting and leasing of agricultural machinery and equipment | £109,230 | 1.2 | 1.4 |
| Support services to forestry | £3,972,096 | 31.1 | 42.7 |
| Wholesale of agricultural machinery, equipment and supplies | £0 | 0.0 | 0.0 |
| Logging | £0 | 0.0 | 0.0 |
| Grand Total | £6,105,435 | 50 | 72 |
| SIC Description | Sum of Output effect | Sum of Employment effect | Sum of Employment effect (Direct + indirect) |
|---|---|---|---|
| Construction of other civil engineering projects | £28,608 | 0.2 | 0.4 |
| Environmental consulting activities | £640,405 | 4.7 | 7.7 |
| Hunting, trapping and related service activities | £1,006 | 0.0 | 0.0 |
| Renting and leasing of agricultural machinery and equipment | £520,665 | 5.7 | 6.9 |
| Support services to forestry | £0 | 0.0 | 0.0 |
| Wholesale of agricultural machinery, equipment and supplies | £10,816 | 0.1 | 0.1 |
| Grand Total | £1,201,500 | 11 | 15 |
| SIC description | Sum of Output effect | Sum of Employment effect | Sum of Employment effect (Direct + indirect) |
|---|---|---|---|
| Environmental consulting activities | £599 | 0.0 | 0.0 |
| Plant propagation | £42,663 | 0.4 | 0.6 |
| Renting and leasing of agricultural machinery and equipment | £132,897 | 1.4 | 1.8 |
| Support services to forestry | £428,654 | 3.2 | 4.4 |
| Wholesale of agricultural machinery, equipment and supplies | £1,973,182 | 16.0 | 21.2 |
| Other professional, scientific and technical activities (not environmental consultancy) | £26,000 | 0.3 | 0.4 |
| Support activities for crop production | £994,209 | 8.6 | 13.1 |
| Grand Total | £3,598,205 | 30 | 41 |
Contact
Email: peter.phillips@gov.scot