Understanding the local economic impacts of natural capital investment
This report outlines new economic analysis that quantifies the typical contributions to local economies, measured as output and jobs created, from four key natural capital investments, including peatland restoration and woodland creation.
Input-Output model guide
Each Input-Output (I-O) model developed is unique to each of the four specific natural capital investments considered in this project, however they all follow the same structure and process to generate results.
The model contains five separate sheets:
1. An initial 'readme' instruction sheet;
2. A scenario summary;
3. The Input-Output model;
4. The model result sheets; and
5. The reference data.
Further information on the different elements of the model and how to interpret them is provided in the sub-sections below. Screenshots from the model have been included for illustrative purposes only. This part of the report is best read in conjunction with the models themselves, which are available as standalone supporting documents to this Final Research Report.
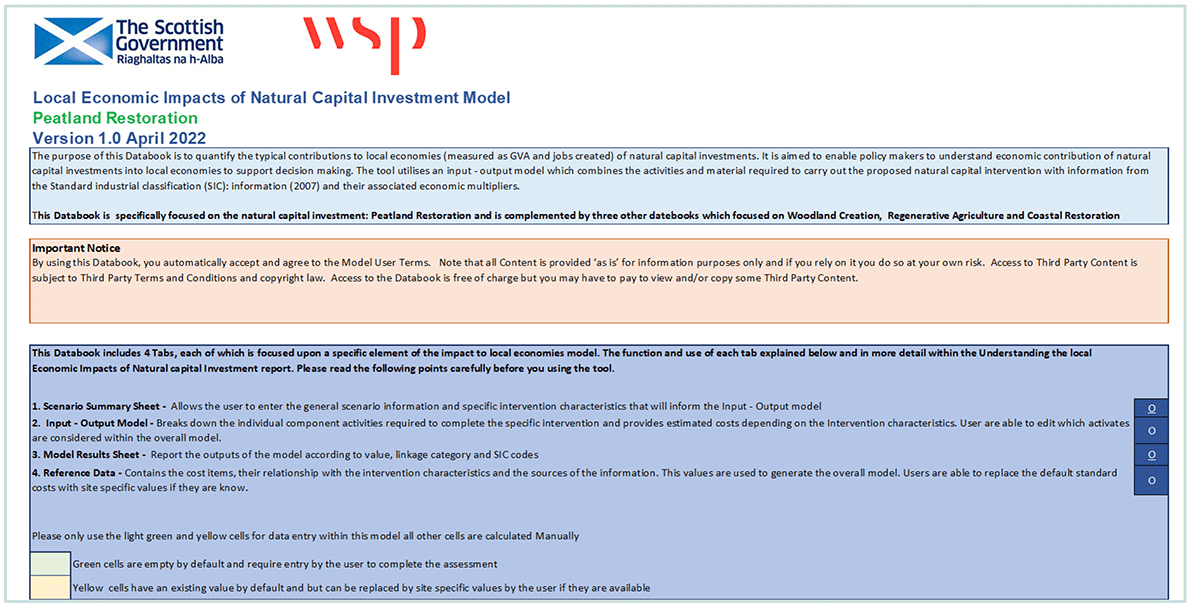
Readme instruction sheets
These provide an overview of the tool and its purpose and guides the user on how to carry out an assessment. The sheet includes guidance on the cells the user can edit and which should remain locked.
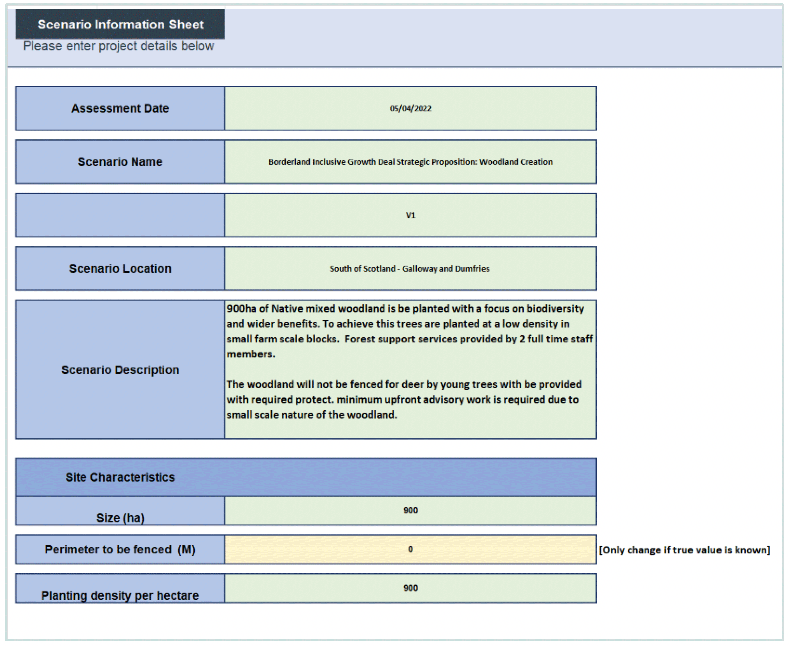
Natural capital investment scenario summary sheets
These sheets allows the user to input project specific information such as the assessment date and scenario name, location and description. They enable the user to input the site characteristics, such as intervention size, perimeter to be fenced and tree planting density. The characteristics entered will define the results of the modelling process.
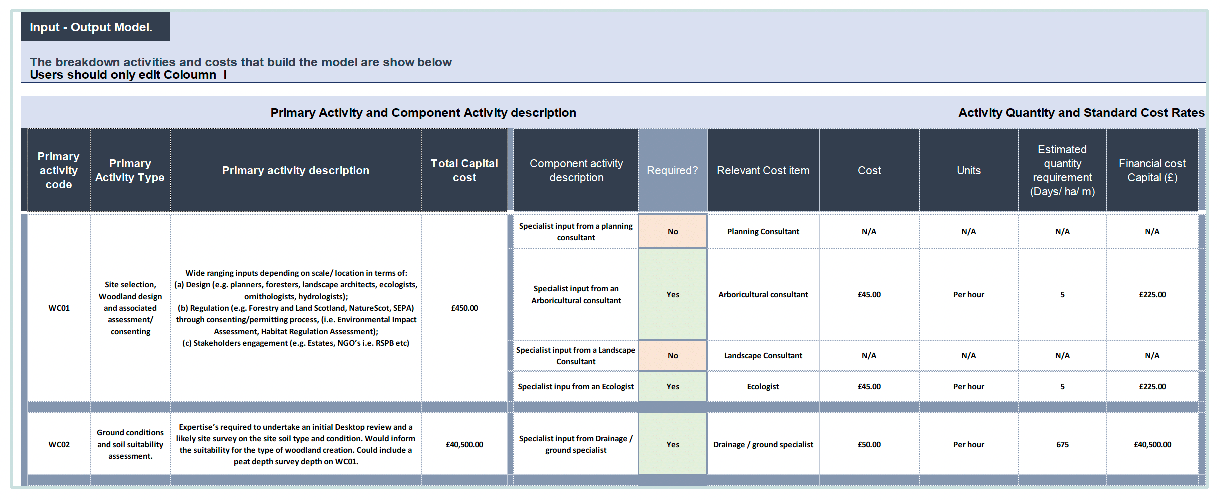
Input-Output model
The I-O model sheet breaks down the individual activities and costs that are used to build up the model and generate the results. The cells within this sheet are mainly locked and for view only purposes. However, users are able to edit 'Column I' in order to include or exclude activities within their assessment scenario. This function allows users to ensure the model accurately reflects the intervention they are assessing. The I-O model sheet also shows users information such as the economic linkage category of each activity and the relevant economic multipliers.
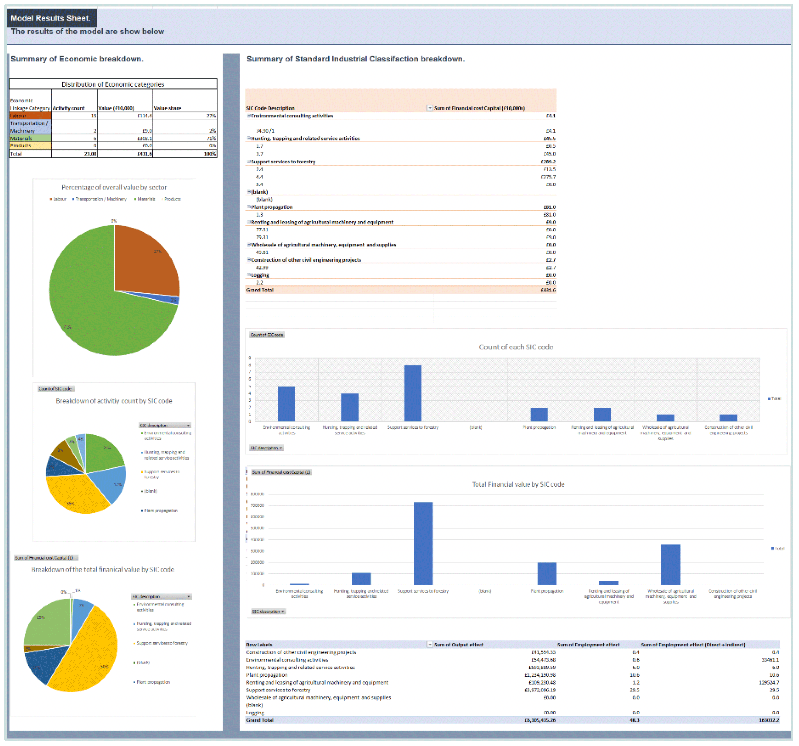
Model results sheet
The model results sheet shows users the results of the I-O model and breaks down the results into different categories to show clearly the impact of investment across these categories. The results of the assessment including the total capital expenditure of the intervention, the number of jobs potentially created and total output effect are broken down by SIC code and per economic linkage category (labour, materials etc). The sheet is read only and will update as the site characteristics and relevant activities are updated by the user.
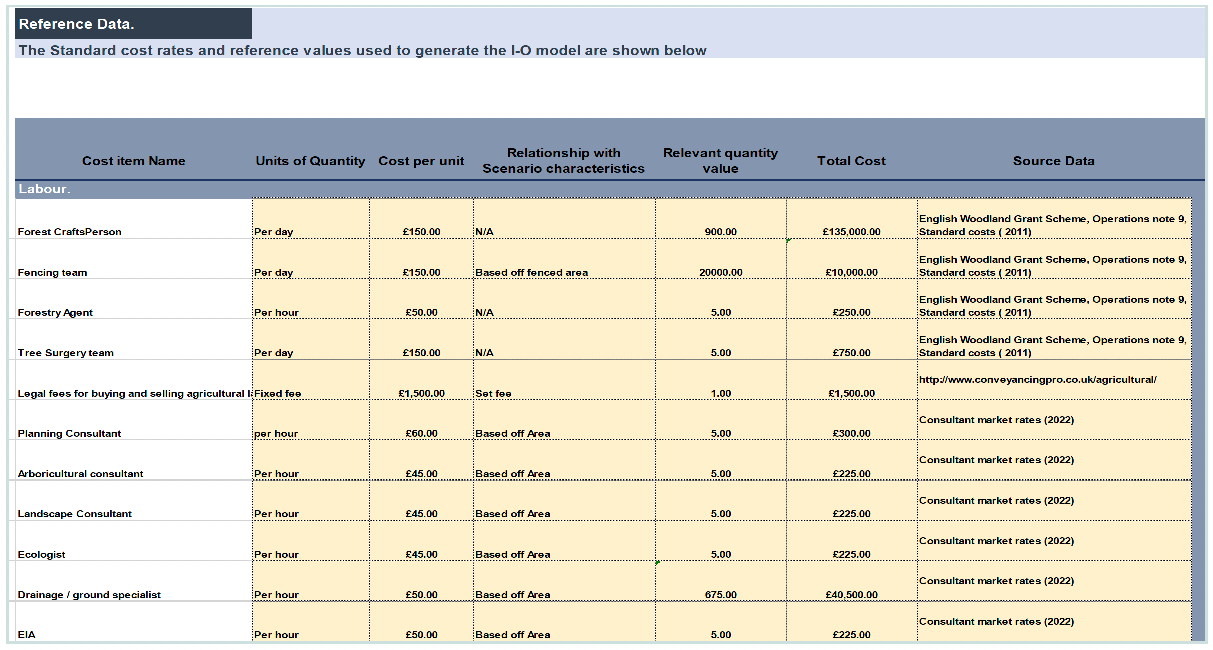
Reference data sheet
The reference data sheet provides the user with the sources for the standard costs used in the model and their relationship with the scenario characteristics. This sheet contains all of the activities referenced within the I-O model sheet and additional activities that may also be relevant to certain projects. The sheet enables the user to edit the existing references or include new activities when better sources of data are available. The purpose of the sheet is to enable users to tailor the assessment and the values used within it to suit their particular needs.
Model interpretation, accuracy and assumptions
In summary, the I-O model converts the capital expenditure on an area of land for natural capital investment into jobs. The capital expenditure was split by economic linkage category: labour cost; and expenditure on materials, products and transport. This direct expenditure into the local economy creates an output effect, which is defined as the ripple effect of the expenditure through the supply chain. This ripple effect is measured by multipliers from the I-O tables. Multipliers are measures of the way in which an increase in activity by one firm will lead to an increase in activity by other related firms. For example, the contractor who installs deer fencing buys timber, the timber merchant buys new tyres for their trucks, all the firms' workers spend their wages on food or consumer goods, and so forth. Hence, the output effect captures the direct and indirect impact of any capital expenditure in the local economy. Direct and indirect jobs were calculated by multiplying the employment effect multiplier with capital expenditure and output effect respectively.
The I-O model was generated using the best available information and standard cost rates for Scotland. The values within the model represent an average of the cost for each activity across a variety of factors including the scale of the intervention, the geographical location and socio-economic context. Therefore the values used within the model will not always be the best fit for the specific local context in question. The model is anticipated to support early stage business cases and provide an initial estimate of the total capital expenditure, output effect and number of jobs created by natural capital investment. However, it should not be used to support full business case analysis of local level projects without additional information.
The I-O model allows the user to replace or supplement the existing reference data with local level information which would modify the relationship between the site characteristics and the magnitude of each activity. This will enable users to ensure the model is appropriate to the scenario they wish to assess. However, justification should be provided whenever elements of the reference data sheet are edited.
The model provides results to the nearest £ however it is advised that final values are rounded to the nearest £10,000 when reporting to give an indication of the level of accuracy. The desktop review and stakeholder consultation demonstrated a lack of information and agreed values for standard costs across many of the activities within the different intervention models, so there is a degree of uncertainty built into the model given the reference data used in this current iteration (May 2022). Initial comparison indicates that the model is in line with other tools. Comparison with the initial cost estimations within the Borderlands Inclusive Growth Deal Natural Capital Proposition show that the I-O model provides values in line with these estimations.
This lack of information should be addressed in order to improve the accuracy of future iterations of the I-O model and to allow more certainty in the results of the assessments. This information should be obtained through further consultation with stakeholders initially approached as part of this project including FLS and NatureScot Peatland ACTION. It is envisaged that the reference values within this model could be updated periodically to reflect the latest knowledge and information available.
Contact
Email: peter.phillips@gov.scot