Understanding the local economic impacts of natural capital investment
This report outlines new economic analysis that quantifies the typical contributions to local economies, measured as output and jobs created, from four key natural capital investments, including peatland restoration and woodland creation.
Project Approach
A summary of the project approached used by WSP is provided in Figure 1. The project was broken up into four phases: (1) desktop review; (2) stakeholder engagement; (3) Input-Output (I-O) model development; and (4) case study trial assessment. Further detail of each phase is provided below in Figure 1.
Figure 1: Overview of the project approach
1. Desktop review
- Review previous research, datasets and relevant documents to inform the study and obtain data required for the model.
- Quantify the resource required for each activity relevant metric i.e. person days / hours involved, skill requirements, materials, travel, training.
- Gap Analysis of the results of the desktop review and identifaction of targets for further research.
2. Stakeholder Engagement
- Undertake stakeholder engagement process to support the mapping of economic linkages of natural capital projects and the input output calculations.
- Supplement the results of the desktop review the findings from the stakeholder engagement process.
3. Input-Output model development
- Generate an Input-Output model in excel using the results for the data collection process.
- Create a user guide and sensitivity analysis
4. Case study assessments
- Undertake three case study assessments across several different Natural Capital investment types
Desktop review
To ensure the model incorporated the most appropriate data and costs a review of previous research datasets and relevant documents was undertaken. This review aimed to identify previous studies that undertook primary research that could be incorporated as part of this project, and help to classify the potential activities within each of the different natural capital investment types. The example data sources used within the desktop review include:
- Previous studies undertaken by Scottish Government and partners;
- Research by relevant government agencies such as Forestry and Land Scotland (FLS) and NatureScot and research institutes like the James Hutton Institute (JHI); and
- Guidance documents and project case studies produced by relevant experts within each of the natural capital investment types (e.g. NatureScot Peatland ACTION).
A full list of the different sources identified as part of desktop review for each intervention is provided in Appendix A: Desktop Literature Review Sources Sources.
The results of the desktop review were used to generate a list of the potential activities that might be undertaken for each natural capital investment type. For example, within woodland creation the potential activities ranged from the stocking of new areas of woodland to the installation of new land drainage. Where necessary potential activities were broken down into component activities to distinguish between different skills or labour and materials as shown in Table 1.
Table 1: Example of potential activities within Input-Output model
Primary Activity Type: Supply of trees
Primary activity description: Labour required to carry out stocking of saplings across the site
Component activity description: Supply of trees for plant
Economic linkage Category: Materials
Component activity description: Planting of trees
Economic linkage Category: Labour
Each of the potential activities associated with the natural capital investments were linked to a UK Standard Industrial Classification[7] (SIC) code that best represented the potential activity. This was undertaken to facilitate the I-O modelling[8] and demonstrate the link between the physical activity and the potential economic impact. The link was based of the type of activity (i.e. labour, materials, machinery, products) and who would be likely to carry it out under a normal scenario. This research allowed for the list of activities for each intervention to be broken down according to the economic linkage category:
- Labour: Activity requires particular type of skills and expertise, quantified in terms of hourly wages.
- Materials: Activity requires specific inputs, raw products, intermediate products linked to the supply chain and other complementary sectors, quantified by e.g. the cost of post and wire fencing per meter.
- Transport & machinery: Activity is dependent on utilisation of transport or other types of capital equipment, quantified by e.g. the length of time a 360 degree excavator is required.
- Products: Activities generate certain products which have clear economic value, quantified by e.g. the value of timber produced from harvesting.
The expected magnitude of each activity was also identified, linked to the characteristics of the overall natural capital intervention (e.g. size of the site, stocking density). For example, within the primary activity of stocking the number of person days required to stock a hectare of woodland at a set planting density was established in addition to the number of saplings needed depending on the planting density.
Where available a financial cost was also assigned to each activity, this was related to the magnitude of the labour and / or the material costs identified through the desktop review (see example in Table 2).
| Cost item Name | Units of Quantity | Cost per unit | Relationship with Scenario characteristics | Total cost |
|---|---|---|---|---|
| Supply of trees | per tree | £0.50 | Number of trees required | £81,000 |
The desktop review was unable to identify all of the potential activities and their likely magnitude for each of the natural capital investment types due to the data available. To address this issue, a gap analysis was undertaken to identify where additional information was required to complete the I-O models. When the link between the potential activities and the SIC code was considered uncertain, the activities were also flagged within the gap analysis for further research. This gap analysis was used to guide the stakeholder engagement process and helped identify which stakeholders should be approached to provide insights to help address the identified gaps.
Stakeholder engagement
A stakeholder engagement process was designed to complement the desktop review and identify, as far as possible, all of the required information needed to successfully build the I-O model for each of the four natural capital investments considered. The stakeholders consulted for each of the interventions were identified through consultation with the Scottish Government steering group and through the results of the desktop review and case study analysis. The stakeholders consulted for each natural capital investment are provided in Appendix B.
The stakeholder engagement was undertaken through Microsoft Forms using separate online electronic surveys for each natural capital investment. Where required further follow up conversations with key stakeholders that had specific insights to the different interventions were undertaken. The results of the stakeholder consultation were used to help fill in the gaps identified from the desktop review and finalise the list of activities under each intervention.
Input-Output model development
The I-O models[9] were generated in Microsoft Excel using the results of the stakeholder engagement and desktop review. The process used to generate the results for the I-O model is shown in Figure 2 below.
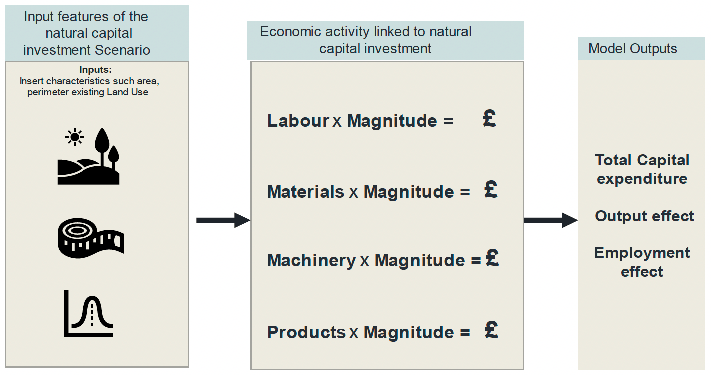
The potential activities for each natural capital investment identified through the literature review and stakeholder engagement were listed in the sequence that would be followed when developing a project. Each activity was assigned a standard cost that was identified from the literature and represents a best estimate for the average cost of that activity (e.g. 30p per tree planted in labour cost) or material (e.g. 50p per tree in material costs) across Scotland.
These costs were compiled in a reference sheet that contained a list of all the activities possibly required to carry out the four natural capital investments considered in the project. The site characteristics and the units for each activity were combined to allow the model to reflect the changes in scale associated with different site characteristics.
To allow the inclusion or exclusion of activities the "Required?" column was added which allowed users to select whether the individual component activities were considered within the final calculations or excluded from the assessment.
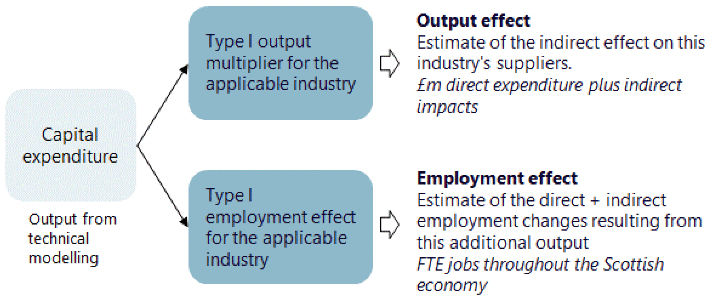
This process provided a final cost / expenditure for each activity, which was then combined with the relevant SIC code in order to assign the correct economic multipliers. This allowed for the Output effect, Employment effect and Employment effect (Direct + indirect)[10] to be reported for each activity, as shown below:
Case study assessments
To test the application of the I-O model and to gain an understanding of their sensitivity, three case study assessments were undertaken whereby the model was applied to real-life examples of natural capital investments. The case studies were identified from the stakeholder engagement process and collaboration with the Borderlands Inclusive Growth Deal: Strategic Proposition to deliver a Natural Capital Innovation Zone across the South of Scotland. The case studies chosen represented common scenarios for each natural capital investment type.
Contact
Email: peter.phillips@gov.scot