
Teacher Workforce Planning – 2025 exercise: statistical modelling of initial teacher education intake requirements
Annual teacher workforce modelling paper for informing advice made by the Teacher Workforce Advisory Planning Group on setting Initial Teacher Education course intake levels for the 2026-27 academic year.
3. Model Inputs
3.1. Teacher Numbers
In the past five years, we have seen a rise in teacher numbers of 1,165 (a 2% increase). There has been an increase in the secondary sector compared with 2019 but primary teacher numbers have decreased.
The 2% decrease in primary teachers (compared to the 5% decrease in primary pupils) since 2019 has meant that there are fewer pupils per teacher and consequently the primary PTR is now 15.5, higher than in 2020-2023 but still at a historically low level.
| Years | ELC1 | Primary | Secondary | Special | Centrally employed | All sectors | ||
|---|---|---|---|---|---|---|---|---|
| 2018-2023 | -15% | -2% | 6% | 11% | 17% | 2% | ||
Note 1: Early learning and childcare
3.2. Age profile of teachers
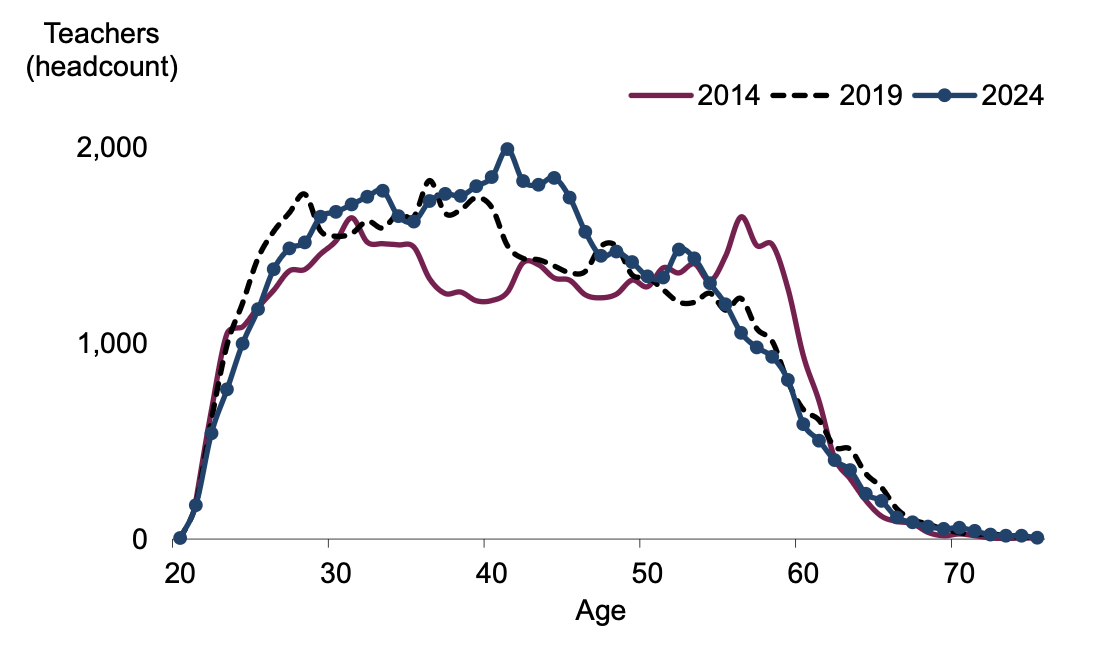
The age profile of teachers has changed much over the past 10 years. The prominent peak of teachers in their mid to late fifties, as seen in 2014, no longer exists. Teacher numbers are now relatively consistent from age 30 to 45 and reduce in the older age groups.
3.3. Reduction rates for teaching workforce
The teacher workforce reduction rates represent the sum changes for all teachers whose FTE has reduced and is expressed as a proportion of total teacher FTE between one teacher census and the next. Teachers on the Teacher Induction Scheme (TIS) have a different reduction rate pattern and so are treated separately (see TIS reduction rates below).
The higher reduction rates for women aged under 40 include maternity leave, whilst higher rates for those from their late-50s onwards reflect retirement (both full and partial). The assumed rates used in the modelling for future years are based on an average of the past five years.
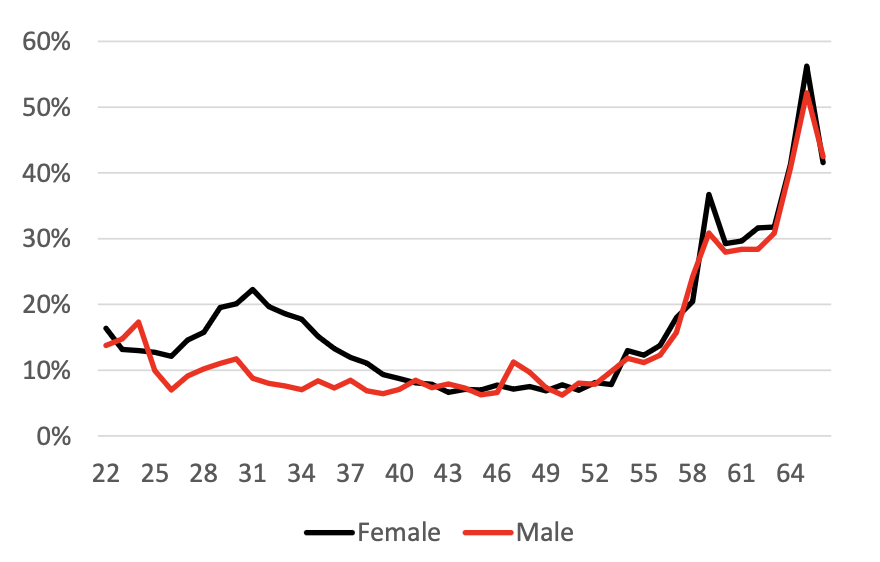
(ages of primary school teachers by gender and percentage leaving the profession)
The one-year reduction in primary teacher FTE for all ages, averaged over the past 5 years, is around 3,500 (excluding TIS).
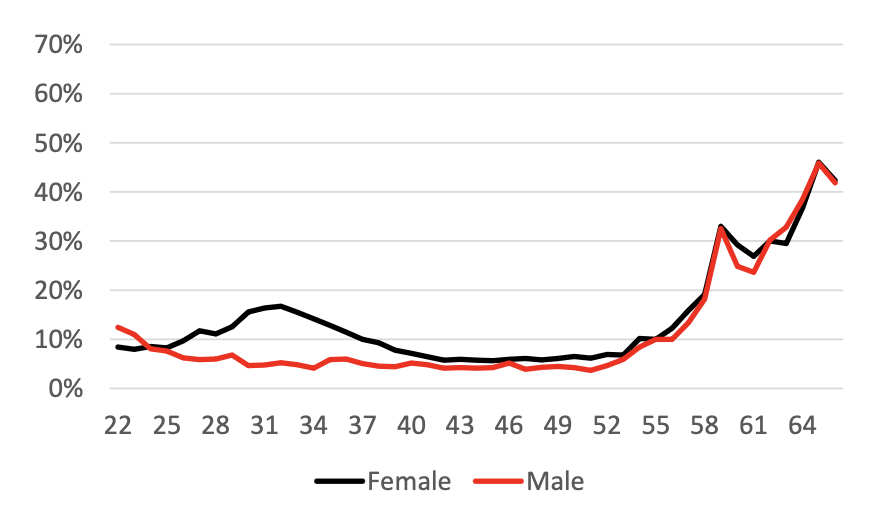
(ages of secondary school teachers by gender and percentage leaving the profession)
The one-year reduction in secondary teacher FTE for all ages, averaged over the past 5 years is around 2,700 (excluding TIS).
3.4. Additions to the teaching workforce
The number of additions to the teaching workforce represent the sum of all increases in FTE from one teacher census to the next. This number includes existing teachers increasing their hours and the appearance of teachers in the later census having not been present in the first. This latter category includes teachers returning to teaching after an absence of over a year as well as new teachers from outside Scotland and those on non-TIS probation routes. TIS probation teachers are accounted for separately.
Numbers are used instead of rates for additions as we do not have details of the pool of non-working teachers in any year. The assumed rates used in the modelling for future years are based on an average of the past five years. This equated to around 2,500 FTE primary teacher and 2,000 FTE secondary teachers.
3.5. Working patterns
There has been an overall increase in the proportion of teachers working part-time over recent years from 23% in 2017 to nearly 27% in 2024. The move to part-time working has been accounted for in the model, within the reduction and additions assumptions described above.
| Year | Full-time | Part-time | Total headcount | Percentage part-time |
|---|---|---|---|---|
| 2017 | 43,016 | 12,693 | 55,709 | 22.8 |
| 2018 | 43,198 | 13,265 | 56,463 | 23.5 |
| 2019 | 43,246 | 13,620 | 56,866 | 24.0 |
| 2020 | 44,387 | 13,564 | 57,951 | 23.4 |
| 2021 | 45,006 | 13,924 | 58,930 | 23.6 |
| 2022 | 44,493 | 14,419 | 58,912 | 24.5 |
| 2023 | 43,854 | 15,123 | 58,977 | 25.6 |
| 2024 Primary | 18,484 | 9,739 | 28,223 | 34.5 |
| 2024 Secondary | 21,600 | 5,196 | 26,796 | 19.4 |
| 2024 Special | 1,718 | 680 | 2,398 | 28.4 |
| 2024 CE | 788 | 679 | 1,467 | 46.3 |
|
2024 Total |
42,838 | 15,593 | 58,431 | 26.7 |
(CE = centrally employed)
3.6. Teacher Induction Scheme (TIS) reduction rates
The reduction rate for TIS represents the reduction in FTE of teachers between their TIS year and post-probation employment in the following year. Therefore, this rate accounts for reductions in FTE between TIS and post-probation due to teachers taking-up part-time posts following TIS, as well as reduction in FTE (to zero) of teachers not securing post-probation employment in the year following their probation.
In previous years, the assumed TIS reduction rate used in the model was based on the average of the reduction rates observed over the past five years This assumption relies on the underlying premise that the limiting factor in teachers taking up post-probation employment is largely determined by the inclination of teachers to take up the available posts. However, evidence (e.g. analysis presented at the 2024 workforce planning meeting), indicates that between 2019/20 and 2022/23, around 950 primary teachers completed probation but were not able to secure subsequent employment because of job availability. Continuing with the assumption that the TIS reduction rate would match the average observed over the past five years would mean continuing to add to the oversupply of teachers.
Therefore, this iteration of the model assumes a TIS reduction rate of 10%. This rate reflects the normal level of attrition observed in the historical data from times when job availability was not the main limiting factor in teachers taking up post-probation employment.
3.7. Retention rates for ITE
Retention rates for ITE represent the proportion of students that embark on an ITE course and then go on to the TIS. These rates vary between the route used for ITE study. Retention rates for primary undergraduate and for PGDE courses are around 70% and 80% respectively. Rates for secondary courses are around 65% for undergraduate (including combined degrees) and 70% for PGDE. These rates are relatively stable over time, although they have decreased slightly in recent years.
Probationers who chose the flexible route (an alternative to the one-year, full-time TIS route) are not captured in these retention rates, instead their entry to teaching is accounted for in the model as part of the pool of additions. Increasing use of the flexible route may account for the recent decrease in rates of student transitioning from ITE to the TIS.
3.8. Supply pool
Supply pool teachers are not accounted for in the staff census, which counts only the normal complement of teachers or their temporary replacements. Teachers moving from a teaching position which is counted in the census to a supply post will be accounted for in the model in the reduction rates. No additional provision for supply staff has been included. We expect that the current level of supply pool will be maintained by staff entering it from the normal complement of teachers (the on-roll population, including probationers), accounted for by the reduction rates.
3.9. Vacancy data
This data is no longer collected, and vacancies have not been accounted for in the model.
Contact
Email: Sandip.Mahajan@gov.scot