
Teacher Workforce Planning – 2025 exercise: statistical modelling of initial teacher education intake requirements
Annual teacher workforce modelling paper for informing advice made by the Teacher Workforce Advisory Planning Group on setting Initial Teacher Education course intake levels for the 2026-27 academic year.
4. Modelling output
4.1. Pupil projections
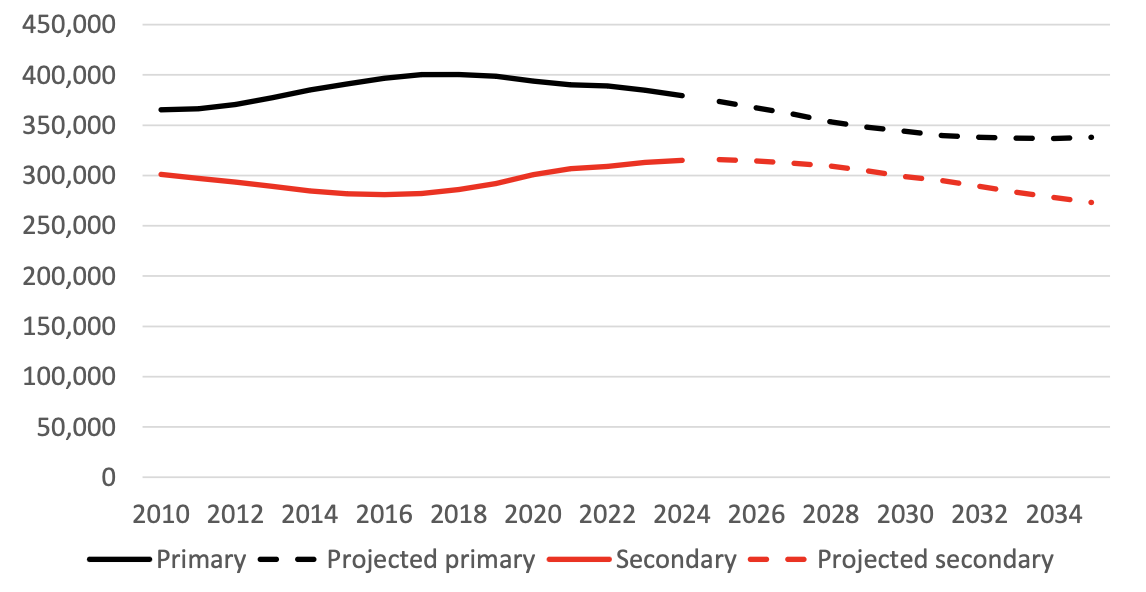
Statistics from the annual school pupil census show that the primary school roll has been falling since reaching a peak in 2017. Pupil projections, based on population projections, show the number of primary pupils continuing to decrease and levelling out by 2034.
At secondary level, the pupil roll increased in 2017 for the first time in 14 years and is projected to continue increasing until 2025, after which it will fall through to 2035.
Overall pupil numbers (pupils in primary, secondary and special schools) decreased in 2023 for the first time since 2011 and are projected to continue decreasing through to 2035.
These projections are based on the 2022 subnational population projections published by National Records of Scotland in September 2025. Despite showing an overall increase in population (driven primarily by inward migration), almost all local authority areas are projected to see a decline in the number of children.
4.2. Modelled implications of maintaining teacher numbers
Using the data and approaches set out above, the teacher workforce planning model can be used to show the implications of maintaining teacher numbers at around 53,500 FTE. This is shown in Table 3 which also includes the modelled overall PTR (across primary, secondary and special schools). The PTR in 2024 was 13.3, which compares to the lowest ever PTR of 12.9 in 2008. By 2027 the PTR is modelled to decrease to 12.9 and, if teacher numbers continue to be maintained, the PTR is modelled to decrease further, reaching 12.5 by 2029.
| Year | All Teachers |
Change in teacher numbers from previous year |
% change in teacher numbers |
Pupil teacher ratio [Note 2] |
|---|---|---|---|---|
| 2018 | 51,959 | 446 | 0.9% | 13.6 |
| 2019 | 52,247 | 288 | 0.6% | 13.6 |
| 2020 | 53,400 | 1,153 | 2.2% | 13.3 |
| 2021 | 54,285 | 885 | 1.7% | 13.2 |
| 2022 | 54,193 | -92 | -0.2% | 13.2 |
| 2023 | 54,033 | -160 | -0.3% | 13.2 |
| 2024 | 53,412 | -621 | -1.15% | 13.3 |
| 2025 | 53,462 | 50 | 0.09% | 13.2 |
| 2026 | 53,500 | 38 | 0.07% | 13.1 |
| 2027 | 53,500 | 0 | 0% | 12.9 |
| 2028 | 53,500 | 0 | 0% | 12.7 |
| 2029 | 53,500 | 0 | 0% | 12.5 |
Note 1: Existing data shaded grey to distinguish from projected data in white.
Note 2: Pupil teacher ratios exclude teachers in ELC settings.
Tables 4 and 5 show the implications of maintaining teacher numbers for each sector. The primary PTR reached its lowest ever level in 2021 at 15.1. Were primary teacher numbers to be maintained, the PTR is modelled to drop to 14.7 by 2027 and 14.2 by 2029.
In contrast, the secondary PTR was 12.6 in 2024, which is the highest secondary PTR since 2004. Were secondary teacher numbers to be maintained, the PTR is modelled to maintain at 12.6 before dropping to 12.5 in 2027. The modelling indicates it will then decrease further to 12.2 by 2029, a level last recorded in 2017.
| Year | Primary | Secondary | Special | Centrally Employed | ELC |
Total [Note 2] |
|---|---|---|---|---|---|---|
| 2018 | 24,899 | 23,317 | 1,883 | 1,039 | 821 | 51,959 |
| 2019 | 25,027 | 23,522 | 1,927 | 972 | 798 | 52,247 |
| 2020 | 25,651 | 24,077 | 1,934 | 1,009 | 728 | 53,400 |
| 2021 | 25,807 | 24,782 | 2,005 | 988 | 704 | 54,285 |
| 2022 | 25,451 | 24,874 | 2,097 | 1,037 | 734 | 54,193 |
| 2023 | 25,096 | 25,049 | 2,075 | 1,111 | 702 | 54,033 |
| 2024 | 24,468 | 24,987 | 2,138 | 1,140 | 679 | 54,030 |
| 2025 | 24,490 | 25,010 | 2,140 | 1,140 | 680 | 53,460 |
| 2026 | 24,510 | 25,030 | 2,140 | 1,140 | 680 | 53,500 |
| 2027 | 24,510 | 25,030 | 2,140 | 1,140 | 680 | 53,500 |
| 2028 | 24,510 | 25,030 | 2,140 | 1,140 | 680 | 53,500 |
| 2029 | 24,510 | 25,030 | 2,140 | 1,140 | 680 | 53,500 |
Note 1: Existing data shaded grey to distinguish from projected data in white.
Note 2: The sum of sectors may not match the total due to rounding to the nearest 10.
| Year | Primary | Secondary | Special | Total [Note 2] | |
|---|---|---|---|---|---|
| 2018 | 16.1 | 12.3 | 3.6 | 13.6 | |
| 2019 | 15.9 | 12.4 | 3.7 | 13.6 | |
| 2020 | 15.4 | 12.5 | 3.8 | 13.3 | |
| 2021 | 15.1 | 12.4 | 3.8 | 13.2 | |
| 2022 | 15.3 | 12.4 | 3.7 | 13.2 | |
| 2023 | 15.3 | 12.5 | 3.7 | 13.2 | |
| 2024 | 15.5 | 12.6 | 3.7 | 13.3 | |
| 2025 | 15.2 | 12.6 | 3.7 | 13.2 | |
| 2026 | 15.0 | 12.6 | 3.7 | 13.1 | |
| 2027 | 14.7 | 12.5 | 3.7 | 12.9 | |
| 2028 | 14.4 | 12.4 | 3.6 | 12.7 | |
| 2029 | 14.2 | 12.2 | 3.5 | 12.5 | |
Note 1: Existing data shaded grey to distinguish from projected data in white.
Note 2: Total includes centrally employed teachers but not teachers in ELC settings.
4.3. Modelled PGDE ITE intake requirements
The modelled primary and secondary PGDE ITE intake requirements to meet the objective of sustaining overall teacher numbers at 53,500 FTE are shown in Table 6. This modelling assumes that BEd intakes remain at 2024 levels (734 primary and 271 secondary).
| ITE intake year | Primary PGDE | Secondary PGDE |
|---|---|---|
| 2026/27 | 530 | 970 |
| 2027/28 | 530 | 930 |
| 2028/29 | 510 | 920 |
| 2029/30 | 500 | 910 |
For 2026/27 the modelled PGDE ITE intake requirements are 530 for primary and 970 for secondary. For 2027/28 onwards, the modelled PGDE ITE intake requirements for primary and secondary decrease a little each year through to 2029/30. This pattern is driven by the changes to the modelled age profile of the teaching workforce in the coming years.
The modelled 2026/27 ITE target for primary is lower than the target of 760 for 2026/27 that was modelled last year. The reason for the difference is that the modelling this year is for fewer primary teachers than last year.
The modelled 2026/27 ITE target for secondary is slightly higher than the target of 920 that was modelled last year. This increase in the ITE target compensates for a slight increase in the reduction rate for secondary teachers.
The overall modelled ITE intake requirements for 2026/27 across BEd and PGDE are therefore 1,260 for primary and 1,240 for secondary.
Contact
Email: Sandip.Mahajan@gov.scot