
Scottish Housing Market Review: Q3 2026
Quarterly bulletin collating a range of previously published statistics on the latest trends in the Scottish housing market.
Part of
6. Mortgage Interest Rates
After a tightening cycle which took Bank Rate from 0.1% prior to the December 2021 Monetary Policy Committee (MPC) meeting to 5.25% following the August 2023 meeting, its highest level since 2008, the MPC held Bank Rate steady for the following 12 months. The MPC then cut Bank Rate in regular increments of 0.25% points until it stood at 3.75% in December 2025.
The escalation of military conflict in the Middle East beginning in late February 2026 has contributed to increases in crude and refined energy prices and protracted volatility in the energy markets. The MPC has warned that CPI inflation is likely to rise further in coming quarters. To ensure inflation returns sustainably to the 2% target, the MPC has kept Bank Rate unchanged at 3.75% at its last six meetings in 2026, and at the most recent MPC meeting in September, three of the nine members voted to increase Bank Rate. The next meeting is scheduled for 5 November 2026.
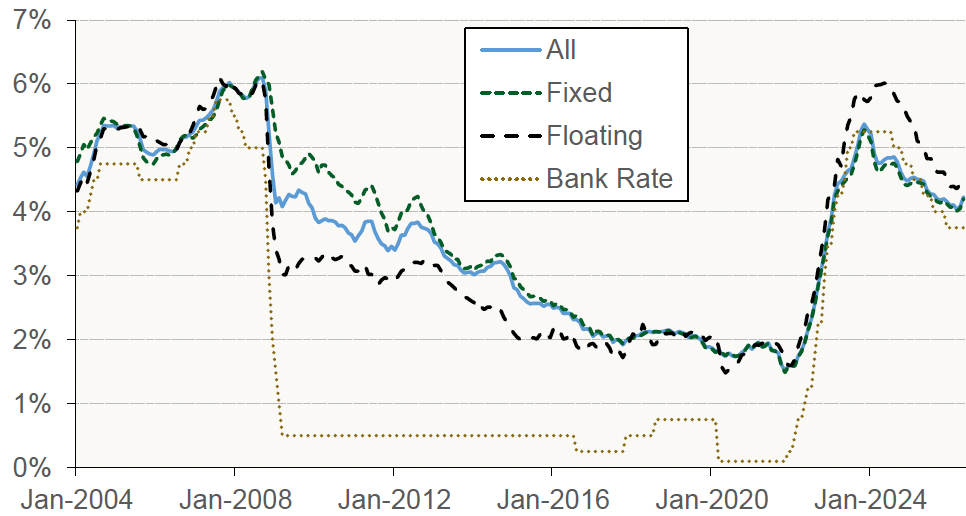
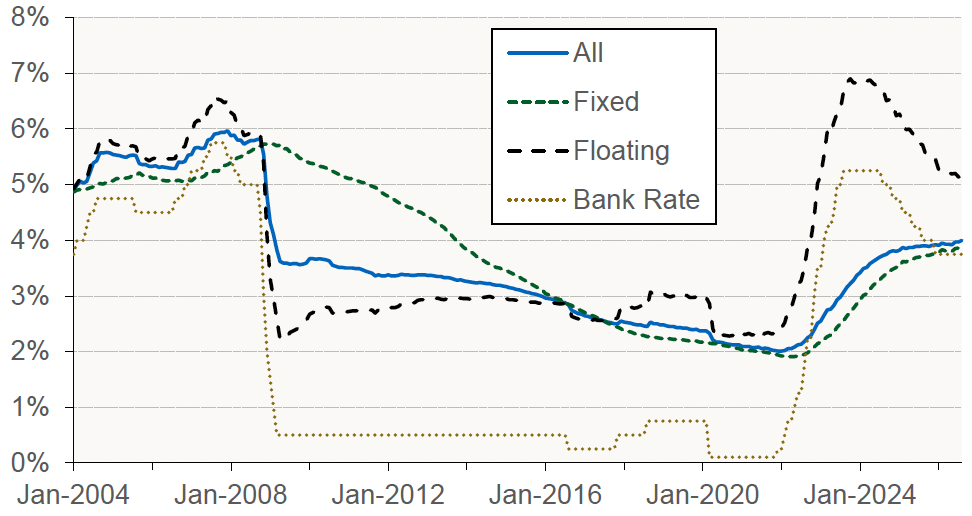
Chart 6.1 and Chart 6.2 shows the effective (or average) interest rates on new mortgage advances and outstanding mortgage balances in the UK. [Source: Bank of England]. There is a lag between a borrower securing a mortgage offer and the mortgage transaction completing, meaning changes in mortgage pricing can take several months to feed through to housing activity and household borrowing costs.
Reflecting successive reductions in Bank Rate beginning in August 2024, the average interest rate on new floating‑rate mortgage advances fell by 1.5 percentage points to 4.36% over the period from August 2024 to March 2026. Since then, it has remained broadly unchanged and stood at 4.39% in August 2026. For new fixed‑rate mortgages, the average rate declined by 0.8 percentage points to 4.01% over the period from August 2024 to March 2026. More recently, however, it has increased, rising by 0.65 percentage points to 4.66% in August 2026.
Between August 2024 and August 2026, the average interest rate on outstanding floating-rate mortgages has fallen by 1.6 percentage points to 5.13%. For outstanding fixed-rate mortgages, there was an upward trend in the average rate from early 2022, which began to level off at the start of 2025. However, in line with the increase in average rate on new fixed-rate mortgages, there has also been an uptick recently in the average rate on outstanding fixed-rate mortgages, from 3.78% in January 2026 to 3.88% in August 2026.
Effective monthly interest rates on mortgage lending to households: UK (Data as at month-end, to August 2026)
Source: Bank of England
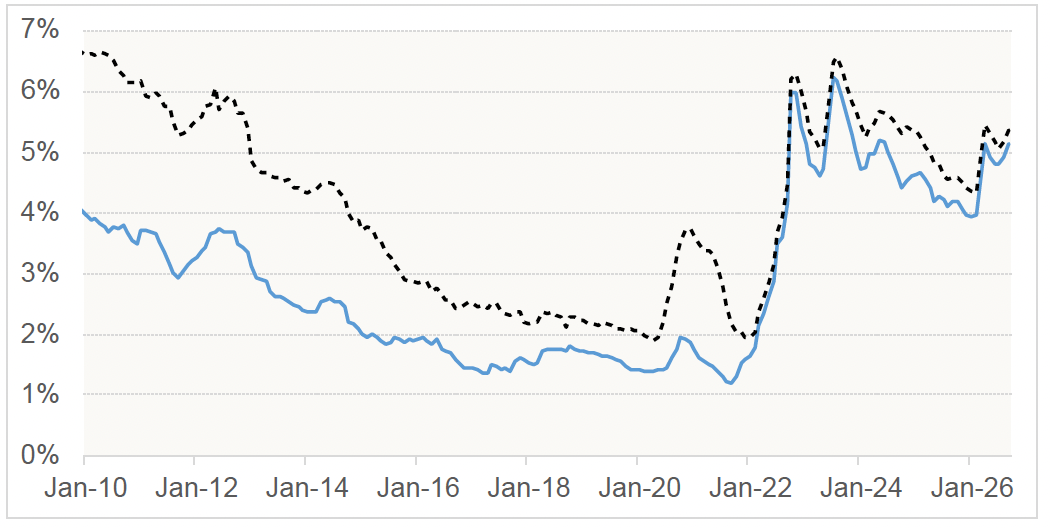
Bank of England data on advertised mortgage rates (as opposed to data in Chart 6.1 which is based on interest actually paid) shows that advertised mortgage rates in the UK rose sharply after the recent military conflict in the Middle East began on 28 February 2026. The average advertised two-year fixed rate for a 75% LTV mortgage increased from 3.93% in January 2026 to 5.14% in April, while over the same period the average two-year fixed rate for a 90% LTV mortgage increased from 4.36% to 5.46%. While rates on both 75% and 90% LTV mortgages eased in the following months, by end-September both were again close to their levels in April (5.13% and 5.37% respectively).
Source: Bank of England
Data from the Moneyfacts Treasury Report, which presents advertised mortgage rates averaged across loan-to-value (LTV) bands in the UK, shows that the average two-year fixed mortgage rate increased sharply from 4.84% in March 2026 to 5.84% in April, and the five-year rate similarly increased from 4.96% to 5.75% over this period. Since then, rates have fluctuated, but in September were somewhat off their April highs (the two-year rate at 5.59% and the five-year rate at 5.63%)
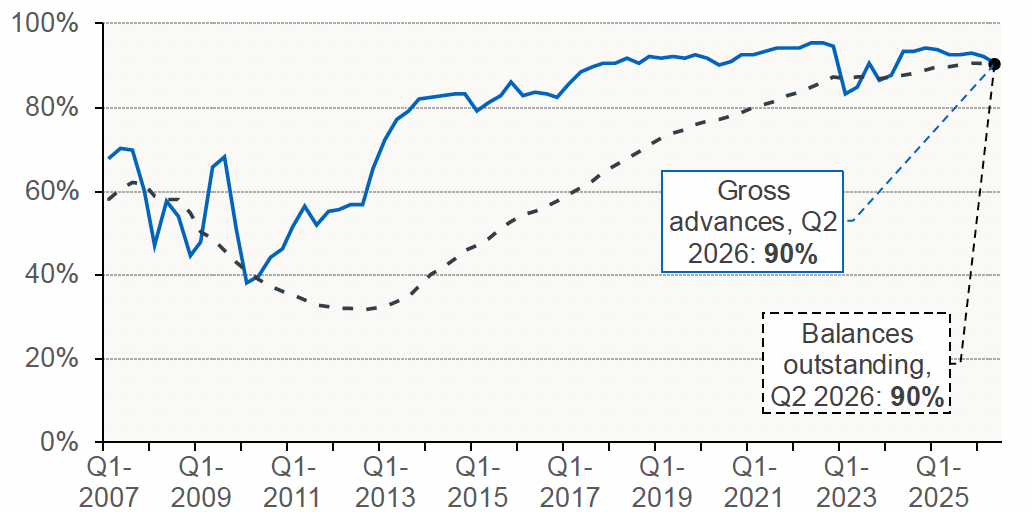
Chart 6.4 shows that the vast majority of regulated[5] mortgages are on fixed rates. The share of gross advances on fixed rates in Q2 2026 was 90%, as was the share of outstanding balances on fixed rates. (Source: FCA).
Source: FCA
Contact
Email: Orhan.McDonald@gov.scot