
Scottish Housing Market Review: Q3 2026
Quarterly bulletin collating a range of previously published statistics on the latest trends in the Scottish housing market.
Part of
11. Lending to House Builders, Insolvencies and Construction Prices
11.1. Lending to House Builders
In 2025, the average value of loans outstanding for firms involved in the construction of domestic buildings in the UK was down by 0.7% from 2024. However, in 2026 so far there has been relatively strong growth: the average value of loans outstanding in the period January to August was 7.7% higher than the same months in 2025.
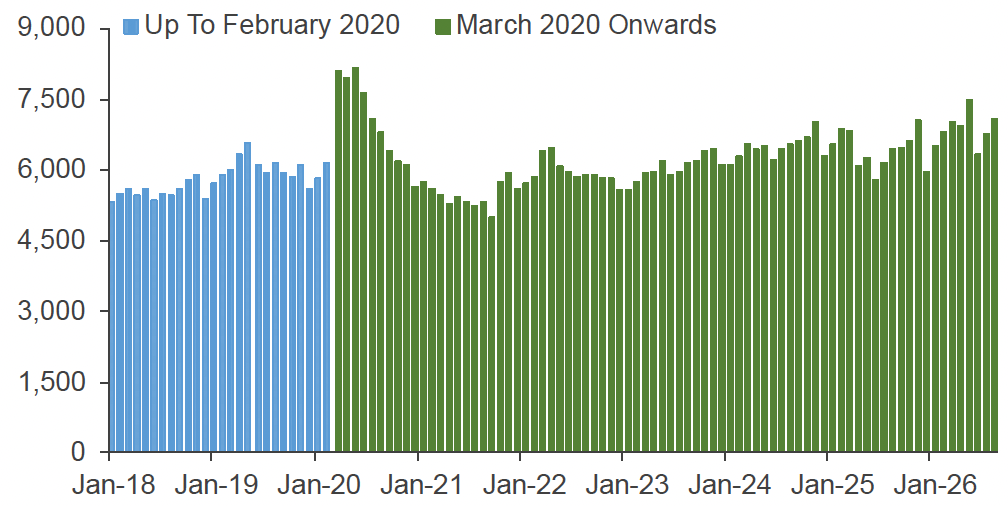
Source: Bank of England. The sharp increase in March 2020 was linked to Covid.[7]
11.2. Insolvencies
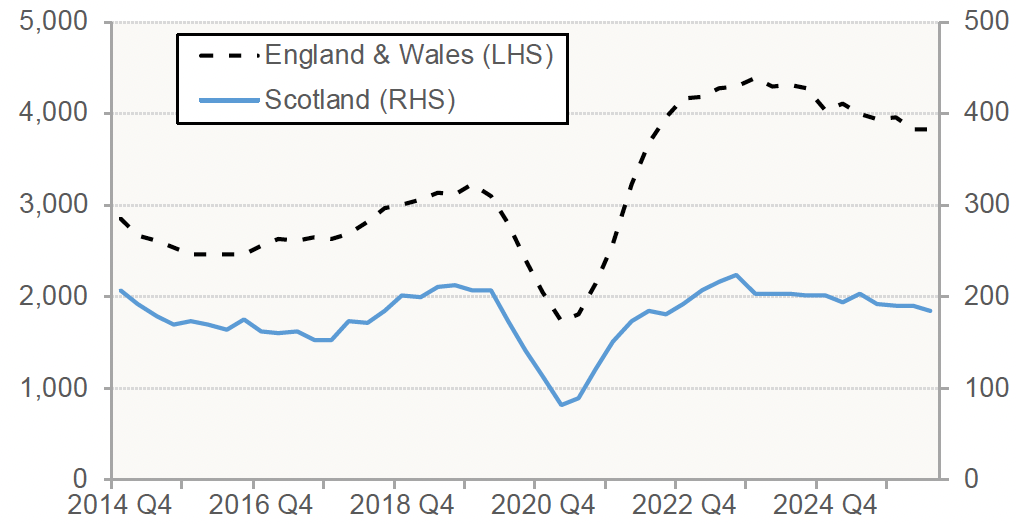
During the 4 quarters ending Q2 2026, 185 construction companies registered in Scotland entered insolvency, a decrease of 9.3% compared with the 4 quarters ending Q2 2025. There was a somewhat smaller fall for construction companies registered in England and Wales, where insolvencies in the 4 quarters ending Q2 2026 were 4.0% lower than the previous 4 quarters. As illustrated by Chart 11.2, a sharp fall in insolvencies in the earlier stages of the Covid pandemic was followed by a sharp rise in both Scotland and in England and Wales. However, the level of construction insolvencies in Scotland is now somewhat below its pre-Covid levels, while in England and Wales it remains significantly above its pre-Covid levels.
Source: The Insolvency Service
11.3. Input and Output Prices for New Housing
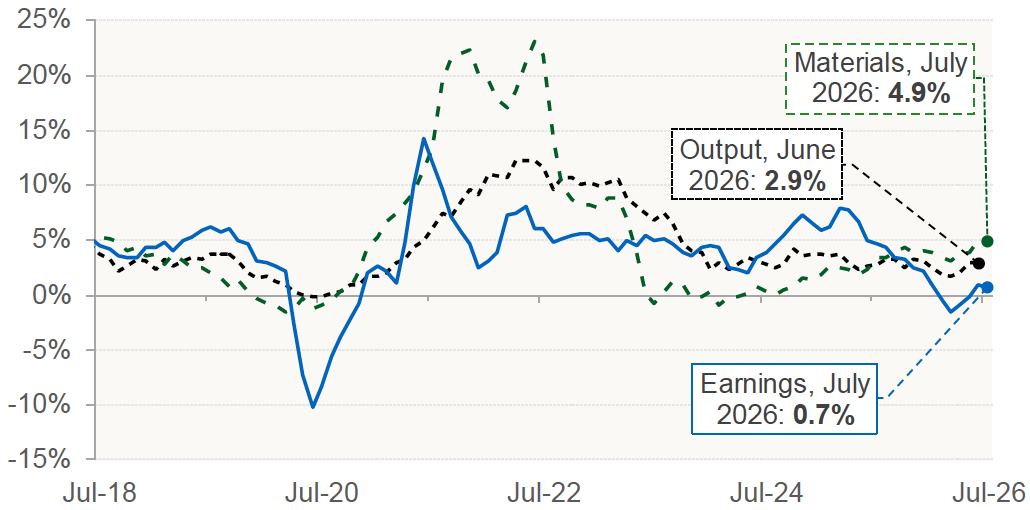
ONS data shows that the annual growth rate in the construction-output price index for Great Britain (GB) was 2.9% in June 2026, unchanged from May 2026. This is significantly below the post-Covid peak of 12.3% reached during 2022, as well being less than the long-run average of 3.7% recorded since January 2014.
Seasonally adjusted weekly earnings data, expressed as an average for the 3-month period ending in the relevant month, shows annual growth in total pay in the construction sector in GB decreased by 0.1% in May 2026. However, this was followed by modest positive growth in June 2026 (1.0%) and July 2026 (0.7%).
The conflict in the Middle East and the resulting disruption to supply chains have contributed to an uptick in construction material price inflation in the UK, as shown in Chart 11.3. Annual growth in new housing construction material prices accelerated from 4.9% in July 2026 to 5.6% in August 2026. Both figures were above the long-run average of 4.1% recorded between January 2014 and August 2026.
Source: ONS
Contact
Email: Orhan.McDonald@gov.scot