Scottish Housing Market Review: Q1 2022
Summary of the latest Scottish housing market data.
Part of
Residential LBTT; Homelessness
Residential LBTT
Residential LBTT revenues excluding ADS rose sharply from £20.8m in February 2021 to £38.2m in March 2021, before falling to £18.3m in April, as transactions were brought forward due to the temporary increase of the zero rate threshold for all buyers to £250K (from £175K for first-time buyers, and £145K for other buyers), which took effect on 15 July 2020 and ended on 31 March 2021. Residential LBTT revenue has picked up since April 2021, with revenue for the 11 months of the financial year 62.2% higher for 2021-22 relative to a 4 year average (2016-17 to 2019-20), which can be explained by a combination of higher transaction volumes (see Chart 1.2) and house prices (see Chart 2.1) in 2021-22.
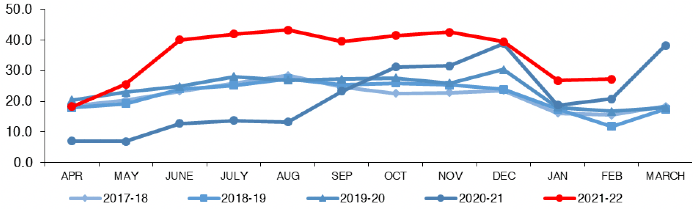
Source: Revenue Scotland
Homelessness
Over the one year period to 31 March 2021, there were 34,124 homelessness applications in Scotland and 27,915 households assessed as homeless (including those threatened with homelessness). In addition, 13,097 households were in temporary accommodation as at 31 March 2021, as illustrated in Chart 5.2. More recent data outlining the first half of the 2021-22 financial year saw 17,447 homelessness applications (an annual increase of 1.6%) and 14,161 households assessed as homeless (an annual increase of 2.5%), while the number of households in temporary accommodation was 13,192 at 30 September 2021, a decrease of 6.8% compared to September 2020.
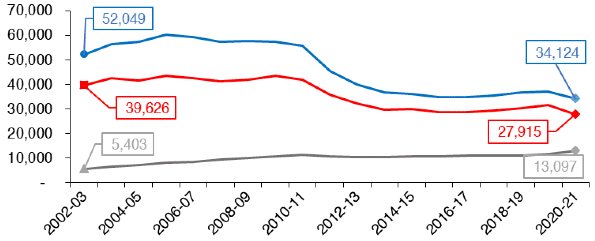
Source: Scottish Government
Chart 5.3 plots how homelessness applications and households in temporary accommodation have progressed since the start of the Covid-19 pandemic on a quarterly basis. This chart uses Scottish Government statistics to Q3 2021 (solid line) and Scottish Housing Regulator statistics for Q4 2021 (dashed line) due to data availability, although note that the SHR data is not directly comparable to the official homelessness statistics. The quarterly data shows that since the start of the pandemic, homelessness applications have remained below pre-pandemic levels. The 7,969 applications in Q4 2021 is 8.0% less than the same period in 2019. The number of households in temporary accommodation on the other hand increased during the pandemic from 11,345 in Q4 2019 to a peak of 14,151 (+24.7%) in Q3 2020 but has since fallen to 13,079 in Q4 2021.
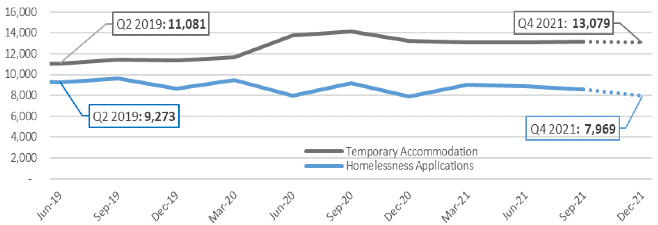
Source: Scottish Government and SHR
Contact
Email: William.Ellison@gov.scot