Scottish Housing Market Review: Q1 2022
Summary of the latest Scottish housing market data.
Part of
Rental Prices
Private Housing Rental Prices
Private housing rental prices in Scotland increased by 2.6% annually to February 2022. Nominal private rental price growth has been relatively stable since June 2017, ranging between 0% and 2%, with an average of 1.0%. However, in recent months nominal rental prices have increased, with the 2.6% annual growth in February the highest recorded since January 2012. In real terms (adjusting for inflation, using CPI), the annual change in February 2022 was -3.3%. Chart 3.1 shows that the annual change in real private housing rental prices rose towards positive territory as CPI inflation fell due to the impact of Covid-19, but it has returned to negative territory with the recent increase in CPI inflation, which reached 6.2% in February 2022. The heightened level of CPI inflation can be partly explained by the large increase in energy prices (electricity, gas and other fuels).
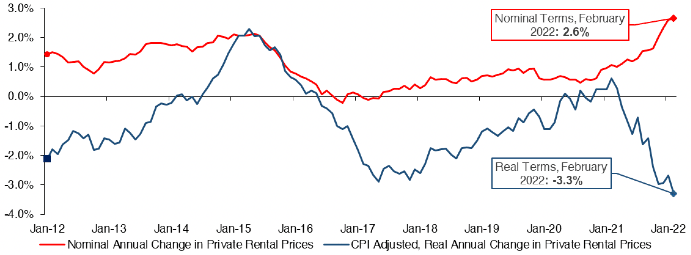
Source: ONS Rental Price Index, Consumer Price Inflation (CPI)
Scottish Government statistics show that from 2010 to 2021 (years to end September), four broad market rental areas ("BRMAs") have seen average rents for 2 bedroom properties increase, on an average annualised basis, above the average level of CPI inflation (2.0%): these are the Lothian (3.2%), Greater Glasgow (3.2%), Fife (2.6%) and the Forth Valley (2.4%) BRMAs. Therefore, the annualised average rate of change was equal to or below that of inflation (CPI) in 14/18 BRMAs, with the lowest annualised rate of change seen in Aberdeen and Shire of just 0.1%.
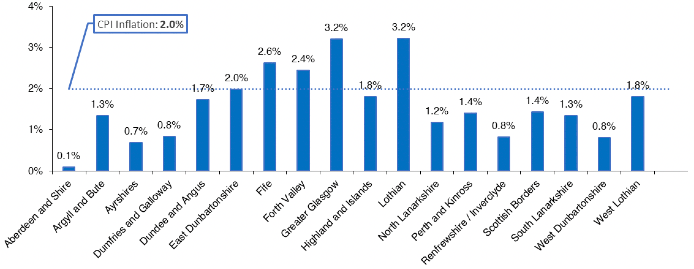
Source: SG/ONS CPI
* Note: Scottish Government statistics are based almost entirely on advertised rents at point of new let, and thus will tend to be higher than the ONS data which makes an allowance for rent changes in existing lets. In addition, chart 3.2 looks solely at 2 bedroom properties, whilst 3.1 looks at the entire market
Contact
Email: William.Ellison@gov.scot