Scottish Housing Market Review: Q1 2022
Summary of the latest Scottish housing market data.
Part of
House Prices
National
Source: Registers of Scotland / UK HPI
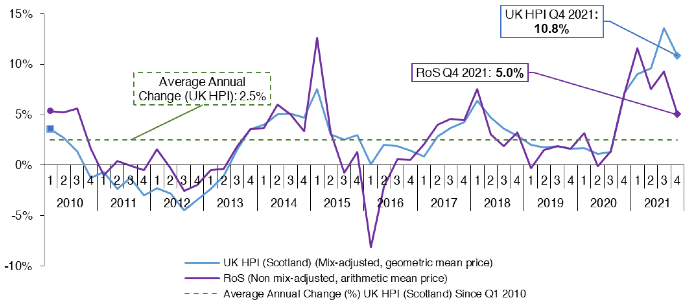
Scottish House Price Performance: National
House price inflation in Scotland, as measured by the UK HPI, increased in Q4 2021 by 10.8% relative to Q4 2020. Apart from annual house price growth to Q3 2021 of 13.5%, this is the highest quarter of house price inflation since Q1 2008, prior to the financial crisis. The average property price in Scotland stood at £181k in Q4 2021. While annual house price inflation remains elevated, more recent monthly data suggests the rate of increase is continuing to ease, falling from the 16.4% recorded in August 2021 to 10.8% in January 2022.
Data from Registers of Scotland shows a slightly lower increase in annual house price inflation in Q4 2021, of 5.0%. However, this data is not mix-adjusted, so could be affected by the composition of properties sold. This is supported by looking at the number of transactions in greater detail, with transactions for flats making up a greater proportion of total transactions in Q4 2021.
UK HPI data shows that annual price growth to Q4 2021 was highest for detached properties (15.3%). Flats increased by the lowest amount, increasing by an annual 7.0%.
Scottish House Price Performance by Dwelling/Buyer Type
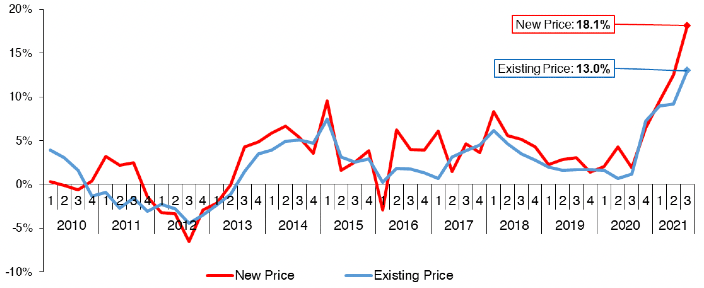
Chart 2.2 shows the rate of change in the average new and existing build property price in Scotland. This data is published with a lag relative to the headline HPI. In Q3 2021, the average Scottish new build property price increased to a greater extent than the existing build price, rising by 18.1% to £257K. The average existing build price rose by 13.0% to £174K.
The average price of new build properties is rising rapidly, with more recent monthly data to November 2021 showing an annual increase of 28.6%. This large increase is likely to be linked to the rise in the price of new build construction material (see Chart 7.3).
Source: UK HPI (Scotland)
The UK HPI also shows that the average price of a property bought by former owner occupier in Scotland increased by an annual 11.7% in Q4 2021, to £219K. Meanwhile, the average price of a property purchased by a first-time buyer increased by an annual 9.9% in Q4 2021, to £145K.
Scottish House Price Performance: Regional
Registers of Scotland data show that house prices rose across Scotland in Q4 2021. The largest increase was in Argyll and Bute, Highlands and Islands, where house prices increased 8.7% annually to 209K (average arithmetic mean price; prices not mix-adjusted). The smallest increase was in Aberdeen/shire and Moray, which increased by 1.9% annually to £208K. Over the five year period to Q4 2021, the annualised house price inflation rate in Aberdeen/shire & Moray was 1.0%, relative to 4.3% across Scotland. This can in part be explained by lower oil prices, which have led to a decline in the oil industry, a crucial component of the Aberdeen economy, and therefore, the regional housing market. However, with the sharp rise in oil prices since December 2021 and the potential to increase extraction from the North Sea, this could lead to the regional house market rebounding somewhat.
The longer-term trend (as measured by the change in house prices over the 4 quarter period to Q4 2021 over the previous four-quarter period) shows that house price growth has been positive in all areas of Scotland. The strongest price growth was again seen in Argyll and Bute, Highlands and Islands, where house prices increased by 7.6%, whilst the smallest increase in house prices was seen in the Forth Valley, where house prices increased by 4.7%.
A summary of the average house price in Q4 2021 by Scottish region is included below. This also includes the annual change in the average house price in Q4 2021, as well as the annual change in the average house price using a rolling four quarter period to Q4 2021, which smooths out volatility in quarterly data (Source: RoS).
Table 2. Regional house prices
Aberdeen/shire & Moray
- Average Price – Q4 2021 £208K
- 12 Month Change 1.9%
- Annual change (rolling 4 quarters) 4.8%
Argyll & Bute, Highland & Islands
- Average Price – Q4 2021 £209K
- 12 Month Change 8.7%
- Annual change (rolling 4 quarters) 7.6%
Ayrshires, Dumfries & Galloway
- Average Price – Q4 2021 £165K
- 12 Month Change 2.6%
- Annual change (rolling 4 quarters) 6.5%
Clyde Valley
- Average Price – Q4 2021 £185K
- 12 Month Change 4.9%
- Annual change (rolling 4 quarters) 6.5%
Edinburgh, Lothians & Borders
- Average Price – Q4 2021 275K
- 12 Month Change 5.0%
- Annual change (rolling 4 quarters) 6.1%
Forth Valley
- Average Price – Q4 2021 £195K
- 12 Month Change 2.4%
- Annual change (rolling 4 quarters) 4.7%
Tayside & Fife
- Average Price – Q4 2021 £194K
- 12 Month Change 4.7%
- Annual change (rolling 4 quarters) 6.4%
Scotland
- Average Price – Q4 2021 £207K
- 12 Month Change 5.0%
- Annual change (rolling 4 quarters) 6.6%
Source: Registers of Scotland
Contact
Email: William.Ellison@gov.scot