Scottish Housing Market Review: Q1 2022
Summary of the latest Scottish housing market data.
Part of
Lending To Homebuyers: Interest Rates
Mortgage Interest Rates
Charts 4.5 & 4.6 show the effective (or average) interest rate on outstanding mortgage balances and new mortgage advances. (Source: BoE).
In March 2020, Bank Rate was cut by a total of 65 basis points to 0.1% as a result of the Covid-19 pandemic. This fed through quickly into variable rate mortgages, with the average variable rate on outstanding mortgages falling from 2.97% in February 2020 to 2.26% in May 2020, after which it remained relatively steady, and the average interest rate on new variable rate mortgages falling from 2.06% in February 2020 to 1.48% in May 2020, although it then increased back to 1.96% in July 2021, before falling again to 1.60% in December 2021. The average fixed rate on outstanding mortgages has gradually drifted down during this period, while the average fixed rate on new mortgages, despite displaying more volatility, also fell to 1.58% by December 2021.
More recently in response to the rise in inflation, the Bank of England has increased the Bank rate by 15 basis points in December, followed by 25 basis points in each of February and March, for a cumulative rise of 65 basis points to 0.75%, returning Bank Rate to its pre-Covid level. Since the latest data on average mortgage rates is for January 2022, the data only reflects the December Bank Rate change, and in fact only the average variable rate on outstanding mortgages increased in January, by 10 basis points to 2.42%.
Charts 4.5 and 4.6: Effective Monthly Mortgage Interest Rate (UK) (%)
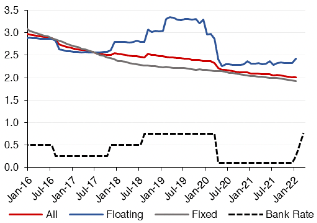
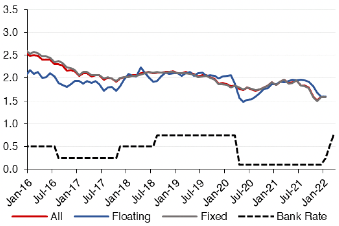
Source: Bank of England
The 65 basis point increase to Bank Rate is estimated to increase the average monthly payment by £54 on a new variable rate mortgage and by £29 on an outstanding variable mortgage in Scotland.
The spread between the average advertised rate on 2 year fixed 90% and 75% LTV mortgages increased during the pandemic from 51 basis points in April 2020 to 189 basis points in December 2020, as shown in Chart 4.7. However, since April 2021, the spread has been falling, reaching 27 basis points in January 2022, the lowest level since June 2009. (Source: BoE)
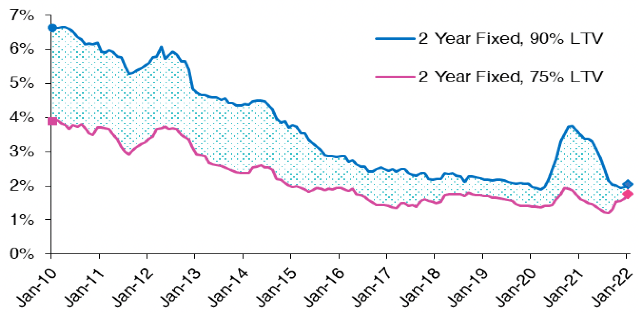
Source: Bank of England
Chart 4.8 shows that the majority of new mortgages (93.7%), as well as most outstanding mortgages (70.2%), are on fixed rates, as of Q4 2021. (Source: FCA)
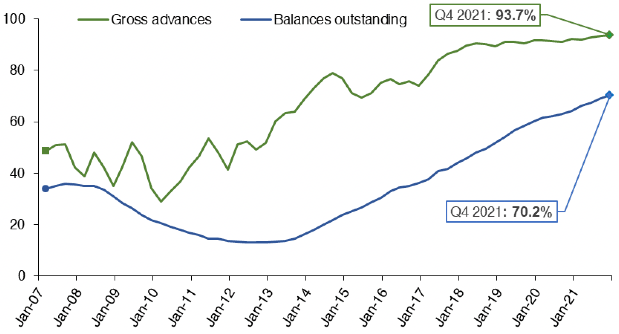
Source: FCA
Contact
Email: William.Ellison@gov.scot