Scottish Housing Market Review: Q1 2022
Summary of the latest Scottish housing market data.
Part of
Sales
National
Source: Registers of Scotland
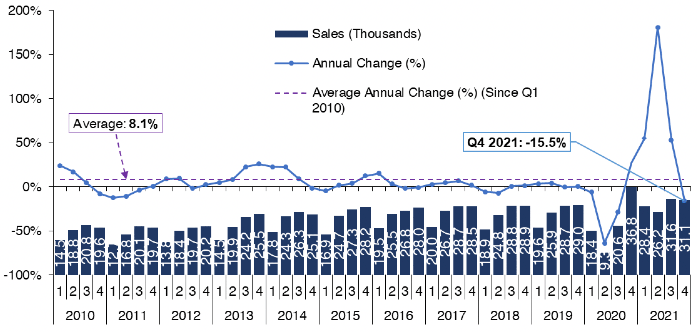
Scottish Sales Performance: National
Following the surge in transactions after home move restrictions were lifted in late June 2020, which was fuelled by pent-up demand as well as the temporary reduction in LBTT (which ended on 31 March 2021), data for Q4 2021 suggests housing market activity is stabilising, with Registers of Scotland statistics showing that there were 31,131 residential property sales registered across Scotland. Whilst this was an annual decrease of 15.5%, this can be explained by the elevated level of transactions in Q4 2020, when housing market activity rebounded quickly from the lockdown in Q2 2020. Relative to Q4 2019, transactions in Q4 2021 were up by 7.3%, while comparing to the 4 year average for Q4 (2016 – 2019), transactions were up by 8.8%.
More timely statistics from Revenue Scotland on the number of residential LBTT returns submitted also confirms that although housing market activity remains elevated, it is gradually returning to more normal levels. Chart 1.2 plots the percentage difference between monthly residential LBTT returns in 2020, 2021 and 2022 relative to 2019 for the corresponding month, with 2019 reflecting pre-Covid market conditions. Following a surge and then dip in transactions around March 2021 when the temporary reduction in LBTT ended, since May 2021 monthly transactions have generally been somewhat higher than the same month in 2019. Across January and February 2022, while LBTT returns were down by an annual 7.9% due to the high level of transactions recorded in early 2021, they were 7.9% higher than in the same period in 2019.
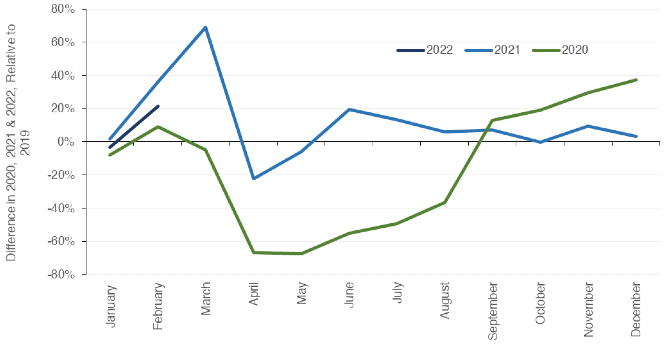
Source: Revenue Scotland
Scottish Sales Performance: Regional
Registers of Scotland data shows that the reduction in housing market activity in Q4 2021 relative to Q4 2020 (which was elevated by the strong recovery after the lockdown in Q2 2020, as discussed above) was experienced across the different regions of Scotland. The largest decrease in residential property sales occurred in the Ayrshires, Dumfries and Galloway, where sales fell by an annual 20.3%. Sales in the Aberdeen/shire and Moray decreased by the lowest amount in Scotland, down by 1.2% on the same period last year.
Analysing the annual change using a rolling four quarters method, it can be seen that the increase in transactions for the one year period to Q4 2021 relative to the year prior has also been experienced in a broadly uniform manner across Scotland. The largest increase in sales on a rolling four quarter basis was in Aberdeen/shire and Moray by 51.9% and the lowest increase in sales was in the Forth Valley by 29.0%.
A summary of residential property sales activity by Scottish region is included below. This contains the number of residential property sales registered in Q4 2021, the annual change, as well as the annual change in sales using a rolling four quarter period to Q4 2021. The latter is included to smooth out volatility in quarterly data.
Table 1. Regional residential transactions
Aberdeen/shire & Moray
- Sales – Q4 2021 3,484
- 12 Month Change -1.2%
- Annual change (rolling 4 quarters) 51.9%
Argyll & Bute, Highland & Islands
- Sales – Q4 2021 2,212
- 12 Month Change -16.1%
- Annual change (rolling 4 quarters) 38.1%
Ayrshires, Dumfries & Galloway
- Sales – Q4 2021 2,838
- 12 Month Change -20.3%
- Annual change (rolling 4 quarters) 34.3%
Clyde Valley
- Sales – Q4 2021 10,251
- 12 Month Change -18.0%
- Annual change (rolling 4 quarters) 34.6%
Edinburgh, Lothians & Borders
- Sales – Q4 2021 6,249
- 12 Month Change -13.1%
- Annual change (rolling 4 quarters) 41.4%
Forth Valley
- Sales – Q4 2021 1,633
- 12 Month Change -17.6%
- Annual change (rolling 4 quarters) 29.0%
Tayside & Fife
- Sales – Q4 2021 4,464
- 12 Month Change -17.7%
- Annual change (rolling 4 quarters) 37.1%
Scotland
- Sales – Q4 2021 31,131
- 12 Month Change -15.5%
- Annual change (rolling 4 quarters) 37.9%
Source: Registers of Scotland
Contact
Email: William.Ellison@gov.scot