Scottish Health Survey 2013 - volume 1: main report
Presents results for the 2013 Scottish Health Survey, providing information on the health and factors relating to health of people living in Scotland.
Appendix A: Glossary
This glossary explains terms used in the report, other than those fully described in particular chapters.
Age Standardisation
Age standardisation has been used in order to enable groups to be compared after adjusting for the effects of any differences in their age distributions.
When different sub-groups are compared in respect of a variable on which age has an important influence, any differences in age distributions between these sub-groups are likely to affect the observed differences in the proportions of interest.
Age standardisation was carried out, using the direct standardisation method. The standard population to which the age distribution of sub-groups was adjusted was the mid-2012 population estimates for Scotland. All age standardisation has been undertaken separately within each sex.
The age-standardised proportion was calculated as follows, where is the age specific proportion in age group i and is the standard population size in age group i:
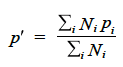
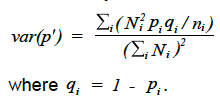
Therefore can be viewed as a weighted mean of using the weights. Age standardisation was carried out using the age groups: 16-24, 25-34, 35-44, 45-54, 55-64, 65-74 and 75 and over. The variance of the standardised proportion can be estimated by:
Anthropometric measurement
See Body mass index (BMI), Waist circumference
Arithmetic mean
See Mean
AUDIT
The Alcohol Use Disorders Identification Test (AUDIT) is a tool developed by the World Health Organisation used to measure harmful alcohol consumption or dependence. In 2012 it was used on SHeS, replacing the CAGE questionnaire, which was also used to identify prevalence of problem drinking. AUDIT consists of 10 questions - questions 1-3 are indicators of consumption, questions 4-6 are indicators of alcohol dependency and questions 7-10 are indicators of harmful consumption. A score of 8 or more are taken to be indicative of an alcohol use disorder. Scores 8 to 15 suggest "hazardous" drinking behaviour and scores of 16 to 19 indicate "harmful" behaviour, although neither of these groups tend to be considered in isolation. Due to the (potentially) sensitive nature of the questions, this questionnaire was administered in self-completion format. All participants who drank alcohol more than very occasionally were asked to complete the questions.
Blood pressure
Systolic (SBP) and diastolic (DBP) blood pressure were measured using a standard method (see Volume 2, Appendix B for measurement protocol). In adults, high blood pressure is defined as SBP 140 mmHg or DBP 90 mmHg or on antihypertensive drugs.
Body mass index
Weight in kg divided by the square of height in metres. Adults (aged 16 and over) can be classified into the following BMI groups:
| BMI (kg/m2) | Description |
| Less than 18.5 | Underweight |
| 18.5 to less than 25 | Normal |
| 25 to less than 30 | Overweight |
| 30 to less than 40 | Obese |
| 40 and above | Morbidly obese |
Although the BMI calculation method is the same, there are no fixed BMI cut-off points defining overweight and obesity in children. Instead, overweight and obesity are defined using several other methods including age and sex specific BMI cut-off points or BMI percentiles cut-offs based on reference populations. Children can be classified into the following groups:
| Percentile cut-off |
Description |
| At or below 2nd percentile |
At risk of underweight |
| Above 2nd percentile and below 85th percentile |
Healthy weight |
| At or above 85th percentile and below 95th percentile |
At risk of overweight |
| At or above 95th percentile and below 98th percentile |
At risk of obesity |
CAGE
The CAGE questionnaire was included in SHeS between 1995 and 2011 and was replaced by the AUDIT questionnaire in 2012. It was asked of participants aged 16 and over who drank alcohol more than occasionally. Three questions relate to physical dependency on alcohol and the other three relate to feeling that they ought to cut down on drinking, feeling guilty about drinking and annoyance of other people's impression of their own drinking. Agreement with two (or more) of the six CAGE items is indicative of problem drinking. This questionnaire was administered in self-completion format due to the sensitive nature of the questions.
Cardiovascular Disease
Participants were classified as having cardiovascular disease (CVD) if they reported ever having any of the following conditions diagnosed by a doctor: angina, heart attack, stroke, heart murmur, irregular heart rhythm, 'other heart trouble'. For the purpose of this report, participants were classified as having a particular condition only if they reported that the diagnosis was confirmed by a doctor. No attempt was made to assess these self-reported diagnoses objectively. There is therefore the possibility that some misclassification may have occurred, because some participants may not have remembered (or not remembered correctly) the diagnosis made by their doctor.
Chronic Obstructive Pulmonary Disease(COPD)
COPD is defined by the World Health Organisation (WHO) as 'a pulmonary disease characterised by chronic obstruction lung airflow that interferes with normal breathing and is not fully reversible.' It is associated with symptoms and clinical signs that in the past have been called 'chronic bronchitis' and 'emphysema,' including regular cough (at least three consecutive months of the year) and production of phlegm.
Cotinine
Cotinine is a metabolite of nicotine. It is one of several biological markers that are indicators of smoking. In this survey, it was measured in saliva. It has a half-life in the body of between 16 and 20 hours, which means that it will detect regular smoking (or other tobacco use such as chewing) but may not detect occasional use if the last occasion was several days ago. Anyone with a salivary cotinine level of 12 nanograms per millilitre or more was judged highly likely to be a tobacco user. Saliva samples were collected as part of the biological module.
Creatinine
This is excreted in urine and unlike sodium and potassium is relatively stable over time. Therefore in the analysis of urinary salt, the ratio of sodium to creatinine and of potassium to creatinine are analysed as proxy measures for dietary sodium and potassium. See also Urine, Sodium, Potassium.
Diastolic blood
When measuring blood pressure the diastolic arterial pressure is the lowest pressure at the resting phase of the cardiac cycle. See also Blood pressure, Systolic blood pressure.
Equivalised Household income
Making precise estimates of household income, as is done for example in the Family Resources Survey, requires far more interview time than was available in the Health Survey. Household income was thus established by means of a card (see Volume 2, Appendix A) on which banded incomes were presented. Information was obtained from the household reference person (HRP) or their partner. Initially they were asked to state their own (HRP and partner) aggregate gross income, and were then asked to estimate the total household income including that of any other persons in the household. Household income can be used as an analysis variable, but there has been increasing interest recently in using measures of equivalised income that adjust income to take account of the number of persons in the household. Methods of doing this vary in detail: the starting point is usually an exact estimate of net income, rather than the banded estimate of gross income obtained in the Health Survey. The method used in the present report was as follows. It utilises the widely used McClements scoring system, described below.
1. A score was allocated to each household member, and these were added together to produce an overall household McClements score. Household members were given scores as follows.
First adult (HRP) 0.61
Spouse/partner of HRP 0.39
Other second adult 0.46
Third adult 0.42
Subsequent adults 0.36
Dependant aged 0-1 0.09
Dependant aged 2-4 0.18
Dependant aged 5-7 0.21
Dependant aged 8-10 0.23
Dependant aged 11-12 0.25
Dependant aged 13-15 0.27
Dependant aged 16+ 0.36
2. The equivalised income was derived as the annual household income divided by the McClements score.
3. This equivalised annual household income was attributed to all members of the household, including children.
4. Households were ranked by equivalised income, and quintiles q1- q5 were identified. Because income was obtained in banded form, there were clumps of households with the same income spanning the quintiles. It was decided not to split clumps but to define the quintiles as 'households with equivalised income up to q1', 'over q1 up to q2' etc.
5. All individuals in each household were allocated to the equivalised household income quintile to which their household had been allocated. Insofar as the mean number of persons per household may vary between tertiles, the numbers in the quintiles will be unequal. Inequalities in numbers are also introduced by the clumping referred to above, and by the fact that in any sub-group analysed the proportionate distribution across quintiles will differ from that of the total sample.
Reference: McClements, D. (1977). Equivalence scales for children. Journal of Public Economics. 8: 191-210.
Frankfort plane
The Frankfort Plane is an imaginary line passing through the external ear canal and across the top of the lower bone of the eye socket, immediately under the eye. Informants' heads are positioned with the Frankfort Plane in a horizontal position when height is measured using a stadiometer as a means of ensuring that, as far as possible, the measurements taken are standardised.
Geometric mean
The geometric mean is a measure of central tendency. It is sometimes preferable to the arithmetic mean, since it takes account of positive skewness in a distribution. An arithmetic mean is calculated by summing the values for all cases and dividing by the number of cases in the set. The geometric mean is instead calculated by multiplying the values for all cases and taking the nth root, where n is the number of cases in the set. For example, a dataset with two cases would use the square root, for three cases the cube root would be used, and so on. The geometric mean of 2 and 10 is 4.5 (2x10=20, 20=4.5). Geometric means can only be calculated for positive numbers so zero values need to be handled before geometric means are calculated. See also mean.
GHQ12
The General Health Questionnaire (GHQ12) is a scale designed to detect possible psychiatric morbidity in the general population. It was administered to informants aged 13 and above. The questionnaire contains 12 questions about the informant's general level of happiness, depression, anxiety and sleep disturbance over the past four weeks. Responses to these items are scored, with one point given each time a particular feeling or type of behaviour was reported to have been experienced 'more than usual' or 'much more than usual' over the past few weeks. These scores are combined to create an overall score of between zero and twelve. A score of four or more (referred to as a 'high' GHQ12 score) has been used in this report to indicate the presence of a possible psychiatric disorder.
Reference: Goldberg D, Williams PA. User's Guide to the General Health Questionnaire. NFER-NELSON, 1988.
High blood pressure
See Blood pressure
Household
A household was defined as one person or a group of people who have the accommodation as their only or main residence and who either share at least one meal a day or share the living accommodation.
Household Reference Person
The household reference person (HRP) is defined as the householder (a person in whose name the property is owned or rented) with the highest income. If there is more than one householder and they have equal income, then the household reference person is the oldest.
Income
See Equivalised household income
Ischaemic heart disease
Participants were classified as having ischaemic heart disease (IHD) if they reported ever having angina or a heart attack diagnosed by a doctor.
Latent Class
Latent class analysis is a statistical approach which categorises
Analysis
people into different groups or 'latent classes' based on responses to a series of questions. LCA operates by identifying the number of classes or groups that best fit the data and generating probabilities membership of each group for every eligible participant. Once this is done, a participant is assigned to the class for which they have the highest probability of membership.
Long-term conditions & limiting long-term conditions
Long-term conditions were defined as a physical or mental health condition or illness lasting, or expected to last 12 months or more. The wording of this question changed in 2012 and is now aligned with the harmonised questions for all large Scottish Government surveys. Between 2008 and 2011 participants were asked whether they had a long-standing physical or mental condition or disability that has troubled them for at least 12 months, or is likely to affect them for at least 12 months. Note that prior to 2008 these were described as long-standing illnesses. Long-term conditions were coded into categories defined in the International Classification of Diseases (ICD), but it should be noted that the ICD is used mostly to classify conditions according to the cause, whereas SHeS classifies according to the reported symptoms. A long-term condition was defined as limiting if the respondent reported that it limited their activities in any way.
Mean
Most means in this report are Arithmetic means (the sum of the values for cases divided by the number of cases). See also Geometric means which are used in the analysis of saliva samples.
Median
The value of a distribution which divides it into two equal parts such that half the cases have values below the median and half the cases have values above the median.
Morbid obesity
See Body mass index.
NHS Health Board
The National Health Service (NHS) in Scotland is divided up into 14 geographically-based local NHS Boards and a number of National Special Health Boards. Health Boards in this report refers to the 14 local NHS Boards. (See Volume 2: Appendix C)
NS-SEC
The National Statistics Socio-economic Classification (NS-SEC) is a social classification system that attempts to classify groups on the basis of employment relations, based on characteristics such as career prospects, autonomy, mode of payment and period of notice. There are fourteen operational categories representing different groups of occupations (for example higher and lower managerial, higher and lower professional) and a further three 'residual' categories for full-time students, occupations that cannot be classified due to lack of information or other reasons. The operational categories may be collapsed to form a nine, eight, five or three category system. This report mostly uses the five category system in which participants are classified as managerial and professional, intermediate, small employers and own account workers, lower supervisory and technical, and semi-routine and routine occupations. In some instances where there were insufficient numbers to use the five category classification, the three category system was used instead. In analyses presented in this report it is the NS-SEC of the household reference person which is used. NS-SEC was introduced in 2001 and replaced Registrar General's Social Class (which had been used in the 1995 and 1998 surveys) as the main measure of socio-economic status.
Obesity
See Body mass index
Overweight
See Body mass index
Percentile
The value of a distribution which partitions the cases into groups of a specified size. For example, the 20th percentile is the value of the distribution where 20 percent of the cases have values below the 20th percentile and 80 percent have values above it. The 50th percentile is the median.
p value
A p value is the probability of the observed result occurring due to chance alone. A p value of less than 5% is conventionally taken to indicate a statistically significant result (p<0.05). It should be noted that the p value is dependent on the sample size, so that with large samples differences or associations which are very small may still be statistically significant. Results should therefore be assessed on the magnitude of the differences or associations as well as on the p value itself. The p values given in this report take into account the clustered sampling design of the survey.
Potassium
The intake of potassium (K) can be estimated by measuring urinary excretion. This is collected in the biological module using a spot urine sample. See also Urine, Sodium, Creatinine. There is an inverse association between potassium intake and blood pressure.
Quintile
Quintiles are percentiles which divide a distribution into fifths, i.e., the 20th, 40th, 60th and 80th percentiles.
Scottish Index of Multiple Deprivation
The Scottish Index of Multiple Deprivation (SIMD) is the Scottish Government's official measure of area based multiple deprivation. It is based on 37 indicators across 7 individual domains of current income, employment, housing, health, education, skills and training and geographic access to services and telecommunications. SIMD is calculated at data zone level, enabling small pockets of deprivation to be identified. The data zones are ranked from most deprived (1) to least deprived (6505) on the overall SIMD index. The result is a comprehensive picture of relative area deprivation across Scotland.
This report uses the SIMD 2012.
http://www.scotland.gov.uk/Topics/Statistics/SIMD
Sodium
The intake of sodium (Na) can be estimated by measuring urinary excretion. This was collected in the biological module using a spot urine sample. There is an association between sodium intake and blood pressure. See also Urine, Potassium, Creatinine.
Standard deviation
The standard deviation is a measure of the extent to which the values within a set of data are dispersed from, or close to, the mean value. In a normally distributed set of data 68% of the cases will lie within one standard deviation of the mean, 95% within two standard deviations and 99% will be within 3 standard deviations. For example, for a mean value of 50 with a standard deviation of 5, 95% of values will lie within the range 40-60.
Standard error
The standard error is a variance estimate that measures the amount of uncertainty (as a result of sampling error) associated with a survey statistic. All data presented in this report in the form of means are presented with their associated standard errors (with the exception of the WEMWBS scores which are also presented with their standard deviations). Confidence intervals are calculated from the standard error; therefore the larger the standard error, the wider the confidence interval will be.
Standardisation
In this report, standardisation refers to standardisation (or 'adjustment') by age (see Age standardisation).
Unit of alcohol
Alcohol consumption is reported in terms of units of alcohol. A unit of alcohol is 8 gms or 10ml of ethanol (pure alcohol). See Chapter 3 of volume 1 of this Report for a full explanation of how reported volumes of different alcoholic drinks were converted into units. The method for doing this has undergone significant change since the report of the 2003 SHeS was published, these are also detailed in Chapter 3.
Waist Circumference
Waist circumference is a measure of deposition of abdominal fat. It was measured during the biological module. A raised waist circumference has been defined as more than 102cm in men and more than 88cm in women.
Circumference fat. It was measured during the biological module. A raised waist circumference has been defined as more than 102cm in men and more than 88cm in women.
WEMWBS
The Warwick-Edinburgh Mental Well-being Scale (WEMWBS) was developed by researchers at the Universities of Warwick and Edinburgh, with funding provided by NHS Health Scotland, to enable the measurement of mental well-being of adults in the UK. It was adapted from a 40 item scale originally developed in New Zealand, the Affectometer 2. The WEMWBS scale comprises 14 positively worded statements with a five item scale ranging from '1 - None of the time' to '5 - All of the time'. The lowest score possible is therefore 14 and the highest is 70. The 14 items are designed to assess positive affect (optimism, cheerfulness, relaxation); and satisfying interpersonal relationships and positive functioning (energy, clear thinking, self-acceptance, personal development, mastery and autonomy).
References:
Kammann, R. and Flett, R. (1983). Sourcebook for measuring well-being with Affectometer 2. Dunedin, New Zealand: Why Not? Foundation.
The briefing paper on the development of WEMWBS is available online from: <www.wellscotland.info/indicators.html>
Contact
Email: Julie Landsberg