Scottish economic insights: March 2026
Provides a summary of latest key economic statistics, forecasts and analysis on the Scottish economy.
Labour market conditions
Employment and unemployment
Scotland’s labour market has continued to be characterised by low unemployment over the past year, however falls in indicators of employee numbers and staffing levels, coupled with slower earnings growth at the end of the year, suggest labour market conditions have loosened over the period. Latest data into the start of 2026, indicate that employment levels have started to stabilise.
The headline unemployment rate for Scotland has remained low throughout 2025 and in the three months to January 2026 was 3.9%, up by 0.1 p.p. from the three months to October. The continuation of low unemployment has also been reflected in the claimant count unemployment rate which was at 3.5% in February 2026. The number of claimants of unemployment related benefits has fallen by c. 1,800 (-1.7%) over the past year, however has risen by c. 4,900 since July last year.[19]
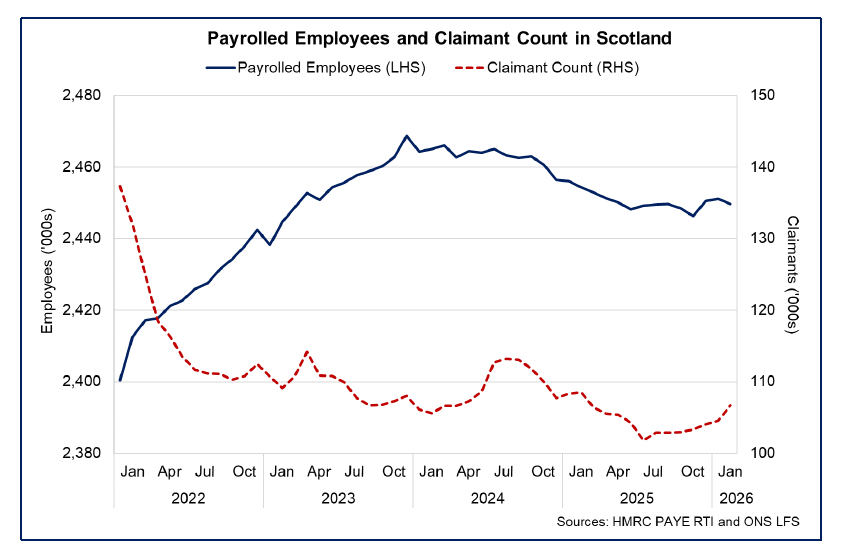
The rise in the number of claimants of unemployment related benefits in the second half of the year, is likely reflecting the fall in payrolled employees, which have fallen by c. 4,800 (-0.2%) over the past year to 2.45 million in January 2026.
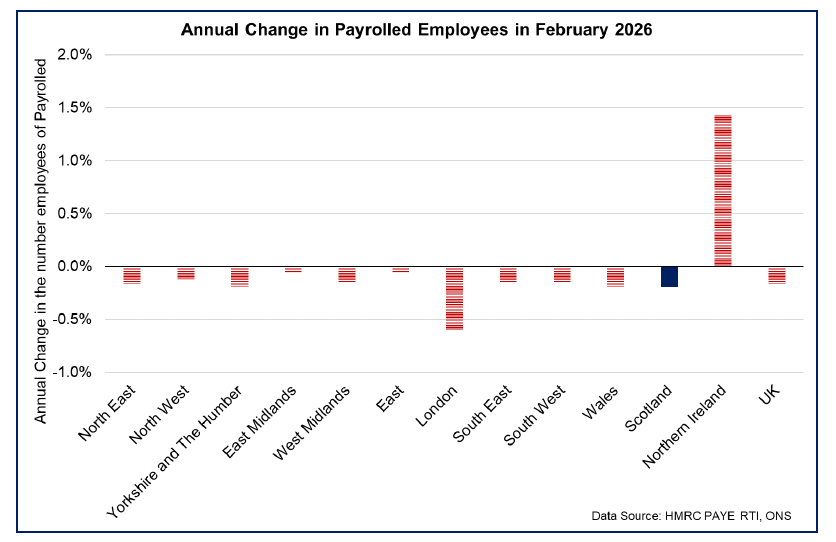
This is a similar trend to nearly all other parts of the UK, with the number of payrolled employees around 49,000 lower than a year ago in the UK as a whole.
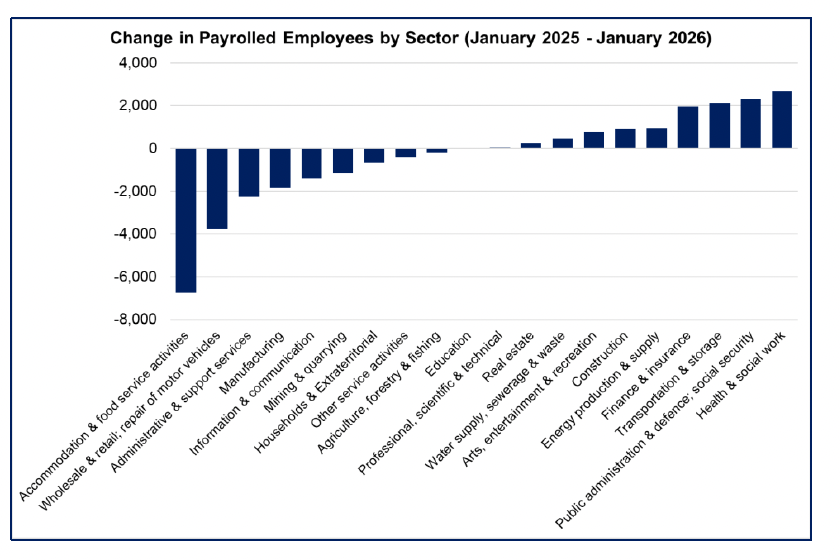
In Scotland, the largest fall in the number of payrolled employees over the year, was in the Accommodation and Food Service Activities sector (c. -6,700), followed by Wholesale, Retail and Motor repairs (c. -3,800 employees) while there have been notable increases in health and social work (c. +2,700) and finance and insurance (c. +2,000).
There are however signs that the fall in payrolled employees may be stabilising with the number in Scotland increasing by 3,400 through the turn of the year since November.
Recruitment activity
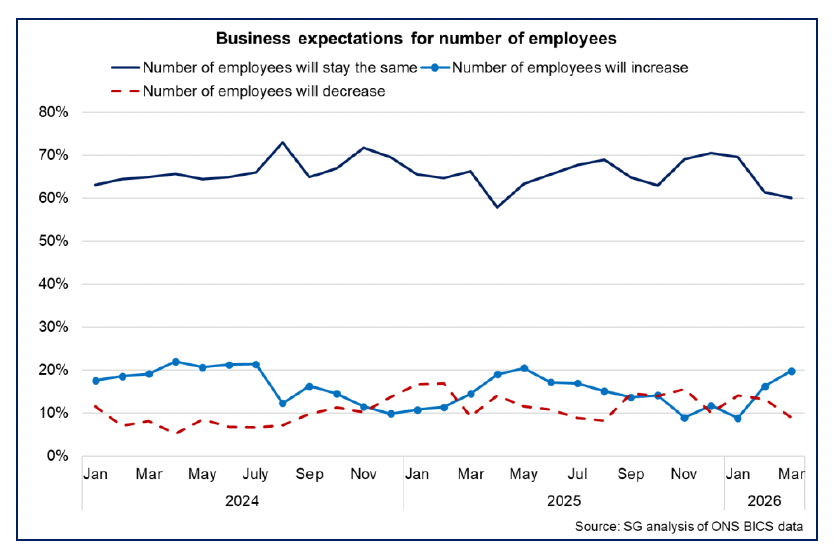
This improvement is also reflected in BICS data which suggests that there has been a recent pick-up in recruitment intentions at the start of the year. Most businesses expect their number of employees to stay the same (60%), however the share expecting an increase rose to 19.8% (up from 16.3% in February) while the share of businesses expecting employee numbers to fall, fell to 9.0% (down from 13.3%).
The increase in employment expectations may have a seasonal element to it and the RBS Growth Tracker business survey also indicates a slightly more mixed picture for the start of the year with its employment index suggesting a moderate fall in staffing levels and at its fastest rate since last August (48.9) (a reading below 50 indicates contracting employment levels). As such, further data in the coming months will provide more insight on whether employment levels have stabilised further. [20]
Earnings
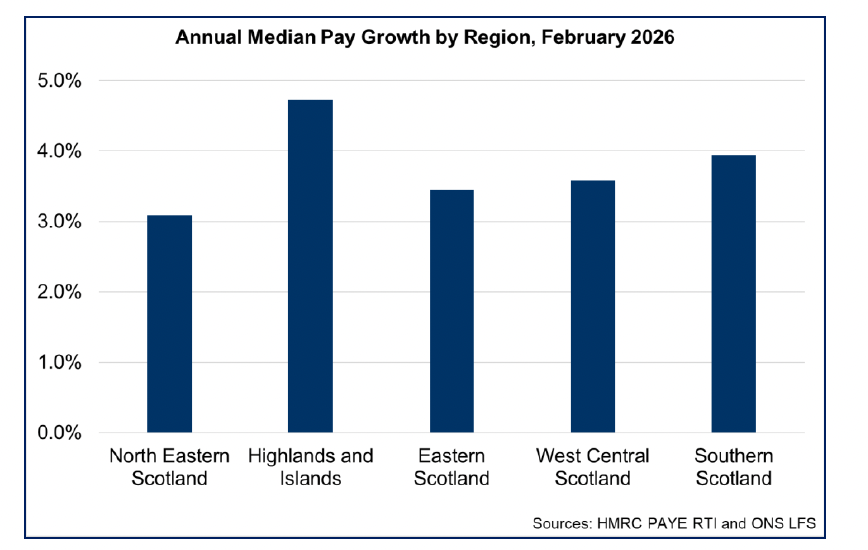
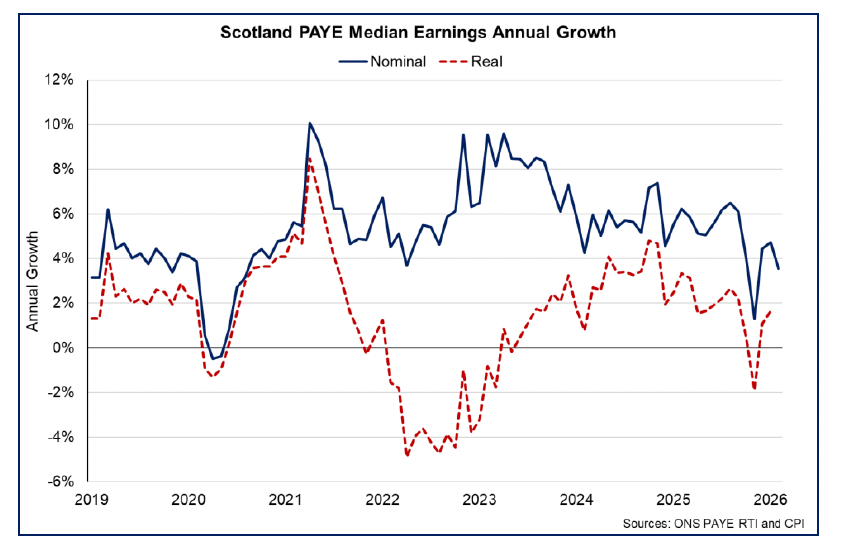
Earnings growth remained robust for most of 2025, however latest data indicates that the pace of growth slowed notably in the final quarter of 2025 and into the new year. Nominal median annual earnings growth was 3.6% in February 2026, slower than the average annual growth rate of 5.2% in 2025. Earnings growth was the highest in Highlands and Islands (4.7%), followed by Southern Scotland (3.9%). Earnings growth was the slowest in North Eastern Scotland where annual earnings grew by 3.1%.
The slower pace of nominal earnings growth in recent months is reflective of the slight loosening in the labour market over the past year and lower inflationary pressures, which have naturally moderated the pace of growth from elevated rates since the end of 2022. Real earnings grew by 1.7% annually in January, once adjusted for inflation, with the annual inflation rate falling to 3%.
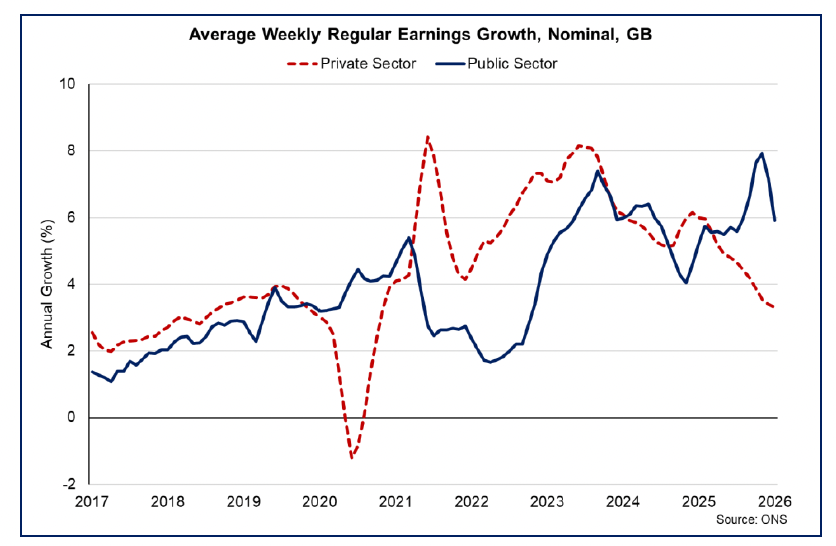
At a GB level, nominal earnings growth over the first half of 2025 remained robust in both the public and private sectors. However, in the second half of the year, 3-monthly earnings growth in the public sector sustainably outpaced that in the private sector. In January 2026, the 3-monthly earnings growth in the public sector was 5.9% (down from 7.2% in December) compared with growth in the private sector of 3.3% (down from 3.4% in December).[21]
Pay growth is expected to be slower over this year than in 2025, with latest intel from the Bank of England suggesting that pay settlements for 2026 will average 3.6% compared with 4% in 2025. [22]
With labour market statistics experiencing declining response rates, we set out alternative labour market indicators in Box 3, using administrative data.
Box 3: Alternative labour market indicators
The Annual Population Survey (APS) and Labour Force Survey (LFS) are key sources for Scottish labour market statistics, covering measures such as employment, unemployment, and economic inactivity. Since the COVID-19 pandemic, the declining response rates for these surveys have led to concerns around the reliability of official estimates of the labour market in Scotland and the UK, and the loss of Accredited Official Statistics status for LFS and APS-based outputs.[23],[24]
Last year, Scottish Government completed Phase One of an assessment for Scotland, exploring the quality of these latest survey estimates and what this means for Scottish labour market statistics.[25] The assessment found that Scotland’s LFS/APS estimates showed clear signs of increased volatility and uncertainty in the period following the pandemic, reflecting (but not exclusively driven by) COVID-19 impacts and survey changes during this time. The ONS has made progress in mitigating these issues.
Following a decision to end funding for the LFS boost for Scotland from October 2025 due to concerns around achieved sample sizes, the Scottish Government also continues to work closely with the ONS to support the development of the transformed Labour Force Survey, a redesigned, online-first survey expected to launch in late 2026. [26]
Reflecting ongoing concerns about the reliability of survey-based labour market statistics, the Scottish Fiscal Commission has increasingly drawn on administrative HMRC PAYE Real Time Information (RTI) data on employee and earnings growth to inform their economic and fiscal forecasts.[27] Similarly, the Resolution Foundation published analysis in November 2024 outlining an alternative measure of the employment rate in the UK using administrative data sources.[28] This suggested that survey-based estimates for those aged 16+ may be understating employment in some periods.
In April 2025, we published a replication of this for Scottish data, finding that the level of employment may have been slightly higher under the new measure, with RTI and LFS-derived 16+ employment rates estimated at 59.8% and 58% respectively in September to November 2024.[29],[30] As shown in the chart below, replicating this approach produces an alternative employment-rate series for those aged 16+ that diverges from the LFS post-pandemic, providing an important supplementary source for interpreting labour market trends, particularly when the quality of survey-based statistics is uncertain. Due to RTI data revisions, employment rates reported here may differ from those shown in last year’s publication, but the trend remains similar. It shows that – in the latest period September to November 2025 - the rate of employment for those aged 16+ is now closely matched under the new measure (58.6% compared to the LFS-derived measure of 59%).
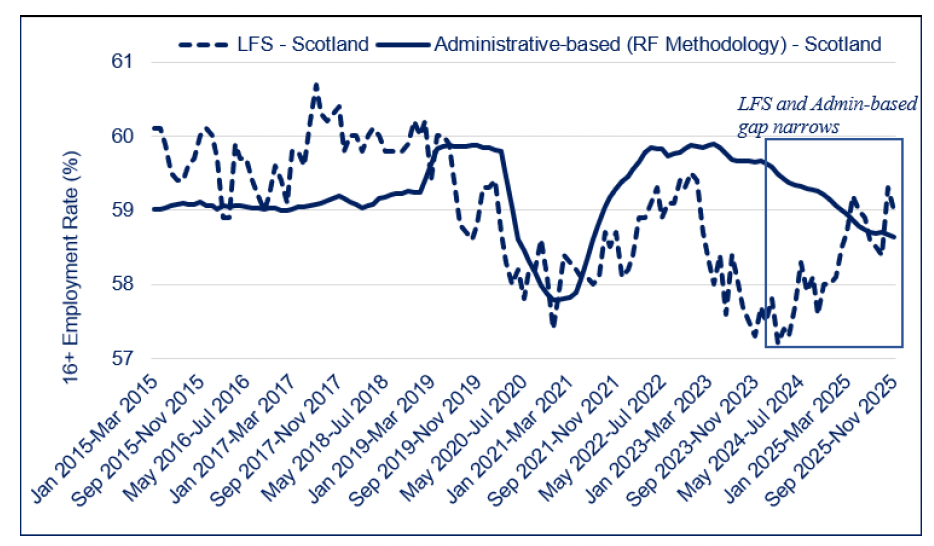
Employment rates for those aged 16+ using both methods are broadly similar prior to the pandemic, though the LFS series is more volatile. Following COVID-19 and a decline in LFS response rates, the series begin to diverge, with the administrative-based series suggesting that the level of employment in Scotland may have been higher than estimated using the LFS. From mid-2024 into 2025 the gap narrows, with convergence largely driven by recovery in the LFS estimate from its low point, alongside gradual easing in the administrative-based series. By the end of the period, the two measures are close. The ONS note that LFS coherence with other labour market sources has improved in 2025, with achieved sample sizes, which had fallen by nearly 40%, back to around 90% of their pre-pandemic levels, although representativeness remains below pre-pandemic levels.[31] The ONS continue to note that the December 2024 reweighting of the LFS has also improved coherence.[32]
Differences between the administrative-based employment measure and the LFS imply that either unemployment, inactivity, or both are potentially lower than the LFS estimates. Given that inactivity is typically larger than unemployment, the Resolution Foundation suggests that, for the UK, much of the recent difference in its estimates may have been associated with lower inactivity than implied by the LFS.
End of Box 3
Contact
Email: economic.statistics@gov.scot