Scottish economic insights: March 2026
Provides a summary of latest key economic statistics, forecasts and analysis on the Scottish economy.
Economic growth and business conditions
Economic growth
Scotland’s economy grew 1.4% in 2025, strengthening from 1.1% in 2024 and 0.7% in 2023. Over the calendar year as a whole, growth was predominantly driven by the services sector (2.0%) and to a lesser extent the construction sector (1.3%). In contrast production sector output fell 1.7%, largely due to a fall in manufacturing output (-4.0%) during a year in which a combination of global headwinds from the changes in US tariffs on goods, and domestic factors including the cessation of oil refining activities at Grangemouth impacted on activity in the sector. There has been a similar pattern of growth at a UK level in 2025 with growth strengthening to 1.3%, up from 1.1% in 2024.[5]
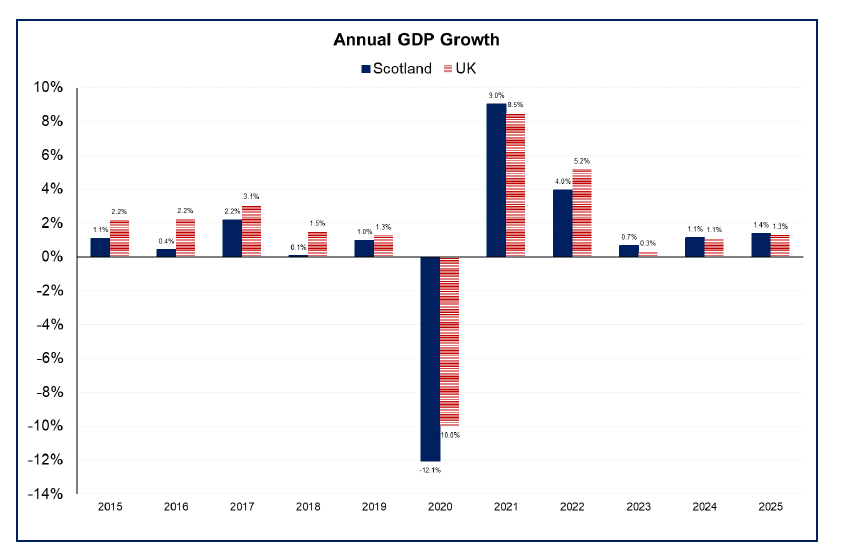
During 2025, the pace of growth was front loaded to the start of the year with growth remaining relatively stable through the second half of the year but slowing to 0.1% in the fourth quarter.
At a sector level, services was the constant driver of growth across the year, however its pace of growth slowed in the fourth quarter to 0.1%. Slower growth was relatively broad based across the services industries with consumer facing services contracting 0.1%.
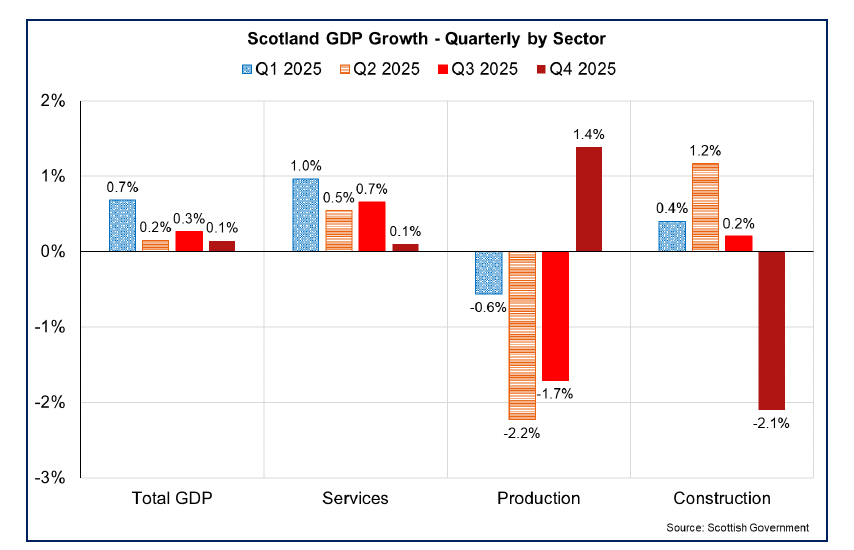
In contrast, the pace of growth in the production sector in the fourth quarter picked up to its fastest rate since the second quarter of 2024, in part driven by the return to positive growth in manufacturing output (1.5%). During the year, manufacturing of refined petroleum, chemical and pharmaceutical products had been impacted by the cessation of oil refinery activity at Grangemouth in April. However industry output returned to growth in the fourth quarter (6.1%) alongside a pick-up in growth in the manufacture of metals and metal products (6.8%) and computer, electrical and optical products (3.7%).
Taking a broader view of the economy, Scotland’s natural capital accounts for a large share of economic output and some sectors of the economy – electricity and agriculture - rely on natural capital (see Box 1).
Box 1: Insights on Scottish economy’s reliance on natural capital
Around £40 billion of economic output and around 260,000 full-time equivalent (FTE) jobs can be estimated as the value of natural capital to the Scottish economy, as identified in The Importance of Natural Capital to the Scottish Economy 2024 analysis.[6] This economic research found only 27% of wider ecosystem services not traded in the market could in theory be substituted by human interventions - meaning the majority of business critical nature is irreplaceable. Two supplementary reports were published in 2026 highlighting insights from the original model - providing regional and marine and terrestrial breakdowns of the economic value of natural capital.[7],[8]
Nature acts as a fundamental, often unpriced, asset base for global and national economies. Natural capital - comprising of ecosystems, biodiversity, soil, water, and minerals - is used to recognise how nature underpins societal and economic activity. In 2022, the National Strategy for Economic Transformation (NSET) highlighted how natural capital is crucial in delivering a Wellbeing Economy for Scotland.
| Industry | Total Output (Direct and Indirect) (£bn) | Total Employment (Direct and Indirect) (FTE) | Share (%) of additional economic natural capital value that cannot be replaced by human intervention |
|---|---|---|---|
| Electricity | £10.5 | 28,600 | 84% |
| Agriculture | £7.6 | 64,300 | 59% |
| Water & sewerage | £2.3 | 9,500 | 86% |
| Aquaculture | £2.3 | 12,100 | 59% |
| Fish & fruit processing | £1.5 | 8,200 | 89% |
| Meat processing | £1.4 | 8,700 | 89% |
| Gas & Air Conditioning | £1.2 | 2,700 | 100% |
| Retail – excl. vehicles | £1.1 | 15,800 | 87% |
| Public administration & defence | £0.9 | 7,100 | 87% |
| Health | £0.7 | 8,200 | 100% |
| Food & beverage services | £0.6 | 9,400 | 50% |
| Education | £0.4 | 7,800 | 100% |
The research identifies sectors of the Scottish economy reliant on high-quality, renewable natural capital and quantifies their value to the economy. It offers an innovative methodology on how natural capital reliance could be measured within, and beyond, the boundaries of traditional market-based economic statistics by expanding them with the value of ecosystem services not priced in the market, such as pollination, temperature regulation, or water filtration. Whilst these are the best estimates, they only showcase the minimum value of natural capital to the economy.
Scottish National Accounts (SNA) data for 2019 is used as the basis for the analysis, with business activity reliance on nature expanded beyond what is traded in the market. Standard Industrial Classification (SIC) codes are used to look at economic activity at the national and regional levels. Whilst tourism relies heavily on natural capital, it is not a distinct industry in SIC or SNA classifications, therefore it has no standalone estimate. Nonetheless, the impacts on tourism are reflected through the value of other sectors.
Regional Natural Capital Economic Reliance
The analysis also shows results by Regional Economic Partnerships (REP), with infographics outlining output, employment, and industry reliance on ecosystem services.[11] The natural capital value is attributed to where economic activity is estimated to occur, based on employment, not where the physical assets and ecosystem services are located. As a result, Glasgow City REP has the greatest share as, for example, many energy companies have offices, and consequently a large share of jobs, in Glasgow despite the electricity being generated elsewhere in the country.
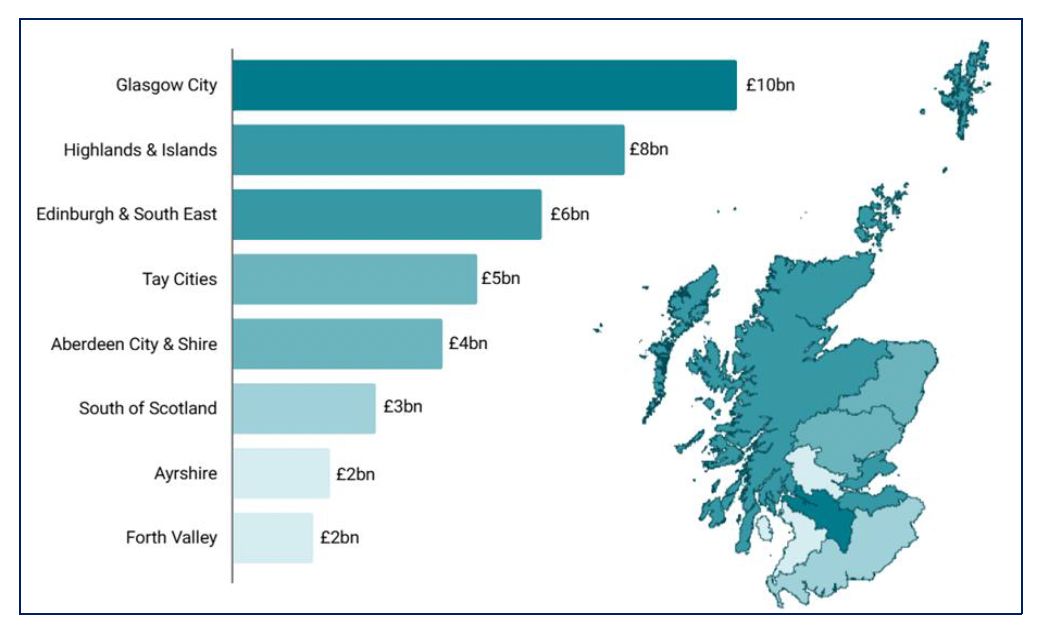
For example, the Highlands & Islands REP has the second highest amount of output and employment supported by natural capital, due to its extensive agricultural land and coastline. Around £8 billion of the REP’s output and around 53,900 FTE jobs can be estimated as the economic value from natural capital. The top 5 industries accounting for the largest share of natural capital reliant economic activity are: agriculture, aquaculture, electricity, fish and fruit processing, water and sewerage.
Marine-Terrestrial Natural Capital Economic Reliance
A supplementary report proposed a new methodology using the original model to attribute natural capital economic reliance to either marine or terrestrial habitats, suggesting that 16% of the identified economic value can be attributed to marine and 84% to terrestrial natural capital.[12]
Around £6.5 billion of Scotland’s total economic output and 38,700 jobs are estimated as the value of marine natural capital to the Scottish economy. On the other hand, around £33.6 billion of Scotland’s total economic output and 222,900 jobs are estimated as the value of terrestrial natural capital in Scotland.
Table B1.2: Top 5 industries (according to SIC code classification) most dependent on marine and terrestrial natural capital
Marine Natural Capital
Aquaculture
Fish and Fruit Processing
Electricity
Fishing
Food and Beverage Services
Terrestrial Natural Capital
Electricity
Agriculture
Water and Sewerage
Meat Processing
Gas and Air Conditioning
Innovative Methodology – beyond traditional economic statistics
Defining natural capital dependent industries
First, core natural capital industries which fundamentally rely on ecosystem assets (e.g. agriculture, fishing, forestry) are determined, establishing a proxy for economic reliance. This approach offers alignment with National Accounts approaches, and captures provisioning ecosystem services value. The focus is on industries which rely on nature’s ability to regenerate and provide sustainable benefits, meaning non-renewables like oil and gas are excluded from the main analysis.
Quantifying natural capital dependence in the wider economy
Next, businesses which rely on the core natural capital industries are identified using expenditure patterns in order to quantify the wider supply chain economic activity supported by natural capital. This approach offers alignment with National Accounts approaches, and captures provisioning ecosystem services value
Wider ecosystem service dependence not captured in market data
Ecosystem service dependence of industries is scored using the United Nation’s ENCORE (Exploring Natural Capital Opportunities, Risks, and Exposure) database to determine the degree to which industrial processes depend on provisioning, regulating and cultural ecosystem services.[13]
To quantify this additional reliance which is most likely not captured in market prices, the share of ecosystem services which could in theory be substituted by human intervention is identified. The study finds that most ecosystem services cannot be substituted by humans. The economic activity potentially involved in providing the key natural processes is then quantified and added on to the market-based estimates, to arrive at final wider natural capital value estimates.
End of Box 1
Business conditions
Business conditions have remained challenging across 2025 and into the start of 2026 with businesses continuing to report subdued demand, cost pressures and broader economic uncertainty. Latest business survey data reflects on responses before the escalation of the conflict in the Middle East.
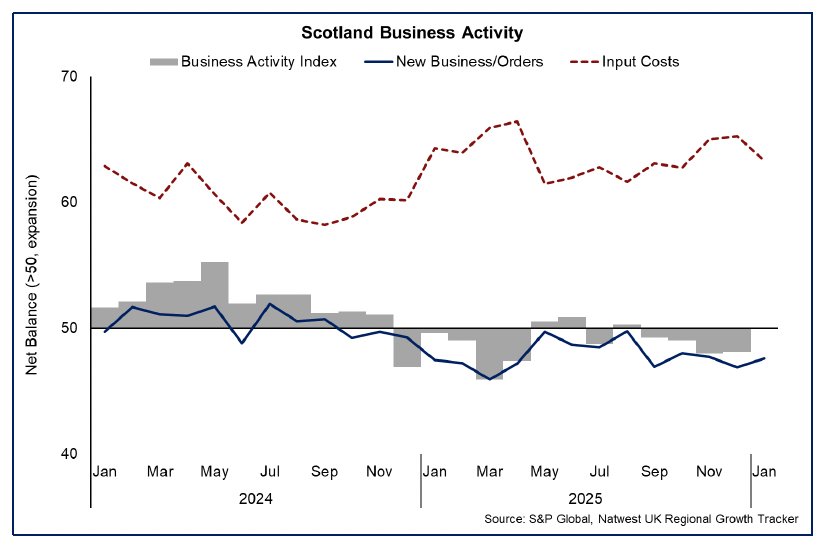
The RBS Growth Tracker business survey indicated a pattern of falling business activity over 2025 in part driven by moderate and persistent contractions in new business orders. Latest data for January this year, indicate that overall business activity was stable during the month with a reading of 50 (a reading below 50 indicates contracting business activity), following four consecutive months of falling activity. However underlying demand remained weak with a further fall in new orders for the sixteenth consecutive month albeit to a lesser extent than in December. Cost of living and economic uncertainty were cited by businesses as weighing on new orders.[14]
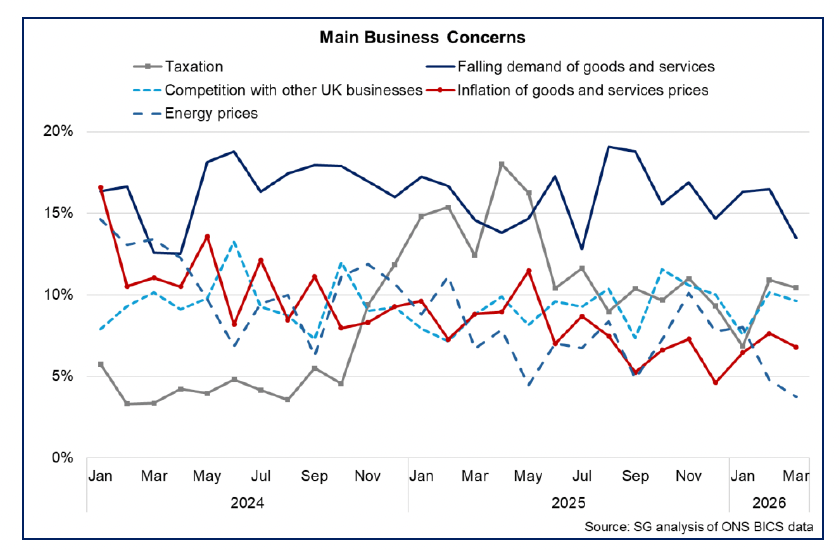
This pattern has been reflected in business concerns over this period with falling demand for goods and services a main concern through 2025 and into the start of this year. Latest data from the Business Insights and Conditions Survey (BICS) shows 13.5% of businesses reported it as their main concern in March. Taxation as a main business concern remained broadly stable through the second half of 2025 following an increase around the UK budget which included an increase in employer NICs. It has remained broadly stable at the start of 2026 with 10.4% of businesses citing taxation as a main concern in March.[15]
Businesses continued to report cost pressure challenges throughout 2025, and expect them to continue in 2026. The RBS Growth Tracker business survey indicated that growth in input costs strengthened through the second half of 2025, before easing slightly in January. The Scottish Business Monitor for Q4 2025 reported that 89.7% of businesses expected to face higher total costs in the first half of 2026.[16] Most recently, BICS data shows that the proportion of businesses expecting prices to increase, has been elevated at the start of 2026 compared with the latter half of 2025 with 18.3% of businesses expecting the price of goods and services to increase in March (up from an average of 13.3% in the second half of 2025).
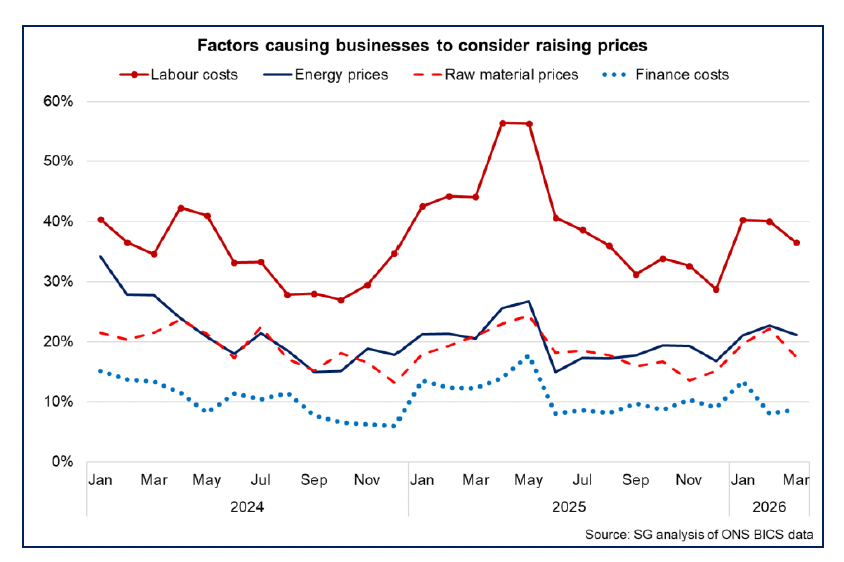
Labour costs remain a key source of cost pressures faced by businesses. The Scottish Chambers of Commerce Quarterly Economic Indicator for Q4 2025 showed that a significant proportion of businesses (77%) reported increased cost pressures due to labour costs.[17] Most recently, BICS data showed that 36.5% of businesses reported labour costs as a factor in considering increasing prices in March, followed by energy prices (21.2%) and raw materials (17.5%).
In terms of how the combination of continued cost pressures and subdued demand may impact on business capital expenditure expectations, the Scottish Business Monitor for Q4 2025 showed that the balance of firms reporting an increase in new capital investment fell to its lowest level of the year (-25.0). More recently, latest BICS data from January showed that 15.2% of businesses expected capital expenditure to increase in the first quarter of 2026, up from Q4 2025 but remains below the average shares reported across 2024 and 2025.
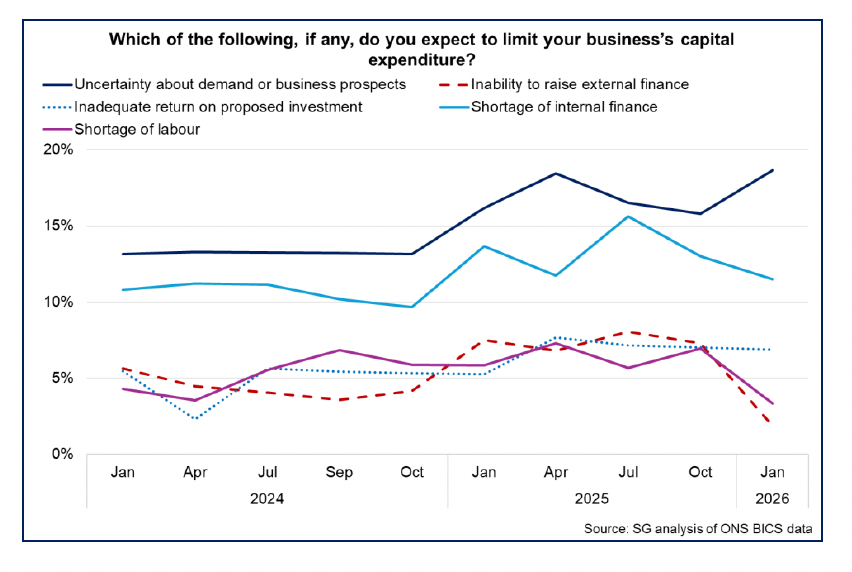
Uncertainty about demand or business prospects continues to be the most commonly cited factor expected to limit a business’s capital expenditure in Q1 2026 (18.7%), and has increased over the past year, followed by shortage of internal finance (11.5%). There has been a fall in the share of businesses reporting an inability to raise external finance and shortage of labour as limiting factors on capital expenditure, which may reflect the easing of interest rates over the past year and the loosening in the labour market.
Despite ongoing challenging business conditions, the RBS Growth Tracker business survey indicates that business optimism for growth has strengthened through the turn of the year. As set out above, the escalation of the conflict in the Middle East has increased uncertainty in the economic outlook, particularly for inflationary pressures. While there is still significant uncertainty at this stage about the extent to which the conflict will directly impact the economy and business conditions, the increased uncertainty risks weighing on business confidence and potentially investment planning in the coming months. Business sentiment is a key driver of business decision making and investment and Box 2 sets out the latest evidence on an index of business sentiment index.
Box 2: Scottish Business Sentiment Index Update
In May 2025, the Scottish Government published the first estimates from a new Scottish Business Sentiment Index (BSI), which aims to provide a comprehensive, real-time measure of business confidence in Scotland by analysing sentiment in news articles related to corporate and industrial developments.[18] This box provides a short update on the index.
The chart below shows the latest monthly data for the BSI, focussing on the period 2020 onwards. The BSI can display relatively large month on month movements, but key trends can be drawn out. Firstly, the effect of the Covid-19 pandemic is clearly visible, as is the recovery, when sentiment improved to relatively high levels. Sentiment then fell back during 2022, which is likely to reflect both a reversion to mean effect and the negative effects on business sentiment of the increase in energy prices following the war in Ukraine and supply chain challenges that were seen after Covid-19 restrictions were fully lifted. However, business sentiment generally improved across 2023 and 2024.
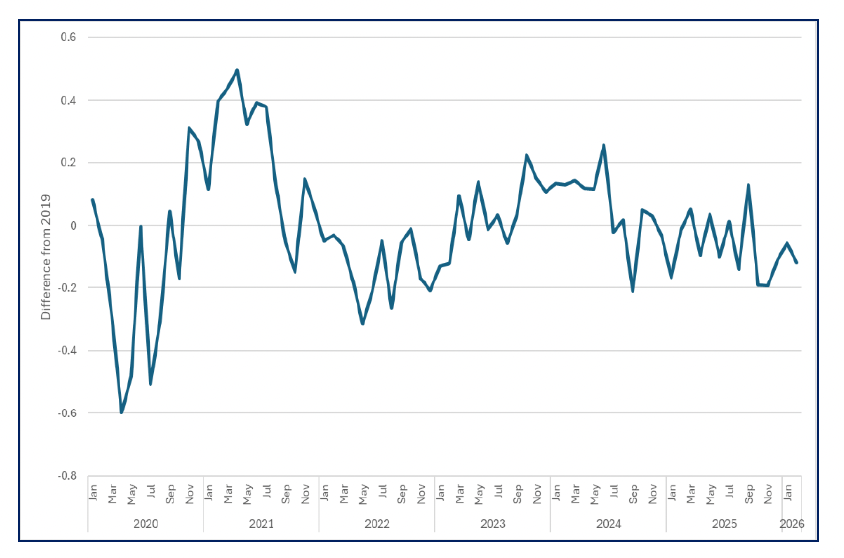
Business sentiment then fell in the latter half of 2024, which coincided with the increase in business taxes in the UK Budget. Sentiment has remained at this relatively subdued level since, with no signs of sustained recovery or falling further in response to increased global trade and geopolitical uncertainty.
The BSI remains in development, and we welcome further comments from users on how best to present the results.
End of Box 2
Contact
Email: economic.statistics@gov.scot