Scottish Crop Map 2019
The ‘Scottish Crop Map’ shows all the agricultural fields in Scotland categorised into the likely main crop types which were grown in 2019.
Quality Assurance
The quality assurance steps taken here are to identify any weaknesses within our model and to provide greater understanding of how well different crops are being predicted. Within the QA exercise limitation of masking non-fields are outlined, accuracy of the predictions within the model were explored and comparisons were made to census data. Caution must be taken when comparing our data to census findings as the census figures will have associated caveats. The knowledge gained from this exercise will support further development of the crop map model.
Masking non-field areas
Areas of potential or young forestry may be included as fields if not accounted for within the spatial dataset at the time the mask for this project was created.
Model accuracies
The model produced an overall accuracy score of 98.86% with 95 % confidence intervals of 98.45% to 99.19% for the test data. The Kappa statistic (which compares the observed to the expected accuracy) was 0.89.
| Crop | Producer accuracy |
|---|---|
| Spring Barley | 94.12 |
| Winter Barley | 94.44 |
| Winter Wheat | 100.00 |
| Spring Oats | 41.18 |
| Grassland | 99.38 |
Source: Scottish Crop Map 2019, RESAS
Four out of five groups classified had accuracy scores of over 90%. Spring oats likely underperformed due to being under-represented in the ground-truth data and similarities in its appearance to other crops (Table 4).
Source: Scottish Crop Map 2019, RESAS
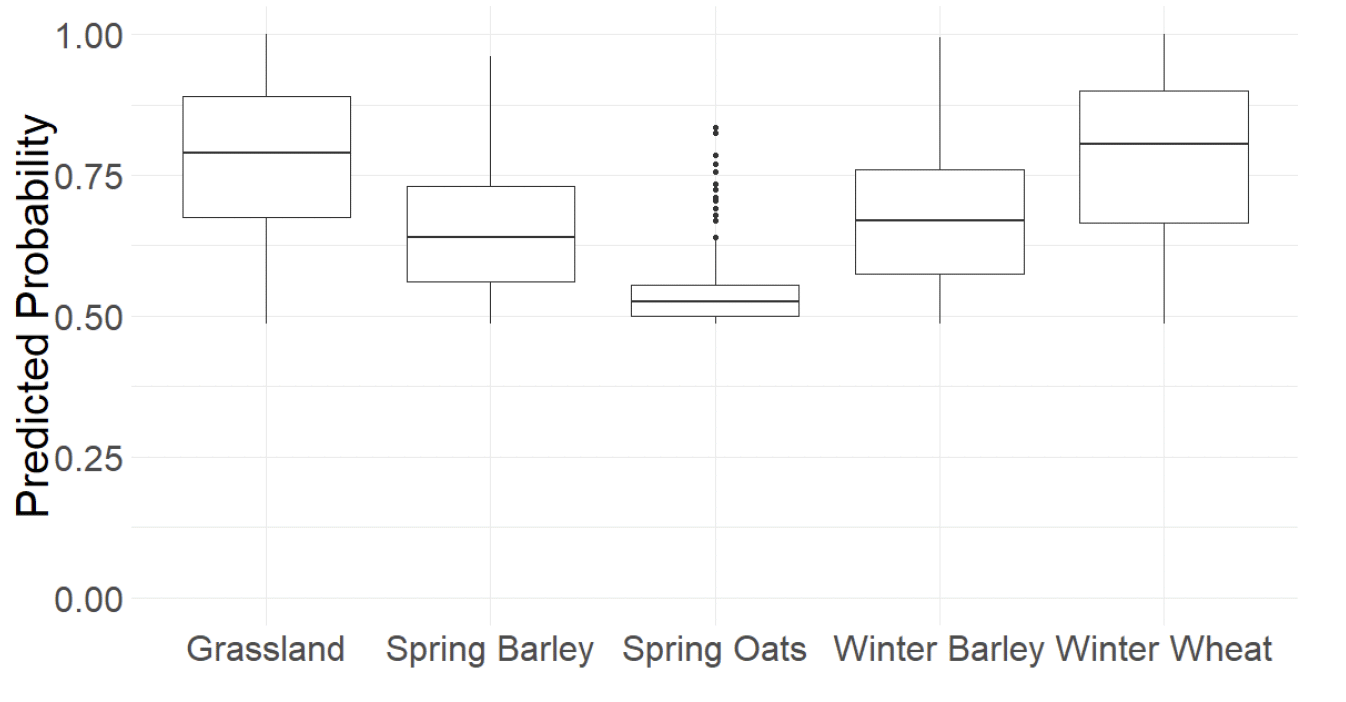
As seen in Chart 8 there is variation between the crops in how well fields are being predicted. The probability cut off for the model was 0.48. Grassland, spring barley, winter barley and winter wheat have median probabilities above 0.625. Spring oats median fell close to the cut off, this suggests the model had difficulty predicting spring oats and had lower confidence in each field that was predicted as spring oat compared to the other groups.
| Actual | ||||||
|---|---|---|---|---|---|---|
| Grassland | Spring Barley | Spring Oats | Winter Barley | Winter Wheat | ||
| Predicted | Grassland | 7599 | 6 | 3 | 0 | 0 |
| Spring Barley | 2 | 265 | 0 | 0 | 0 | |
| Spring Oats | 1 | 0 | 14 | 0 | 0 | |
| Winter Barley | 3 | 1 | 0 | 44 | 0 | |
| Winter Wheat | 3 | 0 | 1 | 0 | 67 | |
Source: Scottish Crop Map 2019, RESAS
To test how well ground truth data lined up with model predictions a confusion matrix was used. Table 5 shows the confusion matrix for the dataset. The field predictions for the crops with ground truth data performed well for all groups. While spring oats has the highest proportion misidentified it also has the lowest number of fields.
Model predictions compared to known census areas
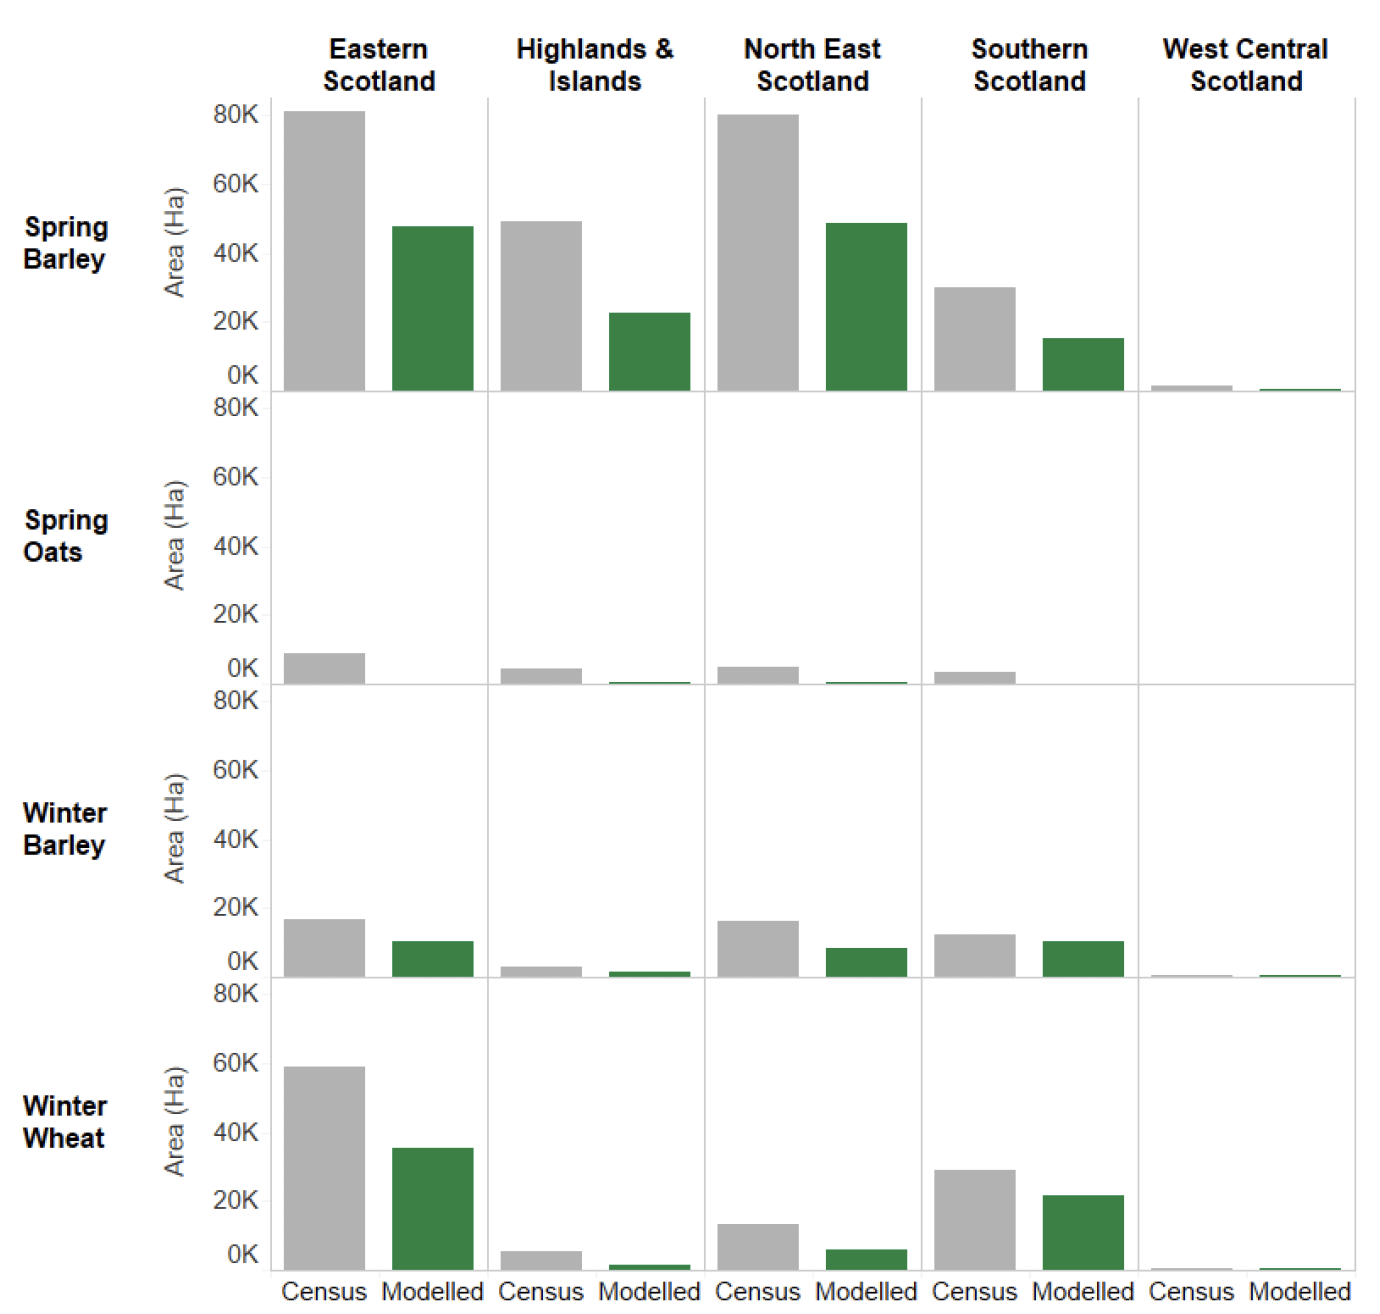
The model currently includes zonal statistics produced from radar images and the size of the fields as variables, even with such few variables some predicted crops areas are close to the census areas. Winter barley and wheat performed best in the model when comparing the total areas of each crops to the census areas, however spring oats again performed particularly badly (Table 6).
| Crop | Modelled area (Ha) | Census area (Ha) |
|---|---|---|
| Spring Barley | 134,744 | 242,090 |
| Winter Barley | 30,996 | 48,802 |
| Winter Wheat | 64,862 | * 107,480 |
| Spring Oats | 1,054 | * 21,905 |
| Grassland | 1,811,859 | 1,126,627 |
* Census areas for wheat and oats combines both spring and winter
Source: Scottish Crop Map 2019, June Agricultural Census, RESAS
Source: Scottish Crop Map 2019, June Agricultural Census, RESAS
When comparing the predicted areas per crop to census areas we find that the model underestimates area for all crop types and regions, as seen in Chart 9. The closest predicted areas were for winter barley in Southern Scotland which were 15 per cent different to the census area. Winter Wheat in Southern Scotland had a predicted area which was 25 per cent different to the census area in that region. Spring barley consistently underestimated with differences from the census areas ranging from 40 to 63 per cent.
Contact
Email: agric.stats@gov.scot