Scotland's Labour Market: People, Places and Regions – Protected Characteristics. Statistics from the Annual Population Survey 2021
Summary publication of results from the ONS Annual Population Survey January to December 2021, presenting analysis on the labour market by protected characteristics including age, sex, disability and ethnicity.
Part of
Ethnicity
Respondents are asked questions about their ethnicity in the labour force survey interview. "Minority Ethnic" describes all ethnic groups excluding those who answered "White" to the first question. There is more information in the Concepts and Definitions section.
There will also be variation between the individual ethnic groups included within the combined 'Minority ethnic' group which should be considered.
Employment
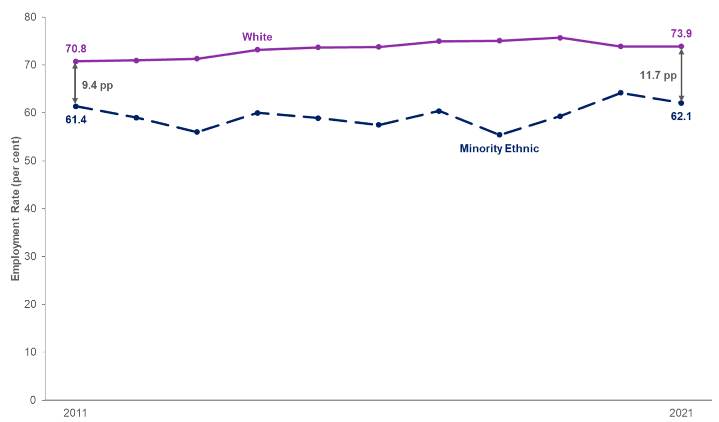
The minority ethnic group aged 16 to 64 has consistently had a lower employment rate than the white group.
The employment rate for the minority ethnic group aged 16 to 64 was estimated at 62.1 per cent in 2021. This is significantly lower than the rate for the white group (73.9 per cent). Therefore, the ethnicity employment rate gap was estimated at 11.7 percentage points (pp). This represents a statistically significant gap.
Minority ethnic employment rate gap
This is the difference between the employment rates of the minority ethnic and white groups aged 16 to 64 years. It is calculated as the white employment rate minus minority ethnic employment rate.
Although the minority ethnic employment gap had increased by 2.0 pp over the year, it had decreased by 4.7 pp since 2019. The reduction in the gap was driven by the employment rate for the minority ethnic group increasing, while the employment rate for the white group decreased.
The employment rate for the white group remained constant over the year. However, it decreased from 75.7 per cent in 2019 to 73.9 per cent in 2021. This was a statistically significant decrease. The employment rate for the minority ethnic group decreased from 64.2 per cent in 2020 to 62.1 per cent in 2021. However, the employment rate for the minority ethnic group in 2021 was still above the 2019 rate of 59.3.
Source: Annual Population Survey, January to December datasets, ONS
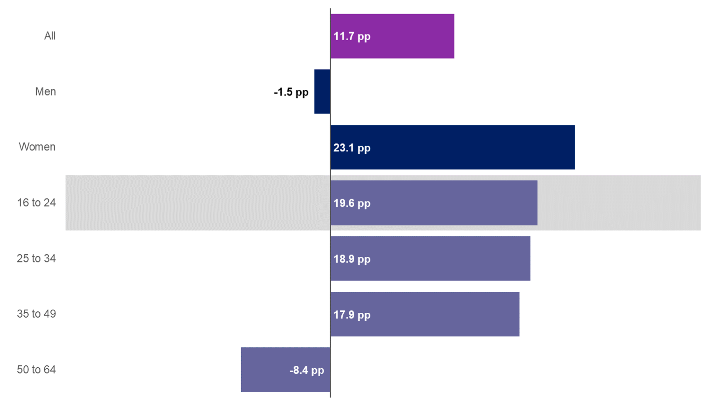
Across the series, the ethnicity employment rate gap for women aged 16 to 64 has been consistently higher than the gap for men. In 2021, the ethnicity employment rate gap for women was estimated at 23.1 pp. While the gap for men was estimated at -1.5 pp. A negative ethnicity employment rate gap is where the rate for the minority ethnic group is higher than the rate for the white group.
In 2021, the ethnicity employment rate gap was largest for those aged 16 to 24 (19.6 pp) followed by those aged 25 to 34 (18.9 pp). The gap for 35 to 49 year olds was 17.9 pp and the gap for those aged 50 to 64 was -8.4 pp.
Estimates for 16 to 24 year olds are based on small sample sizes. They may be less precise and users should be cautious when quoting them.
Source: Annual Population Survey, January to December 2021, ONS
Note: A shaded background indicates estimates are based on a small sample size. This may result in less precise estimates, which should be used with caution.
Unemployment
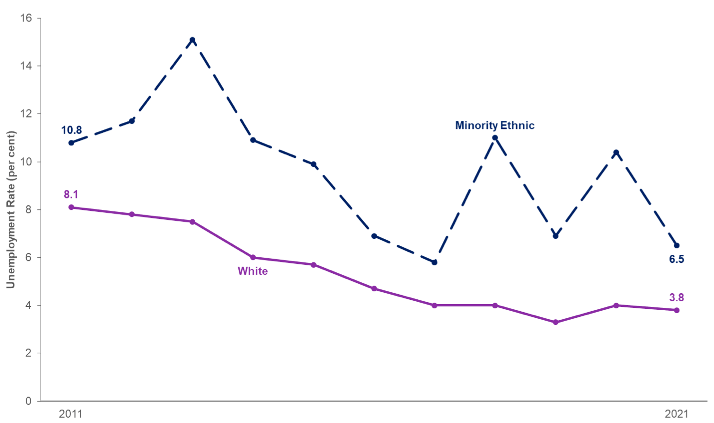
The unemployment rate for the minority ethnic group aged 16 and over in Scotland has been consistently higher than the rate for the white group.
In 2021, the unemployment rate for the minority ethnic group was estimated at 6.5 per cent. This is lower than the year before (10.4 per cent) and lower than 2019 (6.9 per cent). While the unemployment rate for the white group was estimated at 3.8 per cent. This is slightly lower than the year before (4.0 per cent) but higher than in 2019 (3.3 per cent).
The 2021 unemployment rate estimate for the minority ethnic group is based on a small sample size. It may be less precise and users should be cautious when quoting it.
Source: Annual Population Survey, January to December datasets, ONS
Economic Inactivity
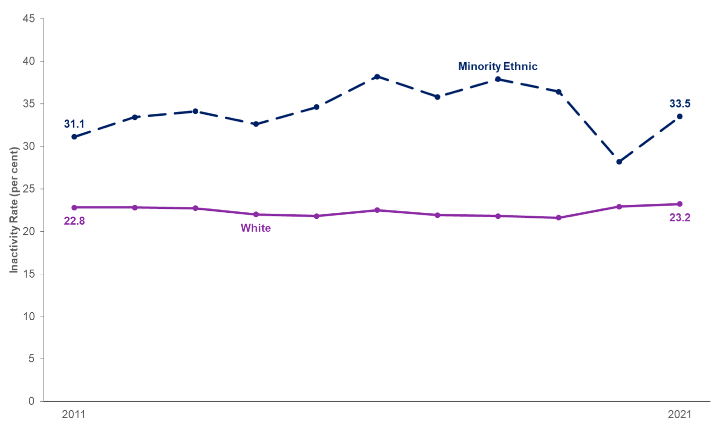
In 2021, the economic inactivity rate for the minority ethnic group aged 16 to 64 was estimated at 33.5 per cent. This was higher than the economic inactivity rate for the white group (23.2 per cent).
The minority ethnic inactivity rate in 2021 was higher than the year before (28.2 per cent) but lower than the rate seen in 2019 (36.4 per cent). Whereas the inactivity rate for the white group was higher than the year before (22.9 per cent) and 2019 (21.6 per cent). The increase in the rate for the white group since 2019 is statistically significant.
Source: Annual Population Survey, January to December datasets, ONS
Contact
Email: lmstats@gov.scot