Scotland's Labour Market: People, Places and Regions – Protected Characteristics. Statistics from the Annual Population Survey 2021
Summary publication of results from the ONS Annual Population Survey January to December 2021, presenting analysis on the labour market by protected characteristics including age, sex, disability and ethnicity.
Part of
Disability
We define disability based on the Equality Act 2010. Level and rate estimates for employment, unemployment and inactivity by disability are all based on those aged 16 to 64 years. There is more information in the Concepts and Definitions section.
Employment
In 2021, an estimated 407,400 disabled people aged 16 to 64 were in employment. The employment rate for disabled people aged 16 to 64 was estimated at 49.6 per cent. This was significantly lower than the rate for non-disabled people (80.8 per cent). Therefore, the disability employment rate gap was estimated at 31.2 percentage points. This represents a statistically significant gap.
Disability employment rate gap
The difference between the employment rate for disabled and non-disabled people aged 16 to 64. It is calculated as the non-disabled employment rate minus disabled employment rate.
The disability employment gap has decreased by 2.2 percentage points (pp) over the year. Since 2019 (pre-pandemic), it has decreased by 1.4 pp.
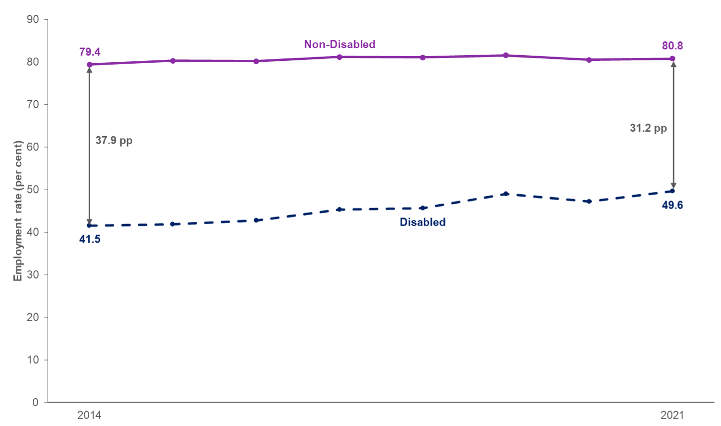
Source: Annual Population Survey, January to December datasets, ONS
The employment rate for non-disabled people increased from 80.5 per cent in 2020 to 80.8 per cent in 2021. However, the employment rate for non-disabled people remains below the 2019 (pre-pandemic) rate of 81.6 per cent. Whereas, the employment rate for disabled people increased from 47.2 per cent in 2020 to 49.6 per cent in 2021 and is now above the rate in 2019 (49.0 per cent).
The reduction in the disability employment gap from 2019 to 2021 was due to the employment rate for disabled people increasing. While the employment rate for non-disabled people decreased over the same period.
The disability employment rate gap was lower for women aged 16 to 64 (26.2 percentage points (pp)) than men (36.8 pp). The gap was lower for women than men across all age bands.
The disability employment rate gap was lowest for those aged 16 to 24 and highest for those aged 35 to 49.
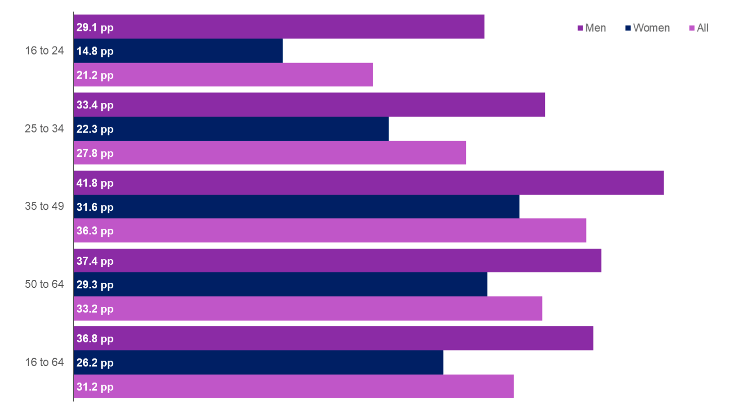
Source: Annual Population Survey, January to December 2021, ONS
Unemployment
In 2021, an estimated 32,000 disabled people aged 16 to 64 were unemployed. The unemployment rate for disabled people aged 16 to 64 in Scotland is higher than for non-disabled people. This is true for all years in the calendar series. However, the unemployment rates have generally been decreasing over time.
In 2021, the unemployment rate for disabled people was estimated at 7.3 per cent. This is lower than the year before (8.0 per cent) and lower than 2019 (8.2 per cent). While the unemployment rate for non-disabled people was estimated at 3.3 per cent. This is lower than the year before (3.8 per cent) but higher than in 2019 (2.8 per cent).
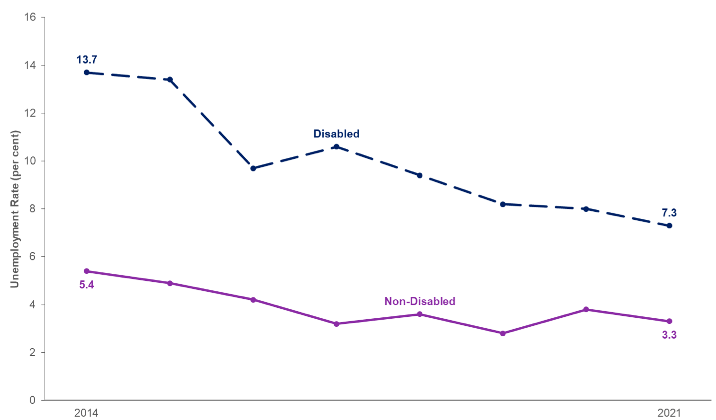
Source: Annual Population Survey, January to December datasets, ONS
Economic Inactivity
In 2021, an estimated 381,400 disabled people aged 16 to 64 were economically inactive. The economic inactivity rate for disabled people aged 16 to 64 was estimated at 46.5 per cent. This was significantly higher than the inactivity rate for non-disabled people (16.4 per cent).
The inactivity rate for disabled people in 2021 was lower than the year before (48.7 per cent). However, it was close to the rate seen in 2019 (46.6 per cent). Whereas, the inactivity rate for non-disabled people remained relatively constant over the same period.
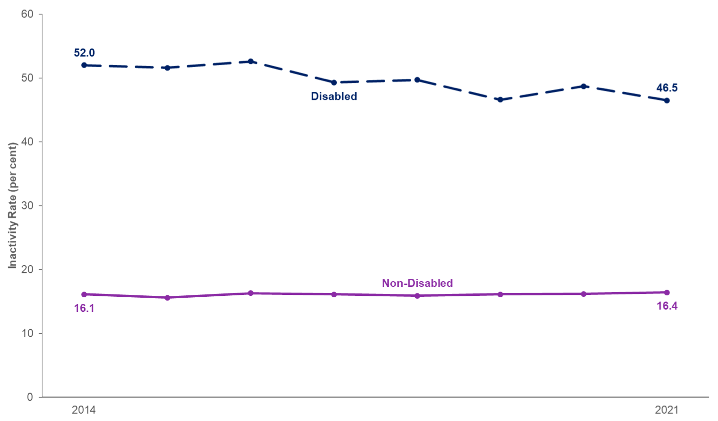
Source: Annual Population Survey, January to December datasets, ONS
Contact
Email: lmstats@gov.scot