Scotland's Labour Market: People, Places and Regions – Protected Characteristics. Statistics from the Annual Population Survey 2021
Summary publication of results from the ONS Annual Population Survey January to December 2021, presenting analysis on the labour market by protected characteristics including age, sex, disability and ethnicity.
Part of
Sex
Employment
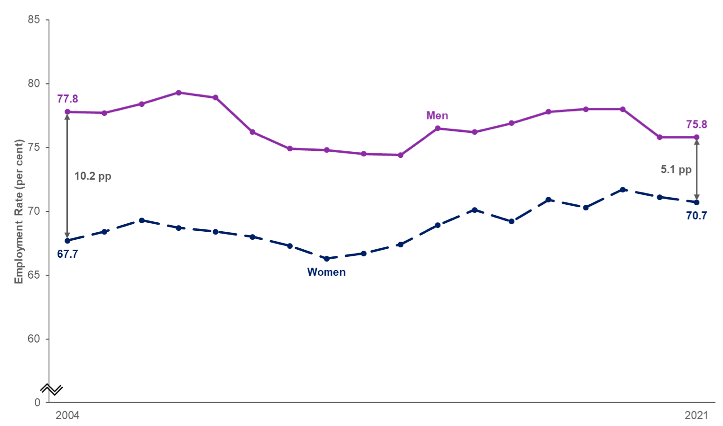
In 2021, 1,277,500 women aged 16 years and over were estimated to be in employment in Scotland. This was 23,000 lower than the number of women employed in 2019 (pre-pandemic). The employment rate (16 to 64 year olds) for women was estimated at 70.7 per cent. This was 1.1 percentage point lower than 2019 (71.7 per cent).
1,324,300 men aged 16 years and over were estimated to be in employment in 2021, 39,100 less compared with 2019. The employment rate (16 to 64 year olds) for men was estimated to have decreased from 78.0 per cent in 2019 to 75.8 per cent in 2021. This represents a statistically significant decrease since 2019.
Gender Employment Gap
The gender employment gap is the difference between the employment rate for men and women aged 16 to 64. It is calculated as the employment rate for men minus the employment rate for women.
The gender employment gap increased from 4.7 percentage points in 2020 to 5.1 percentage points (pp) in 2021. However, the 2021 gap is smaller than the gap of 6.3 pp in 2019. This is the second smallest gap in the calendar series behind 2020.
The gender employment gap increased over the year due to the rate for women decreasing while the rate for men remained the same. However, the gap decreased between 2019 and 2021. This was due to the employment rate for men decreasing at a faster pace than the employment rate for women between 2019 and 2021. The decrease in the employment rate for men between 2019 and 2021 was statistically significant.
Source: Annual Population Survey, January to December datasets, ONS
Local Authority area estimates
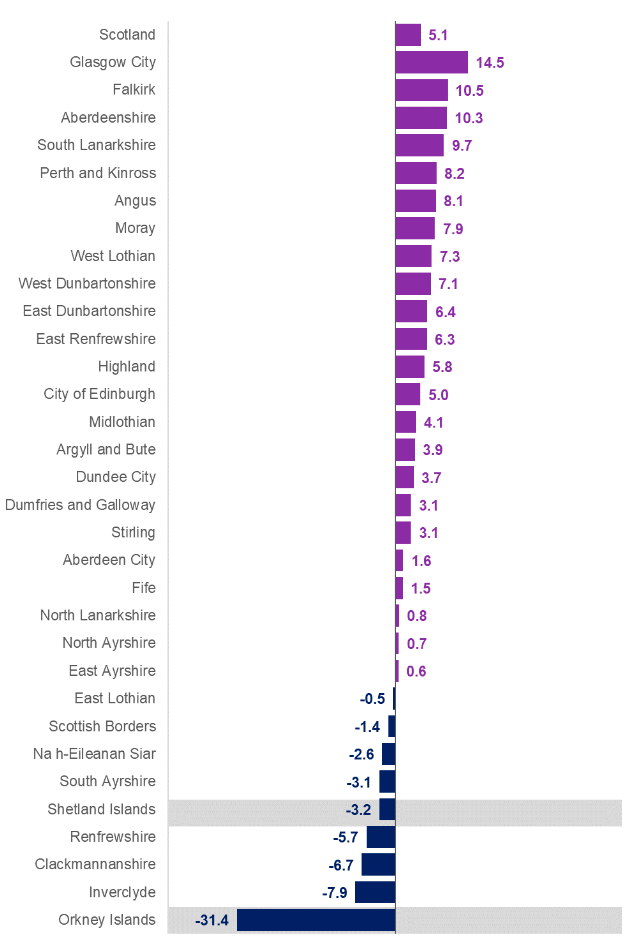
In 2021, men were estimated to have higher employment rates (16 to 64) than women in 23 local authorities. In the remaining 9 local authority areas, women had higher rates than men.
The largest gap in favour of men was seen in Glasgow City (14.5 percentage points). Whereas the largest gap in favour of women was seen in Orkney Islands (31.4 percentage points). Although the estimates for Orkney Islands are based on small sample sizes which may be less precise and should be used with caution.
Source: Annual Population Survey, January to December 2021, ONS
Note: A shaded background indicates estimates are based on a small sample size. This may result in less precise estimates, which should be used with caution.
Unemployment
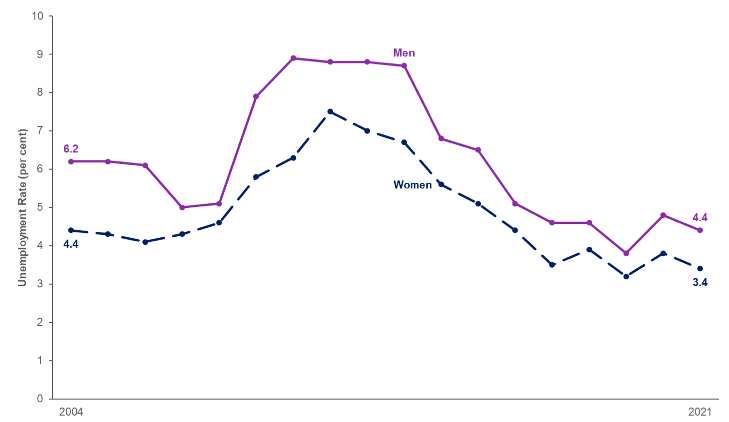
In Scotland, the unemployment rate (aged 16 and over) for men was 4.4 per cent and 3.4 per cent for women. Over the year, the unemployment rate had decreased by 0.4 percentage points (pp) for both men and women.
Despite this decline, the unemployment rate for women had increased by 0.2 pp from 3.2 per cent in 2019 to 3.4 per cent in 2021. The unemployment rate for men had increased from 3.8 per cent to 4.4 per cent (an increase of 0.6 pp) over the same period.
Source: Annual Population Survey, January to December datasets, ONS
Duration of unemployment
In 2021, 33,400 (31.6 per cent of all unemployed people) were unemployed for 12 months or more (long-term unemployment). This is 5,100 more than in 2019 (28,300 people). A higher proportion of unemployed men were long-term unemployed (38.3 per cent) compared to women (22.4 per cent). Men account for around seven in ten of all long-term unemployed.
Economic Inactivity
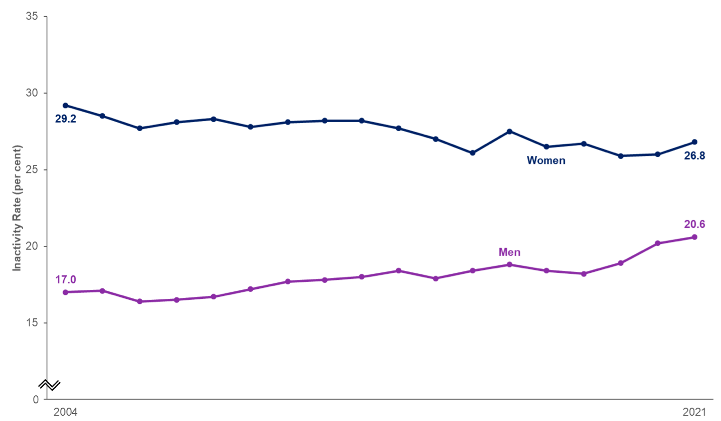
Inactivity rates are higher for women (16 to 64 years) at 26.8 per cent compared with 20.6 per cent for men. Overall women account for around three in five (57.7 per cent) economically inactive people.
The inactivity rate has increased for men and women in Scotland since 2019. The inactivity rate for women increased by 0.9 percentage points (pp), from 25.9 per cent in 2019 to 26.8 per cent 2021. Over the same period, the inactivity rate for men increased by 1.7 pp from 18.9 per cent to 20.6 per cent. The increase in the inactivity rate for men between 2019 and 2021 was statistically significant.
Source: Annual Population Survey, January to December datasets, ONS
Reasons for inactivity
Reasons for inactivity differ by sex. Looking after family and/or home accounted for 22.6 per cent of inactive women in 2021. Whereas, only 7.9 per cent of inactive men state this as their reason for inactivity.
One in three (33.5 per cent) inactive men stated their reason for inactivity as long-term sick. Whereas, 26.8 per cent of inactive women stated this as their reason for inactivity. In 2021, long-term sick was the main reason for being inactive for both men and women.
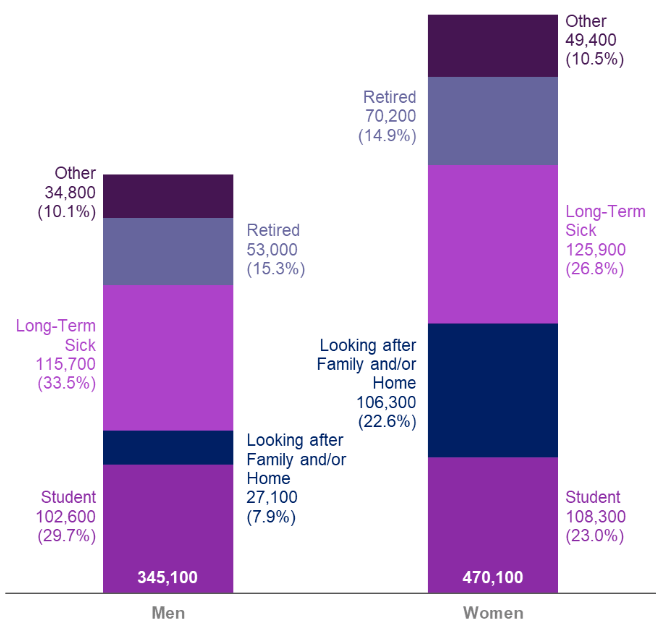
Source: Annual Population Survey, January to December 2021, ONS
Note: Discouraged and Temporary Sick are not shown in this chart due to sample size. However, they are included in the total inactivity levels for men and women.
Want to work
Since 2019, the proportion of men and women who are economically inactive and would like to work has decreased. The decrease for men was 3.5 percentage points (pp) and 2.5 pp for women. Both decreases are statistically significant. The proportion for men (18.1 per cent) has decreased to a proportion similar to that of women (17.1 per cent). The proportion of woman who are economically inactive and would like to work has been lower than the proportion of inactive men across the calendar series.
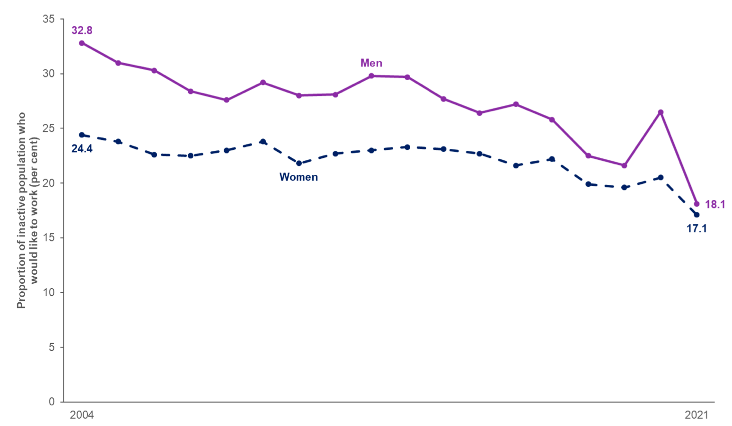
Source: Annual Population Survey, January to December datasets, ONS
Contact
Email: lmstats@gov.scot