Scotland's Labour Market: People, Places and Regions – Protected Characteristics. Statistics from the Annual Population Survey 2021
Summary publication of results from the ONS Annual Population Survey January to December 2021, presenting analysis on the labour market by protected characteristics including age, sex, disability and ethnicity.
Part of
Overview
In terms of labour market statistics, people can be classed as either economically active or inactive. An economically active person is either employed or unemployed. An economically inactive person is not actively seeking employment. They can be inactive for a number of reasons including being a student or retired.
Employment
Who is classed as being in employment?
Employment measures the number of people who did at least one hour of paid work or had a job they were temporarily away from. The number of people in employment consists of those aged 16 years and over. The employment rate is the proportion of people aged between 16 and 64 years who are in employment.
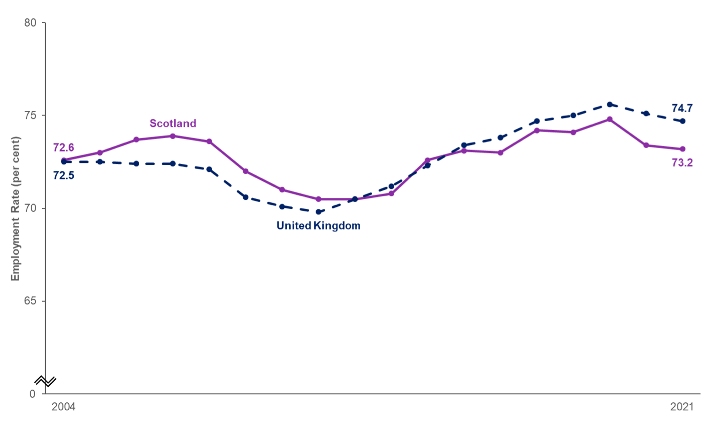
The estimated employment level and rate has decreased since 2019 (pre-pandemic) for Scotland and United Kingdom. In 2021, the estimated employment rate (16 to 64 years) in Scotland was 73.2 per cent. This is lower than the United Kingdom rate of 74.7 per cent.
The employment rate for Scotland decreased from 74.8 per cent in 2019 to 73.2 per cent in 2021. While the United Kingdom employment rate decreased from 75.6 per cent to 74.7 per cent over the same period. Both the change in Scotland and the United Kingdom are statistically significant.
Source: Annual Population Survey, January to December datasets, ONS
Local Authority area estimates
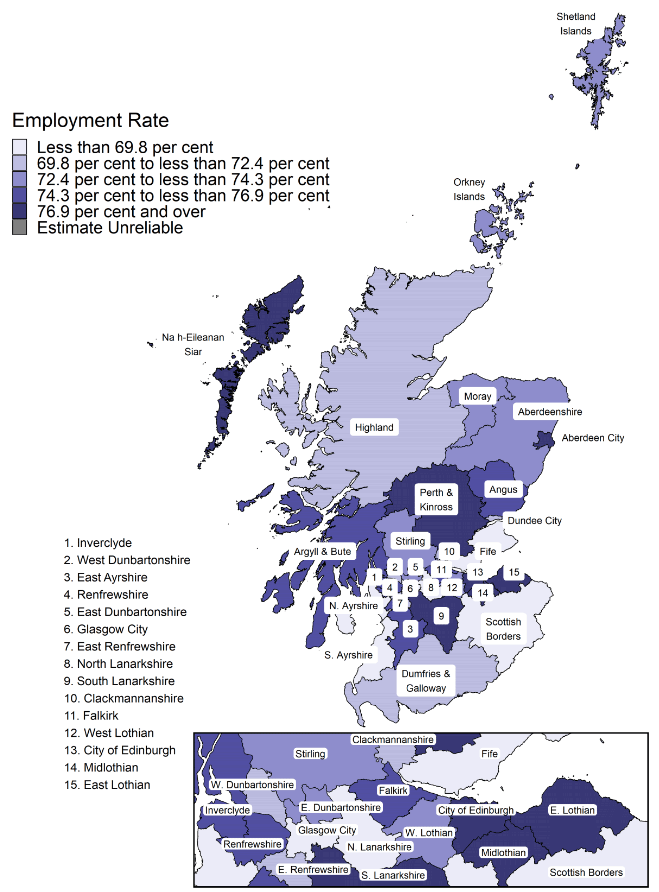
There are long-standing variations in employment rate estimates for those aged 16 to 64 across Scotland's local authorities.
In 2021, the highest employment rate estimates were seen in:
- Midlothian (80.9 per cent)
- Na h-Eileanan Siar (80.5 per cent)
- East Lothian (79.5 per cent)
The lowest employment rate estimates were seen in:
- North Ayrshire (64.7 per cent)
- Scottish Borders and South Ayrshire (both 68.3 per cent)
- Fife (68.4 per cent)
Source: Annual Population Survey, January to December 2021, ONS
© Crown copyright and database right 2022. All rights reserved. Ordnance Survey Licence number 100024655.
Unemployment
Who is classed as unemployed under the ILO definition?
Unemployed people are 16 years and over:
- without a job, have been actively seeking work in the past four weeks and are available to start work in the next fortnight
or
- out of work, have accepted a job and are waiting to start it in the next two weeks
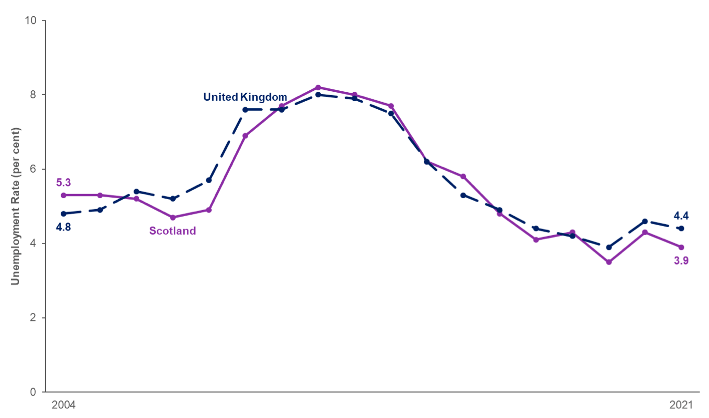
The unemployment rate in Scotland in 2021 was 3.9 per cent, below the United Kingdom rate of 4.4 per cent. Over the year, the rate had decreased in Scotland and the United Kingdom. However, both were still above the 2019 (pre-pandemic) rates of 3.5 per cent and 3.9 per cent respectively. There were 105,700 people aged 16 and over who were unemployed in Scotland, an increase of 9,900 since 2019.
The peak unemployment rate for Scotland, following the 2008 recession, was in 2011. At this time, the unemployment rate was 8.2 per cent with 221,300 people aged 16 and over unemployed. Since then, Scotland's unemployment rate has significantly decreased.
Source: Annual Population Survey, January to December datasets, ONS
Local Authority area estimates
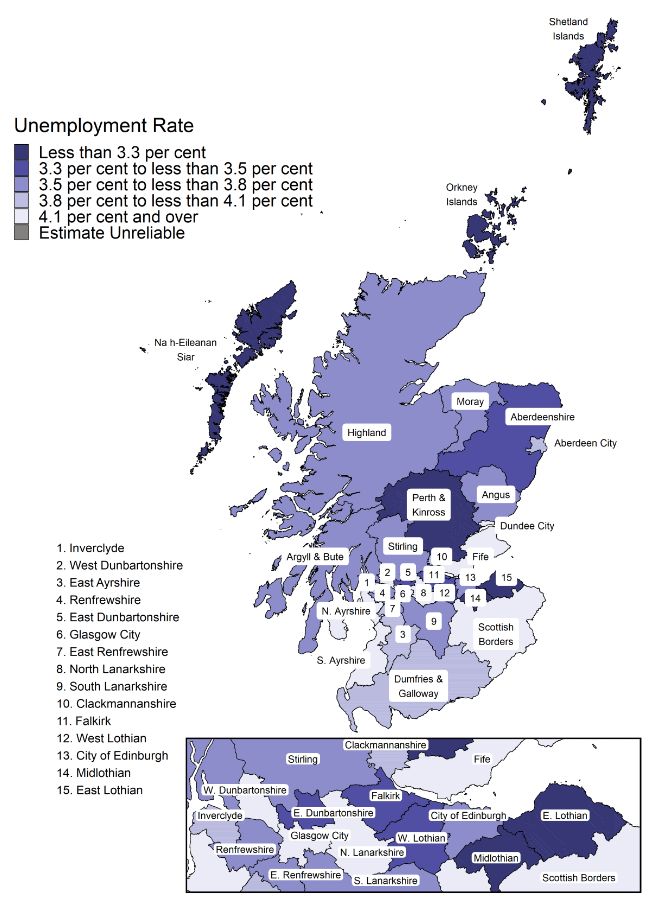
Sample sizes for the unemployed cohort are small compared to the employed and inactive cohorts. Consequently, unemployment estimates for local authority areas can have large sampling variations. To improve the quality of estimates for local authorities, the Office for National Statistics developed model based estimates.
The highest model based unemployment rates were seen in:
- Glasgow City (5.3 per cent)
- Dundee City (5.0 per cent)
- North Ayrshire (4.9 per cent)
The lowest rates were seen in:
- Shetland Islands (2.5 per cent)
- Midlothian (2.9 per cent)
- East Lothian and Na h-Eileanan Siar (both 3.0 per cent)
Model based unemployment rates have decreased in eight of Scotland's 32 local authority areas since 2019. Rates have remained the same in two local authority areas, and increased in the remaining 22 local authority areas.
Source: Annual Population Survey, January to December 2021, Claimant Count, ONS
© Crown copyright and database right 2022. All rights reserved. Ordnance Survey Licence number 100024655.
Duration of Unemployment
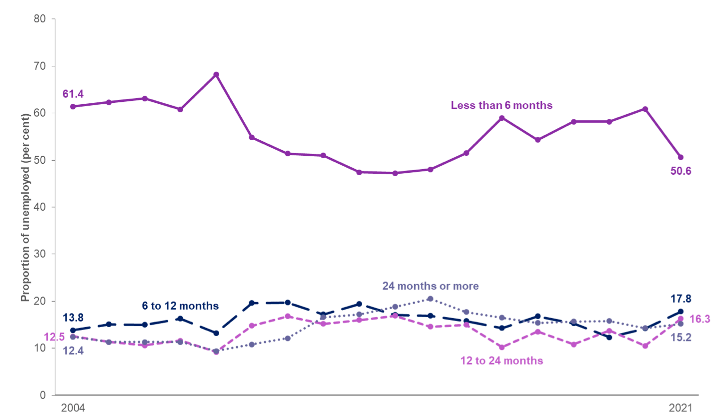
Of the 105,700 unemployed people in Scotland in 2021, 53,500 (50.6 per cent) were unemployed for less than six months (short-term unemployment). This proportion is lower than in 2019 when 58.2 per cent were unemployed for less than six months. This is a statistically significant change.
The remaining proportion is fairly evenly split between people unemployed for:
- 6 to 12 months (17.8 per cent)
- 12 to 24 months (16.3 per cent)
- 24 months or more (15.2 per cent)
Source: Annual Population Survey, January to December datasets, ONS
In 2021, 33,400 (31.6 per cent of all unemployed people in Scotland) were unemployed for one year or more (long-term unemployment). This is 5,100 more than in 2019 (28,300 people). The proportion of unemployed people in long-term unemployment was last as high in 2015.
Economic Inactivity
Who is classed as economically inactive?
People aged 16 to 64 who are neither employed nor unemployed under ILO definitions. There are many reasons why people may be inactive, including:
- they may have a long-term illness or disability
- be studying for a qualification
- staying at home to look after their family
- have retired
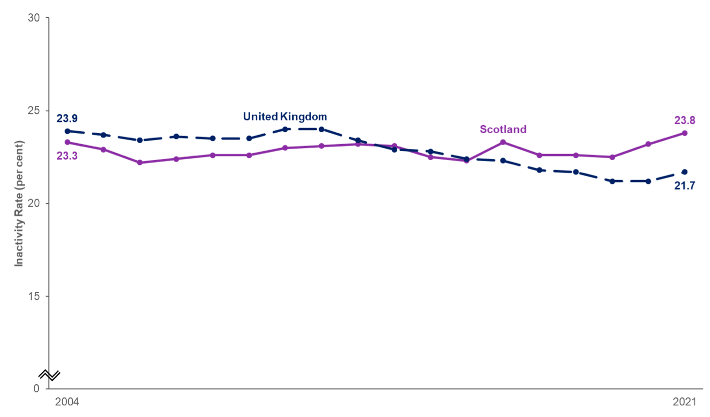
Scotland's inactivity rate in 2021 was above the rate for the United Kingdom. The inactivity rate for those aged 16 to 64 in Scotland was 23.8 per cent. The rate in the United Kingdom was 21.7 per cent.
Since 2019 (pre-pandemic), the inactivity rate has increased in Scotland by 1.3 percentage points. This is a statistically significant change. Scotland's inactivity rate is now higher than in any other calendar year period since the series began in 2004. The estimate of 815,200 people in 2021 is also the largest level in the calendar series.
Source: Annual Population Survey, January to December datasets, ONS
Local Authority area estimates
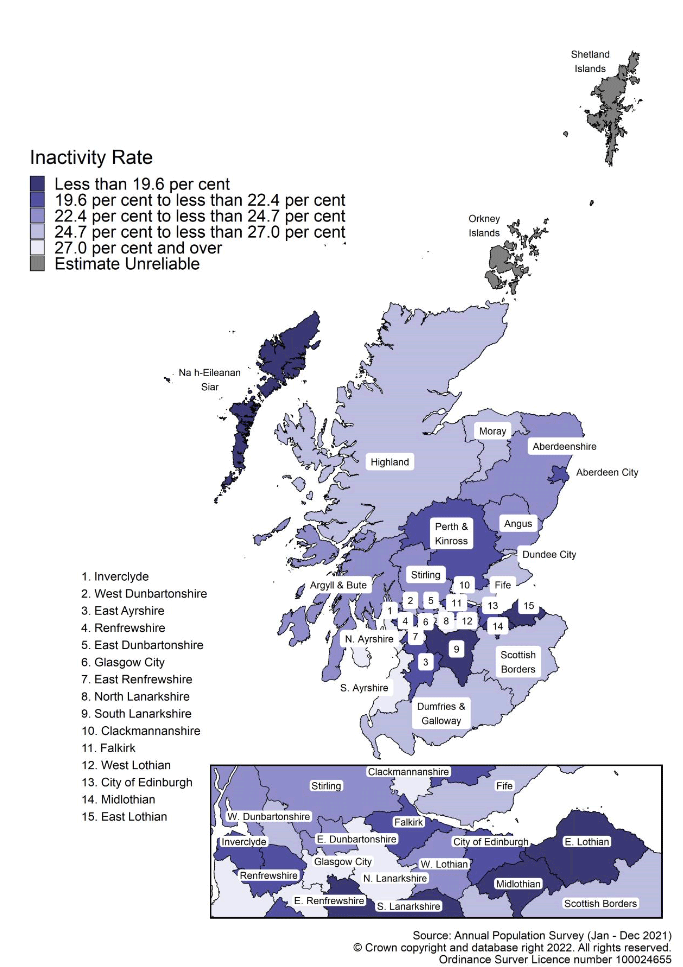
There is considerable variation in inactivity rates across Scotland's local authorities. Estimates for Orkney Islands and Shetland Islands are considered unreliable. Thus, they are not included in the analysis of inactivity rates by local authority area.
In 2021, the highest economic inactivity rates were seen in:
- North Ayrshire (30.4 per cent)
- North Lanarkshire (28.9 per cent)
- East Renfrewshire (27.6 per cent)
The lowest rates were seen in:
- Midlothian (17.3 per cent)
- East Lothian (17.4 per cent)
- Na h-Eileanan Siar (17.6 per cent)
Source: Annual Population Survey, January to December 2021, ONS
© Crown copyright and database right 2022. All rights reserved. Ordnance Survey Licence number 100024655.
Reason for Inactivity
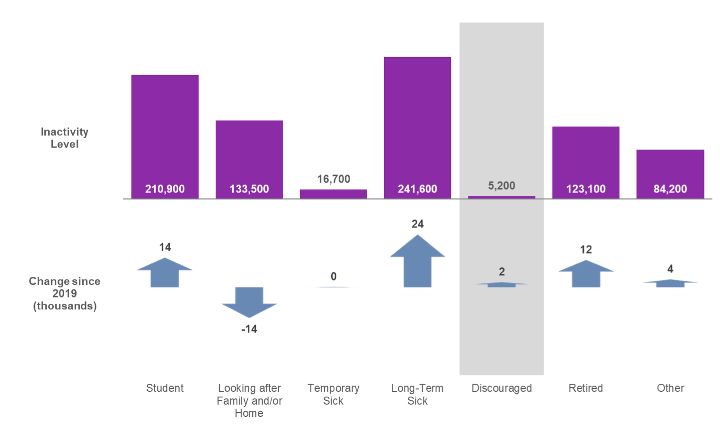
Of the 815,200 economically inactive people (aged 16 to 64) in 2021, the majority were long-term sick (241,600, 29.6 per cent) or students (210,900, 25.9 per cent).
A quarter (25.2 per cent) of all inactive people were in full time education, the majority of whom were aged 16 to 24.
Increases in inactivity levels since 2019 have been driven by increases in the number of:
- long-term sick (increasing 24,100, 1.5 percentage points)
- students (increasing 13,500, 0.3 percentage points)
- retired people (increasing 12,400, 0.8 percentage points)
A decrease of 13,900 (2.7 percentage points) was seen in the number of inactive looking after family and/or home.
Source: Annual Population Survey, January to December 2019 and 2021 datasets, ONS
Note: A shaded background indicates estimates are based on a small sample size. This may result in less precise estimates, which should be used with caution.
Want to work
Of those inactive aged 16 to 64 in Scotland in 2021, 142,900 people would like to work. This is 17.5 per cent of the inactive population. This proportion has decreased significantly since 2019 when the proportion was 20.4 per cent and there were 157,800 people who would like to work. The level and proportion in 2021 are the lowest estimates in the calendar series.
Contact
Email: lmstats@gov.scot