Measuring biodiversity: research into approaches
This report considers methodologies for measuring biodiversity at site-level for use in Scotland.
Results: Review of Biodiversity Metric 3.1
Introduction
Biodiversity Net Gain (BNG) targets biodiversity decline by ensuring that developments, or changes to land management, contribute positively to nature recovery. BNG has brought biodiversity to the forefront of planning for developments, driving a change in perception. In England, BNG is quantified and legalised under the 2021 Environment Act which stipulates that from November 2023 a mandatory 10% BNG must be achieved for new developments. To assist developers and planners deliver BNG, Natural England have developed various iterations of Biodiversity Metric - a tool which quantifies biodiversity pre- and post-development to calculate BNG. The tool relies on a competent person to assess the extent, condition and distinctiveness of current habitats, whilst maintaining a transparent user-friendly interface. The interface allows developers and planners to explore different different scenarios, and in doing so drives innovation in meeting BNG.
This section provides an overview of Biodiversity Metric 3.1 outlining its history, key components and describing how it quantifies biodiversity, and calculates BNG both on and offsite. The following section assesses the applicability of Biodiversity Metric 3.1 for use in Scotland. It explores the fitness of the metric's components to the Scottish context, and suitability to different sectors (i.e. Planning and Development, Natural Capital, Biodiversity and Conservation and Agriculture).
Biodiversity Metric 3.1- Purpose and History
The Biodiversity Metric was first developed by the UK Government's Department of Environment, Food and Rural Affairs (Defra) in 2012 to provide a standardised approach to quantify the impact of development on biodiversity in England (Defra, 2012). Following this, further iterations were undertaken by Natural England who released Biodiversity Metric 2.0 in 2019, with Biodiversity Metric 3.0 and 3.1 following in 2021 and 2022. Biodiversity Metric 4.0 was published in March 2023, after the analysis for this study was undertaken.
Each new metric has built upon the previous version, through consultation with practitioners and biodiversity experts to ensure the metric provides scientifically robust results applicable to the end user. The Metric will continue to be refined based on consultation and emerging research, and Defra has a long-term strategy to refine and adapt the Metric.
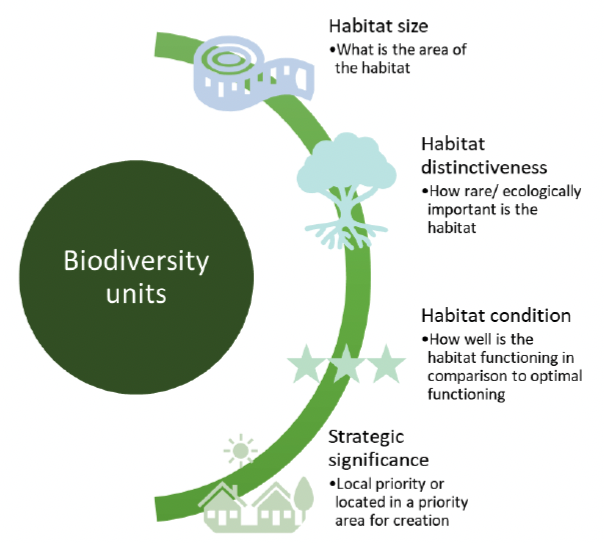
This report assesses the Natural England Biodiversity Metric 3.1 which is an Excel based tool that is accessible, free and easy to use. It provides a standardised means of robustly accounting for biodiversity change (both positive and negative) due to actions on the ground such as development, or management change. Metric 3.1 does not provide an direct absolute measure of biodiversity but instead uses habitat area, distinctiveness, condition and strategic significance as a proxy for biodiversity (Figure 5). Metric 3.1 uses Biodiversity Units as a currency and identifies three different types of units: hedgerows, rivers and area-based habitats. From an auditing and accounting perspective, 10% BNG must be achieved in all three habitat units.
Metric 3.1 combines ecological surveys to assess the type, extent and condition of habitats with predetermined values for habitat distinctiveness and strategic significance. The metric uses a set of predefined rules to calculate the biodiversity uplift of a planned development and enables the exploration of different scenarios to assist with decision making. To calculate BNG, the metric quantifies biodiversity pre- and post-development and uses previously assigned multipliers to take into account the risks associated with creating and enhancing specific habitats.
Small Sites Metric
To ease the administrative burden of BNG calculations in small developments, Natural England released a simplified version of the metric, The Small Site Metric (SSM) 3.0 in 2021, SSM 3.1 followed in 2022, with the most recent iteration SSM 4.0 published on 27th March 2023[7]. The SSM applies to developments meeting the following criteria:
- Residential development:
- fewer than 10 residential units on a site area less than 1 hectare; or
- the site area is less than 0.5 hectares if the number of residential units is unknown
- Non-residential development:
- where the floor space to be created is less than 1,000 m2; or
- where the site area is less than 1 hectare
The SSM aims to help developers consider the impacts of a development on biodiversity. It differs from Metric 3.1 in having simplified habitat categories, habitat condition is assessed as moderate, and habitats of high distinctiveness cannot be included. The SSM is only used for estimating onsite impacts of biodiversity pre and post development. Developments that impact on habitats that or not included, have high distinctiveness habitats or require off site net gain must use the full Metric.
Biodiversity Metric 4.0
Biodiversity Metric 4.0 was published on 24th March 2023, after the completion of our review of Metric 3.1. It is therefore important to note that conclusions and recommendations drawn from this review are based on Metric 3.1. Reviewing key updates indicates that broad conclusions are likely to remain the same.
The majority of the changes of Metric 3.1 to Metric 4.0 are focused on providing an enhanced user experience and do not have a significant impact on the range of outputs generated. The most notable changes to the metric include the addition of new habitat types "Willow scrub", "Tall forbs", "Rural trees" and "Watercourse footprint". Additionally, "Vacant/derelict land/ bare ground" has been split into "Vacant or derelict land" and "Bare ground". Multiple habitats have had name changes including adding the Annex 1 code to more notable habitats. For example, previous "Tall herb communities" is now called "Tall herb communities (H6430)".
Another notable change was the review of the condition assessments conducted by Natural England. This brought changes to the following habitats condition assessments:
- Grassland – low distinctiveness
- Grassland – medium and higher distinctiveness
- Heathland
- Hedgerows
- Limestone pavement
- Line of trees
- Traditional orchards
- Ponds
- Urban
- Woodland
- Wood-pasture and parkland
Furthermore, in Metric 4.0 the spatial risk multiplier for offsite habitats now applies to any overall off-site net gains which makes it easier to achieve off-site gains in many scenarios. The tool to translate Phase 1 habitat categories to UK Hab has also been updated. Metric 4.0 also now requires users to specify details on irreplaceable habitats present on site and trading rules for rivers and hedgerows have been updated.
The Biodiversity Net Gain Approach
BNG: Rules and principles
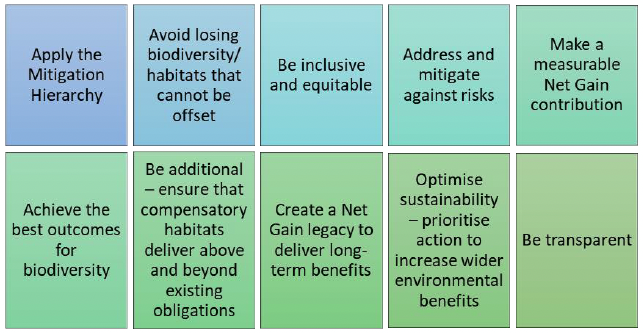
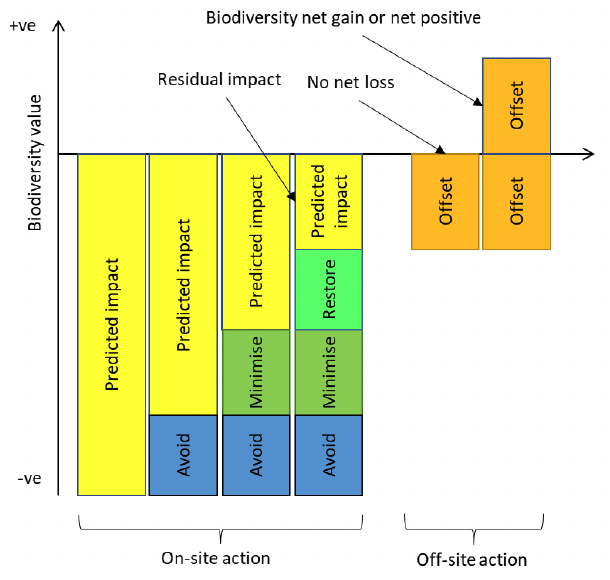
CIEEM, CIRIA and IEM have jointly developed 10 guiding principles to deliver BNG through development (CIEEM, CIRIA and IEMA 2016) (Figure 5). Fundamental to this is applying the Mitigation Hierarchy ensuring all stakeholders consider biodiversity from the outset, collaborating to limit adverse impacts (Figure 6). The Mitigation hierarchy firstly tries to avoid any adverse ecological impact (e.g. by avoiding sites with high biodiversity value), where loss cannot be avoided then measures should be taken to minimise loss (e.g. by changing the footprint of the development to avoid key habitats). In instances where some loss is inevitable, focus should firstly be on creating or enhancing habitats within the development footprint, and finally, as a last resort, through compensation offsite. Following this hierarchy ensures that best efforts have been made to avoid, limit or mitigate adverse impacts on biodiversity in any development. The BSI outline a framework for implementing BNG in British Standard BS 8683 - Process for designing and implementing Biodiversity Net Gain. This standard aims to encourage best practice, increase standardisation and reduce the risk of 'greenwashing'.
The Metric 3.1 is simply a calculation tool and should therefore be used in line with best practice and legislation and local and national policies. The accompanying Users Guide thus outlines a set of principles and rules (Panks et al. 2022; Annex 5 Biodiversity Metric 3.1). Metric 3.1 does not replace legislation and policies relating to statutory protected sites, irreplaceable habitats and protected species. Environmental Impact Assessments, Strategic Environmental Assessments, and Habitat Regulations Assessments still underpin planning and other consenting decisions.
The Metric outputs, decisions, and management actions should be considered in conjunction with legislation, best practice and professional advice. Decisions should consider wider physical and ecological factors (e.g. landscape composition and configuration, historical land use, and ecological constraints) and social factors to ensure that outcomes provide both biodiversity and societal benefits. While planners can use the metric to explore different scenarios, decision making should be underpinned by professional advice to optimise biodiversity outcomes. Furthermore, practical interventions should be developed through consultation with both ecologists and practitioners, to ensure that they are viable and realistic and long-term monitoring should be conducted to identify and rectify problems. If used correctly, the metric can help inform planning, and decision making to increase the biodiversity benefits achieved from developments and change in land use/management.
BNG: Irreplaceable habitats
In the UK, irreplaceable habitats (i.e. habitats of high biodiversity value which are very difficult and/or take an extremely long time to restore, recreate or replace) and species of conservation concern are protected by existing policy and legislation. There is some debate on what habitats are irreplaceable and Defra is currently formulating a definitive list. This is likely to include ancient woodland, ancient and veteran trees, blanket bog, raised bog and limestone pavements.
In the Planning and Development sector irreplaceable habitats are identified during the initial Ecological/Environmental Impact Assessment stage. BNG cannot be achieved if an irreplaceable habitat is to be adversely impacted and consequently they are considered independently requiring bespoke compensation in line with legislation. Similarly, Habitats that have high ecological value (i.e. Very High Distinctiveness habitats) also require bespoke compensation.
Because irreplaceable habitats require bespoke compensation, Metric 3.1 is not designed to deal with them (Panks et al. 2022). Very High Distinctiveness habitats and Irreplaceable habitats are only included in BNG calculations when these habitats are to be retained and/or enhanced. Irreplaceable habitats are typically categorised as Very High Distinctiveness in Metric 3.1. Ancient woodlands, by definition, include both ancient woodlands and plantations on previous ancient woodland sites and additionally vary in the dominant species. Ancient woodland and Veteran trees are therefore not included in Metric 3.1 as habitats/features in their own right. They are instead grouped with other Woodlands (High Distinctiveness) or in the case of Veteran trees within a Line of Trees (Ecologically valuable) (Medium Distinctiveness). Ancient woodland is currently protected by existing policy and legislation, and therefore it is assumed that where present this would be identified, relevant protection implemented, and bespoke compensation put in place.
BNG: Long-term monitoring and additionality
The whole premise of BNG is that there is a measurable improvement in Biodiversity from a baseline scenario. For BNG to be realised, habitats created or enhanced must deliver what is proposed in the planning and development stage. Management plans, and agreements to adhere to these plans must therefore reflect a long-term (i.e. 30 years) commitment to safeguard and enhance the habitat. Long-term monitoring is therefore required to identify when habitats are not reaching their projected condition. Where problems arise, the management plan should be adapted to ensure positive outcomes for biodiversity.
When a project results in unavoidable damage, offsetting this loss through habitat creation or enhancement either on or offsite must demonstrate additionality. Additionality ensures that actions undertaken provide direct benefits to biodiversity that would not have occurred otherwise (i.e. without the offset). In designated sites (e.g. SSSI), there is a statutory obligation to maintain features in favourable condition and thus features in unfavourable condition must be enhanced in line with legislation relating to protected sites. When dealing with offsetting biodiversity loss in protected sites, it is therefore questionable if habitat enhancement actually provides additional benefits as arguably such actions should happen anyway. This makes it hard to comply with additionality in designated sites and offsetting on designated sites is typically not permitted in England (Defra 2022).
Additionality must also be considered when it comes to combining payments for the delivery of multiple ecosystems services, known as stacking. The approach taken in England indicates that where multiple payments (e.g. carbon and biodiversity) are being delivered on the same land parcel, that action to receive these payments must provide different or additional outcomes. With land being finite, and habitats providing a range of potential ecosystem services, multifunctionality should be optimised and consideration should be given as to how we can balance additionality with multifunctionality through stacking or ecosystem service uplifts.
Features of Biodiversity Metric 3.1
Metric 3.1: Trading rules
Metric 3.1 adheres to a strict set of trading rules based on the distinctiveness of habitats. These rules stipulate that any habitat lost due to development must be replaced on a like-for-like or like-for-better basis, i.e. you can't trade down (Table 8). This is implemented to prevent priority habitats for nature conservation with Very High distinctiveness being replaced by habitats of lower distinctiveness. Further rules are implemented for woodland habitats to encourage woodland habitats of lower distinctiveness to be replaced by woodlands of higher distinctiveness. This is in line with Defra and Forestry Commission targets to increase in woodland cover in England.
| Baseline habitat distinctiveness |
Distinctiveness of replacement habitat required by trading rules (applies to creation and enhancement) |
|---|---|
| Very high |
Losses are not permitted and bespoke compensation is required |
| High |
The same habitat type must be created or enhanced to replace the biodiversity units |
| Medium |
The same broad habitat type or a habitat from a higher distinctiveness band must be created or enhanced to replace biodiversity units |
| Low |
Habitat from the same distinctiveness or higher must be created or enhanced to replaced biodiversity units |
| Very low |
Replacement not required |
Metric 3.1: Calculating Biodiversity Net Gain
The Metric 3.1 Calculation Tool is a downloadable interactive excel spreadsheet which is accompanied by supplementary documents to inform and aid use. Supplementary documents include: a condition assessment spreadsheet outlining criteria for on the ground assessments; a technical supplement; a GIS Import tool and supplementary guidance on this; a user guide that outlines strict rules and principles of use; a document detailing the summary of changes from the last version; a document containing frequently asked questions; QGIS templates; and multiple case studies.
To reflect the ecological importance of linear features, Metric 3.1 treats linear features separately from area-based habitats. Metric 3.1 identifies three broad categories of biodiversity units and 10% BNG must be achieved for each of these units separately, specifically:
- Habitats units: area-based habitats (e.g. blanket bogs, lowland heathlands)
- Hedgerow units: linear woody features (i.e. hedgerows, line of trees)
- River units: linear water features (e.g. rivers, ditches, canals)
For each of these three habitat units, the Calculation Tool contains multiple interactive spreadsheets to calculate the biodiversity units for:
- On-site baseline
- Off-site baseline
- On-site post development (separate sheets for Habitat creation and Habitat enhancement)
- Off-site post development (separate sheets for Habitat creation and Habitat enhancement)
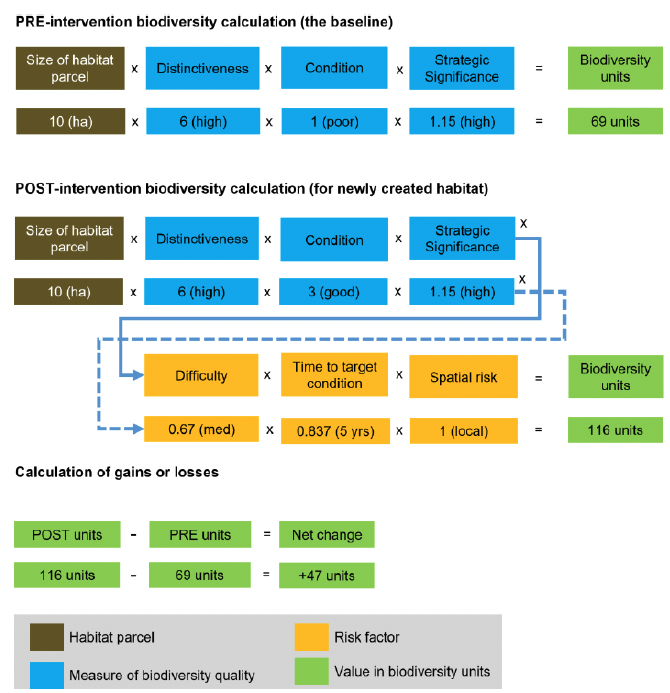
Using habitat as a proxy for biodiversity, the number of Biodiversity units is calculated for each habitat parcel for a specific project or development. Metric 3.1 calculates biodiversity impacts by subtracting baseline (pre-intervention) biodiversity units from projected biodiversity units following development or land use change (post-development) (Figure 7). This allows developers and planners to quantitatively predict changes in baselines and explore different options to deliver BNG.
Metric 3.1 calculates Biodiversity units for each habitat parcel by integrating information derived on the ground (i.e. type, area and condition of habitat) with predetermined multipliers (i.e. distinctiveness, strategic significance, and risk multipliers for habitat creation and enhancement) (Figure 5; Table 8). Baseline units are determined pre-intervention on and, where applicable, off-site for each habitat parcel by multiplying area, condition, strategic significance, and habitat distinctiveness. Post-intervention units are determined in the same way but in this case risk multipliers are applied to consider risks associated with establishing new habitats and enhancing the condition of existing habitats. Each habitat is automatically assigned a score based on how difficult it is to create or enhance (technical risk) and the perceived time it will take to achieve the target condition (temporal risk). Finally, where BNG involves offsite action, a spatial risk multiplier is imposed based on the proximity to the intervention site.
| Factor |
Description |
Information derived from |
|---|---|---|
| Area/length |
Area of each independent parcel of habitat/length of linear feature |
Derived at site level |
| Condition |
Measure of habitat quality – quantifies differences in condition with a habitat type |
Typically based on an ecological survey* |
| Distinctiveness |
Measure of a habitats inherent potential to deliver biodiversity |
Predetermined value based on habitat type |
| Strategic significance |
Measure of strategic significance of a habitat with respect to local strategies/ ecological knowledge |
Derived at the site level |
| Technical difficulty multipliers |
Multipliers relating to technical difficulties in physically creating or enhancing a habitat |
Predetermined value based on habitat type |
| Temporal |
Multipliers relating to the time it takes for a habitat to reach the desired condition |
Predetermined value based on habitat and condition |
| Spatial risk multipliers |
Multipliers relating to the location of offsite habitat creation or enhancement |
Derived at the site level |
*Some habitats have fixed values for habitat condition
Metric 3.1: Habitat classification
Metric 3.1 classifies habitats using a range of different classification systems, in addition to a few habitats that are stipulated by the Metric itself (Table 10). Most terrestrial habitats are based on the UK Habitat Classification System (UK Hab) and coastal/intertidal habitats are based on the European Nature Information System (EUNIS). Both these classification systems take, with more detailed habitat descriptions nested within broader descriptions. Hierarchical classification of habitats allows for surveys to be tailored to fit the scope, budget and/or objectives (e.g. remote sensing provides a more basic level of classification than a detailed ecological site survey).
Metric 3.1 classifies most terrestrial area-based habitats at UK Hab Level 4 (L4). This level aligns with UK BAP Priority Habitats, however, Level 5 is typically required to identify Annex 1 habitats (Butcher et al. 2020a). Consequently, the Technical Supplement provides a list of Annex 1 habitats included under each L4 habitat category (Panks et al. 2022). The inclusion of Annex 1 habitats in this list is however inconsistent, and guidance does not indicate why some habitats were excluded. This could in part be due to how Metric 3.1 deals with irreplaceable habitats and their requirement for bespoke compensation.
| Broad habitat |
Classification system |
Geographical relevance |
|---|---|---|
| Most terrestrial habitat |
UK Habitat Classification System (UK Hab) Level 4[8] |
UK wide |
| Lakes |
Water Framework Directives Lake Typologies UK [9] UK Hab |
European |
| Intertidal, coastal and shore habitats |
European Nature Information System (EUNIS) Level 3[10] |
European |
| Waterways |
UK Hab with Ditches/Culverts being Metric specific |
UK wide |
| Green roofs, Urban tree |
Metric specific |
UK wide |
| Hedgerows |
Metric specific: draws from the Hedgerow Survey Handbook [11] |
UK wide |
Metric 3.1: Habitat distinctiveness
Metric 3.1 accounts for habitat quality in two ways, firstly habitats are given a distinctiveness rating (Very High to Very Low) to capture inherent differences in their conservation value (i.e. to evaluate differences in quality between two different habitat types). In addition, the condition of each habitat is assessed on the ground by a competent person with skills in the identification of habitats and their positive and negative indicator species (i.e. to evaluate differences in quality between two patches of the same habitat, see Metric 3.1: Habitat condition).
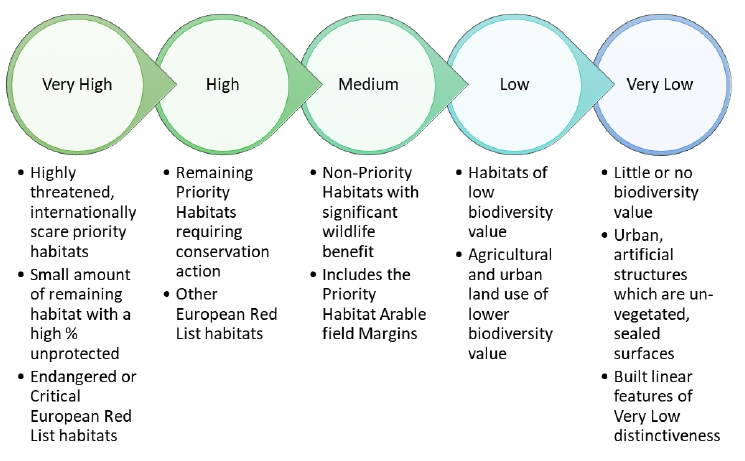
The distinctiveness rating in Metric 3.1 is based on habitat type, its conservation status, rarity at the English, UK and International level, and potential vulnerability, i.e. taking into account the amount of habitat protected in SSSIs (Figure 8). For terrestrial habitats, the following criteria is used to determine distinctiveness:
- Amount of priority habitat remaining in England[12]
- Percentage of habitat protected in SSSIs
- UK Priority habitat status[13]
- European Red List categories[14]
Intertidal/rocky shore habitats assess distinctiveness in a different way. Intertidal and rocky shore habitats on peat, clay or chalk are rated as Very High due to their unique substrate, lack of resilience and limited ability to recover from impacts. Most other natural intertidal and rocky shore habitats are given a rating of High due to their importance to nature conservation, and artificial intertidal tidal habitats, are given a Low rating (Panks et al. 2022). Artificial hard structures with Integrated Greening of Grey Infrastructure and Littoral coarse sediment and Littoral Sand are giving a rating of Medium.
The degradation of freshwater habitats is primarily due to a change in condition (e.g. a degradation in the abiotic and/or biotic quality) rather than a change in habitat extent. Lake typology is determined based on alkalinity and this can be determined from the UK lakes portal[15]. Once typology is determined distinctiveness is assessed as with terrestrial habitats. Priority Lakes and Rivers are spatially mapped in MAGIC's interactive map (see Priority Habitat Lakes, and Priority Habitat Ponds inventories)[16].
Distinctiveness categories for rivers and streams are based on priority river habitat classification. Priority rivers exhibit a high degree of naturalness and are spatially mapped with separate maps for headwaters[17] and Rivers[18]. All Priority rivers are given a Very High distinctiveness rating, and these include rivers of high hydromorphological/ecological status, chalk rivers, watercourses with water crowfoot assemblages (Annex 1 habitat H3260), active shingle rivers and headstream rivers. Other streams and rivers are given a High distinctiveness rating, while ditches and canals are classified as Medium distinctiveness and culverts are Low distinctiveness.
Metric 3.1: Habitat condition
Habitat condition provides the second means of assessing habitat quality. Habitat condition allows us to measure a habitat's current quality against its ecological optimum state, enabling us to quantify differences between the quality of different patches of the same habitat type. Condition strongly reflects current and past management. Condition assessments are used to baseline habitat quality before intervention both onsite and, where applicable, offsite. Condition assessments are conducted post-intervention for retained, enhanced and newly created habitats. This follow-up monitoring provides a means of identifying problems, and potential interventions that might enhance the biodiversity outcomes.
Metric 3.1 assesses condition on the ground based on a habitat's physical (e.g. vegetation structure) and biological attributes (e.g. the presence of positive and negative indicators). Condition assessments for rivers and streams must be undertaken by someone who is trained and accredited in the Modular River Survey (MoRPh) methodology. For all other habitats guidelines specify these must be done by a competent person who is able to "identify the positive and negative indicator species for the range of habitats likely to occur in a given geographic location at the time of year the survey is undertaken". There is no formal requirement for accreditation.
To standardise the approach to assess condition, Metric 3.1 outlines a set of criteria for broad habitat categories (e.g. Woodland, Scrub, Coastal, and Wetland). For terrestrial habitats, criteria are largely aligned with UK-wide standards developed for Site Condition Monitoring of Protected Sites outlined in JNCC's Common Standards Monitoring guidance[19]. With hedgerow criteria drawing from Defra's Hedgerow Survey Handbook (Defra 2007).
The criteria are simple statements relating to habitat quality which are answered with pass or fail, or in the case of intertidal and woodland habitats, a score of 1-3 is given. The resultant score reflects the number of passes, or in the case of woodlands and intertidal habitats provides a summed score. Based on this score, each habitat is assigned to Good, Moderate or Poor condition. Some habitats also have essential criteria which must be met for the habitat to be meet a specific condition.
Lake condition is assessed based on The Freshwater Biological Association's Habitat Naturalness Assessment[20] which assigns lakes to a Naturalness class based on physical, hydrological, biological and chemical attributes. Assessment of the lake considers the lake itself and the riparian zone. Links to the key documents for undertaking a Habitat Naturalness Assessment, together with a conversion table for scores, are provided within the Lake condition sheet.
Metric 3.1 assesses river condition using the MoRPh methodology which first classifies rivers into one of 13 geomorphic river types according to substrate, planform, and valley confinement (Gurnell et al. 2020). A field survey is then conducted following the Modular River Survey (MoRPh) which is targeted to determine the physical features of the river and its margins (including the vegetation structure) in addition to frequency and type of human modifications. The MoRPh methodology thus allows us to interpret the condition of the river obtained through physical assessment in the context of its geomorphic type (Gurnell et al. 2020). The Metric 3.1 does not simply count the waterbody, but also the riparian zone (distance 10 m from the top of the bank) and consequently developments that impinge on this zone must be included in River biodiversity unit calculations.
Condition assessments are not required for a small number of habitats which tend to be low or very low distinctiveness (e.g. Bramble scrub, Rhododendron scrub, Hedge ornamental non-native), or in Cropland habitats including cereal and horticultural crops, alongside a variety of arable field margins (Arable field margins pollen & nectar and Arable field margins tussocky). These habitats are automatically assigned a condition score of Poor.
Where habitats have been degraded it may not be feasible to accurately determine habitat quality (e.g. for example felled woodland). To prevent abuse (e.g. removal of habitats before ecological surveying), habitats degraded since 30 January 2020 are considered to be in their former state when determining on-site biodiversity units (Defra 2022). Aerial images or records can be used to determine recently degraded habitats and where condition assessments are not feasible, they should be considered to be in Good condition as a precaution.
Metric 3.1: Strategic significance
The strategic significance of a habitat relates to its importance with respect to being considered in local strategies and objectives. This multiplier assigns extra biodiversity value for habitats with strategic significance to the local area. Habitats of High Strategic significance are formally identified in local strategies (e.g. Local Nature Recovery Strategies, Local Biodiversity Plans, Green Infrastructure Strategies, River Basin Management Plans or Shoreline Management Plans). If a habitat is not mentioned in local strategy/objectives but professional judgement determines that it is ecologically desirable (e.g. creation of a woodland that would enhance connectivity between two semi-natural woodland blocks, habitats that are viewed by the community to be of biodiversity value) it is given a Medium score. Finally, a habitat is assigned to be of low strategic significance if it is not identified in local strategies nor deemed as ecologically desirable by professional judgement.
Metric 3.1: Accounting for risk
Many factors influence the risk associated with creating or enhancing a habitat to a desired condition. This includes site topography and hydrology, soil type, structure, pH and nutrient status, previous land use, neighboring habitats and species matrix, and climate. Additionally, implementation and management will be a key factor influencing the success of habitat creation or enhancement.
Metric 3.1 recognises that habitats differ with respect to these risks, and pre-assigns each habitat with multipliers that alter the biodiversity units of a habitat depending on the perceived risks to recreate or enhance that habitat. Standardisation provides transparency and consistency in calculating Biodiversity Units and reduces risk of abuse. Metric 3.1 identifies three risk factors: Technical difficulty in habitat creation or enhancement, time taken for a habitat to achieve its target condition, and spatial risk. The Metric accounts for differences in risk between creating new habitats and enhancing existing habitats (i.e. increasing condition or distinctiveness) by assigning each habitat with different risk multipliers for creation and enhancement. To incentivise habitat creation in advance, habitats that have already been created, and have reached their target condition e.g. through establishing a habitat bank, do not require risk multipliers.
It is worth noting that in post-intervention calculations, a habitat in good condition can in some instances yield lower biodiversity units than the same habitat in poor condition due to additional risks associated with achieving good condition (see Limitations of the Biodiversity Metric 3.1).
Technical difficulty multiplier
Habitats vary in the risks associated with restoration or enhancement due to both ecological and technical constraints and thus each habitat is assigned different multipliers based on available science and expert opinion. For example, a lowland fen is more difficult to recreate than upland heath as it strongly depends on the underlying hydrology. The multipliers result in a reduction in the biodiversity units generated for habitats perceived to be more technically difficult to enhance or create.
When pre-assigning technical difficulty multipliers the factors considered by experts included:
- Hydrological requirements
- Salinity regime
- Elevation and aspect
- Seed source or biological material requirements
- Future constraints (e.g. impacts of climate change)
- Low soil nutrient status
- Trophic status conditions
- Water quality needs
- Ongoing management requirements
Restoring existing semi-natural habitat is typically less risky than creating new habitat. Biodiversity Metric 3.1 therefore gives each habitat two scores based on the technical difficulty in creating the habitat and the technical difficulty in restoring the habitat with difficulty rating ranging from Very High to Low (Annex 5).
Spatial risk
In addition to Strategic Significance, when habitat creation or enhancement is delivered off-site spatial risk is also considered. As a guiding principle, prioritisation should be given to meet BNG within the footprint of the development (i.e. on-site) and where this cannot be achieved to ensure off-site compensation is as close to the development site as possible. Achieving this has both ecological and social benefits. Metric 3.1 therefore implements a Spatial risk multiplier that penalises off-site compensation that is more distant from the site of impact.
When compensation is achieved within the Local Planning Authority, the same National Character Area, the same Marine Plan Area or the same waterbody a multiplier of 1 is used. In England, the Local Planning Authority refers to the administrative area of the local government body exercising planning functions for a particular area. National Character Areas are natural subdivisions of England defined by Natural England. Marine Plan Areas consist of 11 subareas of the English inshore and offshore marine planning regions governed by the Marine Plan.
If compensation is achieved in a neighbouring Local Planning Authority, National Character Area/Marine Plan Area or within the same catchment a multiplier of 0.75 is applied. When compensation is achieved beyond neighbouring areas or outside of a catchment a multiplier of 0.5 is used.
Temporal multiplier
Once a habitat has been removed or damaged, there is a biodiversity deficit during the time it takes for the compensatory habitat to mature to its target condition. To account for this, a temporal multiplier is utilised by the Biodiversity Metric 3.1 – the time to target condition multiplier. This multiplier is based on the years between the intervention (removal/damage of habitat) to the point that the compensatory habitat reaches a predefined target condition.
This multiplier differs between habitat types and depends on whether a habitat is being created or enhanced, and to what condition the habitat is being created/enhanced to (i.e. the creation of a habitat in good condition will take longer than the creation of poor condition). Each habitat is set at a pre-determined value based on the average time taken to achieve desired outcomes. These pre-determined values are based upon expert opinion relating to each habitat under average environmental conditions in England. Additionally, a de-multiplier is applied based on discount rates for the delay in delivered goods such as habitat creation.
Where habitat is created in advance and is progressing towards its target condition, the tool adjusts the temporal multiplier to reflect this lower risk in successful delivery. Whereas if a delay in the creation/enhancement of compensatory units is anticipated, leaving a larger gap of time between the removal of habitat and the creation of new habitat, then the number of years to reach target condition is extended, lowering the multiplier and hence the resultant biodiversity units.
Limitations of the Biodiversity Metric 3.1
Landscape context
While Metric 3.1 is underpinned by expert opinion and ecological evidence, it must be noted that it adopts a relatively simplistic and broad-brush approach to calculating BNG. It uses habitat as a proxy for biodiversity and does not consider landscape structure. Landscape structure underpins ecosystem processes, and the loss of habitat heterogeneity is identified as a key driver of biodiversity decline (Benton et al. 2003). Metric 3.1 fails to capture the intricacies and complexities of ecosystems, how they function, and the interaction between habitats and species within an ecosystem.
Ecological connectivity facilitates species movement between habitat patches to meet resource requirements, to breed (increasing genetic diversity) and to respond to environmental change – consequently connectivity results in more resilient populations and ecosystems (Lawton et al., 2010). Ecological connectivity is not currently accounted for in Metric 3.1. The closest thing resembling this is the strategic significance multiplier which allows assessors to indicate that a 'Location is ecological desirable but not in local strategy'. Natural England's Biodiversity Metric 2.0, factored in ecological connectivity for habitats with High and Very High distinctiveness. This was supported by a supplementary ecological connectivity tool which drew from a national dataset of UK BAP Priority Habitats. The tool was removed from Metric 3.0 on account of "the connectivity tool was not often used, and the approach did not work for all habitats"[21]. Along with the tool, the drop-down multiplier for connectivity was removed from the excel based calculator.
Translating from Phase 1 to UK Hab
To assist ecologists more familiar with applying the Phase 1 Habitat Classification system, Metric 3.1 has an option to input habitats using Phase 1. A correspondence table then translates these to UK Hab. The translation is very simplistic typically making single links between Phase 1 and UK Hab classification and in some instances translations are inappropriate - for example Phase 1 Bare Peat translates to UK Hab Annex 1 habitat Depressions on Peat substrates (H7150). Similarly, Phase 1 Wet modified bog translates to the Annex 1 habitat Transition mires and quaking bogs (H7140). Such translations will give erroneous estimations of biodiversity units.
Lack of consideration of pests/pathogens in terrestrial assessments
When it comes to assessing the condition of terrestrial habitats, only Woodland habitats (i.e. Line of Trees, Woodlands and Wood-Pastures and Parkland) consider pests and pathogens. Other habitats can also be severely degraded by pests and pathogens, for example heather moorland can be decimated by heather beetle. With climate change increasing the risk of newly emerging pests and pathogens impacting on (semi)-natural ecosystems (Sattaret al., 2021), including pest and pathogens within the condition assessment criteria would improve the metrics performance.
Risk multipliers generating perverse results
Metric 3.1 risk multipliers are largely considered as separate entities, in isolation from each other, and sometimes when these multipliers are all applied the resultant biodiversity units are inappropriate. For example, when creating new habitats, temporal multipliers can in some instances result in higher biodiversity units for habitats with a poorer target condition. This can be seen for woodlands which take a long time to achieve good condition. For example, Other woodland; broadleaved with a target condition of Fairly Poor (7 years to target condition) resulted in higher biodiversity units than the same habitat with a target condition of Good (30+ years to target). Similarly, the technical difficulty multipliers can result in habitats of higher distinctiveness (i.e. Lowland mixed deciduous woodland) yielding lower biodiversity units than less distinctive habitats (i.e. Other woodland; broadleaved). See Annex 5 for calculations. There is a need to consider how risk multipliers are integrated to ensure that outputs incentivise the creation high quality habitats.
Habitat enhancement verses creation
Risk multipliers for creating new habitats are higher than those for enhancing existing habitats to reflect the greater ease of enhancement. Metric 3.1, permits the enhancement of a habitat into a different broad habitat type as long as professional justification is provided in the "Assessor comments" and that enhancement results in a habitat of the same, or higher, distinctiveness. With habitat enhancement and creation having very different risk multipliers, a much higher number of biodiversity units can be obtained when enhancing a habitat than creating it. For example, enhancing a site where a coniferous plantation (i.e. Other coniferous woodland - low distinctiveness - poor condition) is felled and the blanket bog restored (i.e. Wetland – Blanket Bog -Very High distinctiveness - good condition) would result in the net gain of +4.97 habitat units. Whereas if this process was calculated as the removal of coniferous woodland (-2 habitat units) and the creation of blanket bog (+0.88), the net outcome would be -1.12 habitat units. See Annex 5 for calculations.
Current guidelines outline that enhancement is applicable when you are improving the condition of an existing habitat, changing distinctiveness of a habitat within a broad habitat type or restoring a remnant high value habitat where there are sufficient habitat remnants apparent on site (e.g. calcareous grassland encroached by scrub). Currently in the later situation there is a need for professional justification, which must then be approved by the determining authority. This is open to interpretation both by the personnel completing the metric calculations and the determining authority. When considering enhancement from one broad habitat type to another, additional guidance outlining appropriate habitat change and restorative actions would help to ensure standardisation and prevent abuse.
Accounting for non-habitat interventions
Metric 3.1 focusses on habitat-based interventions, and therefore fails to take into account the biodiversity benefits of non-habitat based interventions. For example, the installation of bat boxes or providing artificial nesting sites for owls could clearly enhance the potential for a woodland to provide for these species. Including such interventions within in condition assessments, or expanding condition criteria to include a wider range of species indicators, would incentivise a broader range of restoration techniques. The Conservation Evidence website could be reviewed to identify the most promising non-habitat interventions.
Contact
Email: katherine.pollard@gov.scot