Measuring biodiversity: research into approaches
This report considers methodologies for measuring biodiversity at site-level for use in Scotland.
Annex 1: Assessment criteria
EU Business @Biodiversity metric assessment criteria
This annex summarises the tools and approach assessment criteria identified in the Biodiversity Measurement Navigation Wheel for Business v2.0 (Lammerant et al., 2022)1. The criteria are typically descriptive rather than intended to form the basis of a comparison on critical assessment. However, they can be used as the basis for developing criteria for assessing a biodiversity assessment tool or metric for Scotland. The approach is focused on business use, so requires further expansion to reflect policy and other end-users. Conversely, the scope of business uses (from products, site, to company and global impacts) may be broader than that required for a Scottish metric. Similarly, the approach has also been applied to ecosystem services tools which go beyond the scope of the current project.
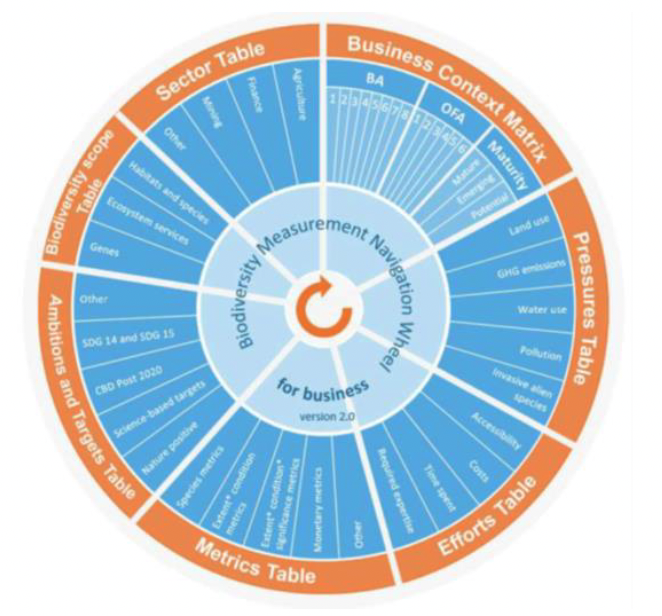
Business context matrix
Combines business applications and organisational focus areas with maturity level
Business application table
Entries with an * reflect applications relevant to a Scottish metric
BA 1: Assessment of current biodiversity performance*
This is a very common business application. A company might do this just to demonstrate that it's doing well in terms of biodiversity performance, or simply to know its current level of performance. It could be part of BA 3 (tracking progress to targets), 4 (comparing options) or 7 (assessing risks and/or opportunities).
BA 2: Assessment of future biodiversity performance*
A company might be interested in assessing future biodiversity performance as a result of, for instance positive impact actions (e.g. restoration actions and/or actions that reduce pressures on biodiversity) or changes in its activities.
BA 3: Tracking progress to targets*
Companies that have set targets on biodiversity performance will need to track progress periodically. There are many categories of targets (see Biodiversity Ambitions Table in section 2.3.3).
BA 4: Comparing options
A company might want to compare the impact of different options on biodiversity. Although the focus of the biodiversity measurement tools is on measuring biodiversity impacts, any decisions will also rely on economic considerations. While some tools have explicitly integrated an economic indicator, other tools provide useful input for an internal cost benefit analysis. This BA can inform different levels of decision. Some examples of this BA:
- Which site offers least harm to biodiversity values?
- Which mitigation measures offer best result in terms of both ecological and economic terms?
- Which product scores best considering both biodiversity performance and economic return?
- Which investments in biodiversity conservation or restoration score offer the best value for money?
- Which supply chains are riskier from a biodiversity point of view?
- Which companies within a sector are performing best (according to rating agencies)?
- Which sectors are performing best in terms of biodiversity (for investment decisions by FIs)?
BA 5: Assessment / rating of biodiversity performance by third parties, using external data*
Third party assessment based on biodiversity criteria and fed with external data (into the absence of company data). This can be applied to compare company biodiversity performance across a sector. This is typically a BA applied by many financial institutions or by data providers to these FI
BA 6: Certification by third parties*
Third party certification based on auditing of a clearly established methodological approach.
BA 7: Screening and assessment of biodiversity risks and opportunities
Biodiversity measurement approaches can be used, for instance in case of due diligence assessments as part of mergers and acquisitions, or assessment undertaken by investors to differentiate between investment options, either based on the biodiversity performance or return on investment of different companies. This might also be undertaken by FI to assess biodiversity risk and inform pricing credit. This application often, but not always, overlaps with BA 4.
Organisational focus areas
The following organisational focus areas are included:
- Product/service
- Site/project
- Supply chain
- Corporate
- Portfolio/sector
- Country/region
Maturity levels
- Potential
- Emerging
- Mature
Pressures table
The following biodiversity pressures are identified. These reflect material impacts on biodiversity that may be due to business activities or reflect dependencies on biodiversity (i.e. adverse impact of climate change on biodiversity used by business).
These may be useful for understanding biodiversity issues in specific policy contexts such as on-farm biodiversity audits or for biodiversity reporting. They may also inform potential risks in developing net gain or habitat restoration projects, e.g. sites that are at greater vulnerability to one or more pressures.
- Land/sea use change
- Direct exploitation
- Biological resource use (e.g. overfishing)
- Water use
- Invasive alien species
- Pollution
- Atmospheric nitrogen deposition
- Nutrient emissions to water
- Climate change
- Other (e.g. habitat fragmentation, human encroachment, erosion, disturbance, pesticide use)
Biodiversity ambitions
This table includes relevant biodiversity targets:
- CBD post-2020 biodiversity targets
- Science based targets for nature
- No net loss/net gain
- Sustainable Development Goals
- ISO 14001, EMAS
- Voluntary standards at sector level or product level
- Voluntary biodiversity assessments and reporting frameworks
- Voluntary biodiversity agreements
- Regulating and permitting requirements
- Financial institutions requirements
- Site to landscape level commitments
- Specific corporate-level biodiversity commitments or engagements
The report does not carry out an assessment of the tools against these. Instead, the consequences of each target for tool selection is discussed with suitable tools either described or named where relevant.
Biodiversity scope
This table assesses whether the tools cover the following elements:
- Habitats/species
- Ecosystem services
- Genes
Only one tool (B-INTACT) measured genes and only qualitatively.
Biodiversity metrics
A number of biodiversity metrics are listed, these can either be generic (number of species, habitat extent), specific or applied by a particular approach (e.g. scores or indices), or potential approaches (i.e. were not used by any of the assessed approaches). The biodiversity metrics table (Table 15) also notes the resulting unit of biodiversity, its key points, uses and scale of analysis.
Table 15 Typology of metrics, what measured and example uses (source: Lammerant et al., 2022)
| Type of metric |
Commonly used metric |
Unit of biodiversity |
Used for |
Scale of analysis |
|---|---|---|---|---|
| Species metrics |
Number of individuals |
Number of individuals of any one species |
Simple easily communicated compensation for impacts to key species |
Project or site scale |
| STAR (Species Threat Abatement and Restoration metric) |
Globally threatened species |
Compare potential threat abatement and restoration actions, set science-based targets, and track progress over time. |
Any scale |
|
| Extent * Condition metrics |
Habitat hectares; quality hectares |
Ecosystems |
Measuring losses and gains within the same ecosystem type; used by many offset schemes |
Project or site scale |
| Mean Species Abundance (MSA) |
All species |
Impact assessment and LCA using GLOBIO model |
Product, corporate or global scale |
|
| Potentially Disappeared Fraction (PDF) |
All species |
Impact assessment and LCA using ReCiPe model |
Product, corporate or global scale |
|
| Extent (or area) * Condition (or quality) * Significance metrics |
Biodiversity Intactness Index (BII) |
All Species |
Impact assessment and LCA using the PREDICTS model |
Product, corporate or global scale |
| Biodiversity Impact Metric (BIM) |
All species |
Supply chain assessments and impact assessments |
Product, corporate or global scale |
|
| Site Biodiversity Condition Class |
Habitats |
Monitoring progress of quarry rehabilitation |
Site scale |
|
| BNGC score |
Biodiversity value per m2 |
Measuring losses and gains within the same ecosystem type. Can be used to refine MSA model scores. Can be used to underpin 'nature positive' investment as offsets for achieving 'no net loss' or 'nature positive ambitions' |
Site or project scale |
|
| Biodiversity scoring system |
Biodiversity units (BU) |
Calculate the losses and gains in biodiversity unit value resulting from changes or actions which affect biodiversity, such as from development or changing the conservation management of a land holding |
Site or project scale |
|
| Thematic metrics |
Examples: Deforestation free commodities or supply chains; surface of regenerated or restored land; palm oil free etc. |
km2 or % |
To demonstrate compliance with specific biodiversity targets |
Product, supply chain and corporate scale |
| Agrobiodiversity Index (ABDI) |
Agro-biodiversity |
Sustainable agriculture |
Site to corporate scale |
|
| Financial metrics |
Environmental Profit and Loss accounts (EP&L) |
Ecosystem services |
LCA |
Product, site, corporate or global scale |
| Combined state, pressure and response metrics (dashboard) |
No single quantitative metric, with score cards used to identify risk areas. Appreciation of progress (e.g. colour codes, arrows…) |
Habitat/ species/ population/ biodiversity management unit (BMU) |
Monitoring progress to target |
Site and project scale |
Level of effort
This table relates to the level of expertise, accessibility, and costs of applying a tool or approach.
- Accessibility
- Full open source
- Open source with support
- Commercial
- Required expertise
- Internal – available within company
- External – external expertise most probably required
- External but training possible
- Costs
- External – high/medium/low
- Other – high/medium/low
- No costs
Sector applicability
This reflects the commonly occurring sectors where the tools and approaches have been applied:
- Agriculture
- Mining
- Financial institutions
- Other
Summary and recommendations for Scottish metric criteria
Business application table
Activities related to assessing current and future performance with respect to biodiversity, including third party verification are relevant to applications of a Scottish metric
Organisational focus area
Applications to different scales including project, site, region or national are relevant to a Scottish metric. Some sector-specific tools (e.g. developments of Agrecalc) would fall into supply chain. Corporate could be applied to a land holding as a business entity.
Maturity level
Relevant to a development of a Scottish metric.
Pressures table
The pressures relate to factors that may impact on biodiversity (rather than ES impacts of the business use of land/resources). These are not included in tools such as the Biodiversity Metric 3.0 at present, but could be important in determining the future outcomes of habitat restoration (e.g. vulnerability of restored peatland to future climate change). This could take the form of additional multipliers when scoring habitat recreation/restoration. Suggest discussion of revision/refinement and additional pressures relevant to Scottish users, e.g. disaggregating climate impacts such as changes to temperature, precipitation, disease risk.
Biodiversity ambitions
These are inherent in the policy drivers for the project but could include flexibility for changing objectives and targets. The current table is descriptive with tools mentioned where directly linked (e.g. Biodiversity Metric 3.0 and net gain).
Biodiversity scope
Useful in assessing tools against policy areas, and identifying potential adjustments to Biodiversity Metric 3.0.
Biodiversity metric
Current species-based metrics (number of individuals, globally threatened species) may not be appropriate across all applications. Does not include number or diversity of species. Species-based metric may impact on repeatability, e.g. resources and timing of repeated surveying. Habitat extent metrics are more widely used.
Level of efforts
Important element for assessing tools. Impact of effort requirements will vary across sectors/applications and scales. Flexibility will be important for a Scottish metric that can be scaled and widely applied.
Sector applicability
Currently includes agriculture, but could be expanded to include habitats/sectors relevant to Scotland, e.g. peatland restoration, woodland creation.
Contact
Email: katherine.pollard@gov.scot