
Cardiovascular risk reduction - quality prescribing guidance 2026-2029: consultation
Cardiovascular disease (CVD) is largely preventable, and many modifiable risk factors increase the likelihood of developing CVD. This guide highlights how to support people in modifying risk factors such as diet, healthy weight, alcohol, physical activity, stress and tobacco smoking.
Open
32 days to respond
Respond online
16. Appendix A: Data to drive change in cardiovascular disease prevention
This section aims to introduce the relevant data sources and tools used in monitoring prescribing and how these can be used to drive improvements in individual care.
Healthcare delivery produces a large amount of data which can be used to identify areas of unwarranted variation and drive improvements in healthcare at an individual and organisational level.
Understanding this data and how these systems and tools interact can be challenging, especially where care of the individual is the key. However, tools for aggregate data visualisation, benchmarking and patient identification are available from a number of different sources. Figure 8 outlines how data can be gathered from a range of sources and used to improve individual care.
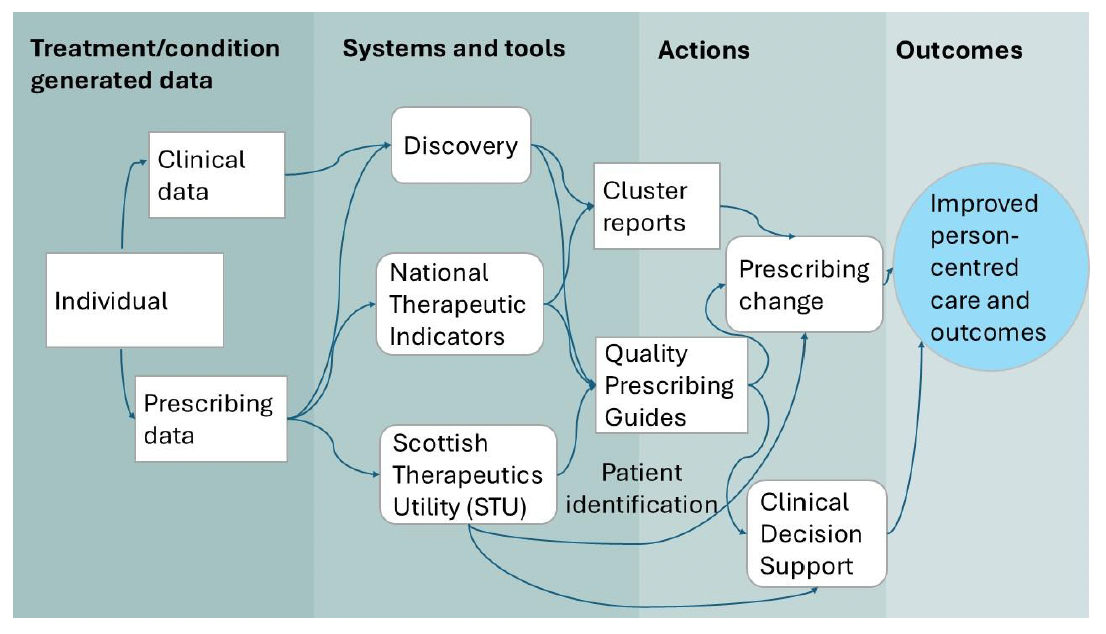
The tables below outline the systems and resources available to monitor and utilise data, and how to use them.
Table 18: National Therapeutic Indicators (NTIs)
System/resource
What is it?
National Therapeutic Indicators (NTIs)
An indicator of clinical practice. National Therapeutic Indicators ( NTIs), use prescription data to provide a measure of prescribing activity in specified therapeutic areas for comparison across NHS Boards, Health and Social Care Partnerships (HSCPs), GP clusters and GP practices.
System/resource
Who can access/ use?
National Therapeutic Indicators (NTIs)
National Therapeutic Indicators are online with open access to anyone.
System/resource
Why? What for?
National Therapeutic Indicators (NTIs)
NTIs benchmark prescribing across set parameters (usually defined by expert working groups to identify areas for improvement within a particular area). Data is presented in a variety of ways. Examining variation over time can indicate where improvements in prescribing can be made. Indicator detail provides further detail and suggested actions. A new dashboard view is also available, providing additional context such as demographics and prevalence.
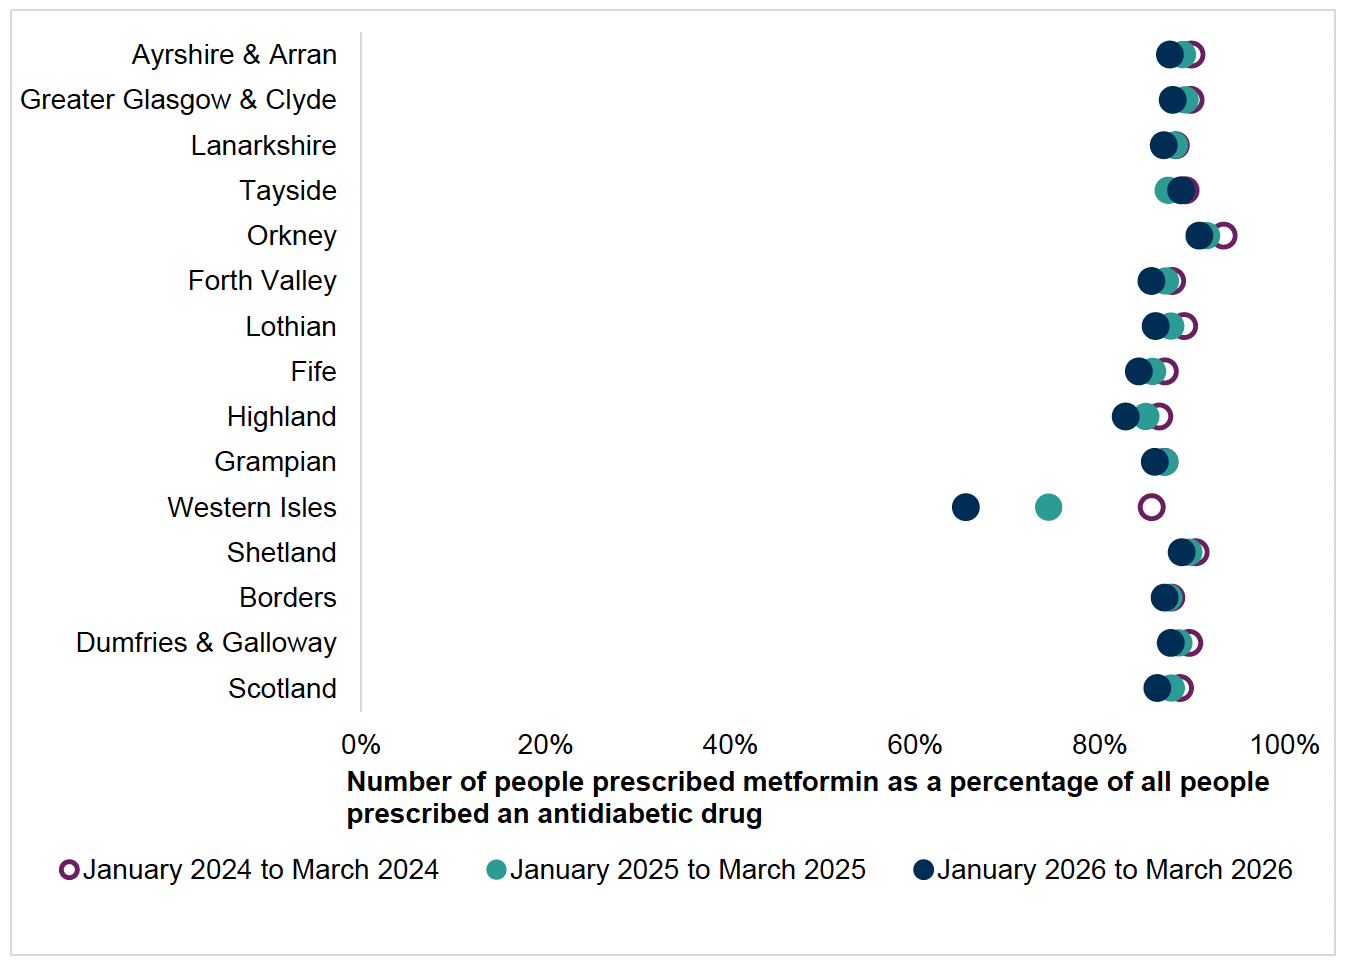
Table 19: Scottish Therapeutics Utility (STU)
System/resource
What is it?
Scottish Therapeutics Utility (STU)
A system to identify individuals in general practice, according to a set of pre-defined parameters, such as prescribing and clinical data (including read coding). STU focuses on identifying people to improve prescribing practice and improve medication safety.
System/resource
Who can access/use?
Scottish Therapeutics Utility (STU)
GP practice staff only. Instructions and download information are available on the EScro Home Page.
System/resource
Why? What for?
Scottish Therapeutics Utility (STU)
STU was developed to improve safety, optimise efficiency and reduce avoidable waste (processes and costs), particularly in relation to repeat prescribing. The utility allows users to interrogate their prescribing data in real time and provides graphs to identify trends in repeat prescribing. STU includes reports which identify areas of high-risk prescribing. This supports clinicians in reviewing individuals at risk to determine if prescribing is necessary and how the risk can be reduced.
Example
The polypharmacy indicators (developed from the NTIs and prescribing guide) highlight the number of people in each indicator. From each indicator title, the names of individuals are shown and their prescribing record summarised below. STU has the facility to open the patient record to allow changes directly in EMIS or Vision.
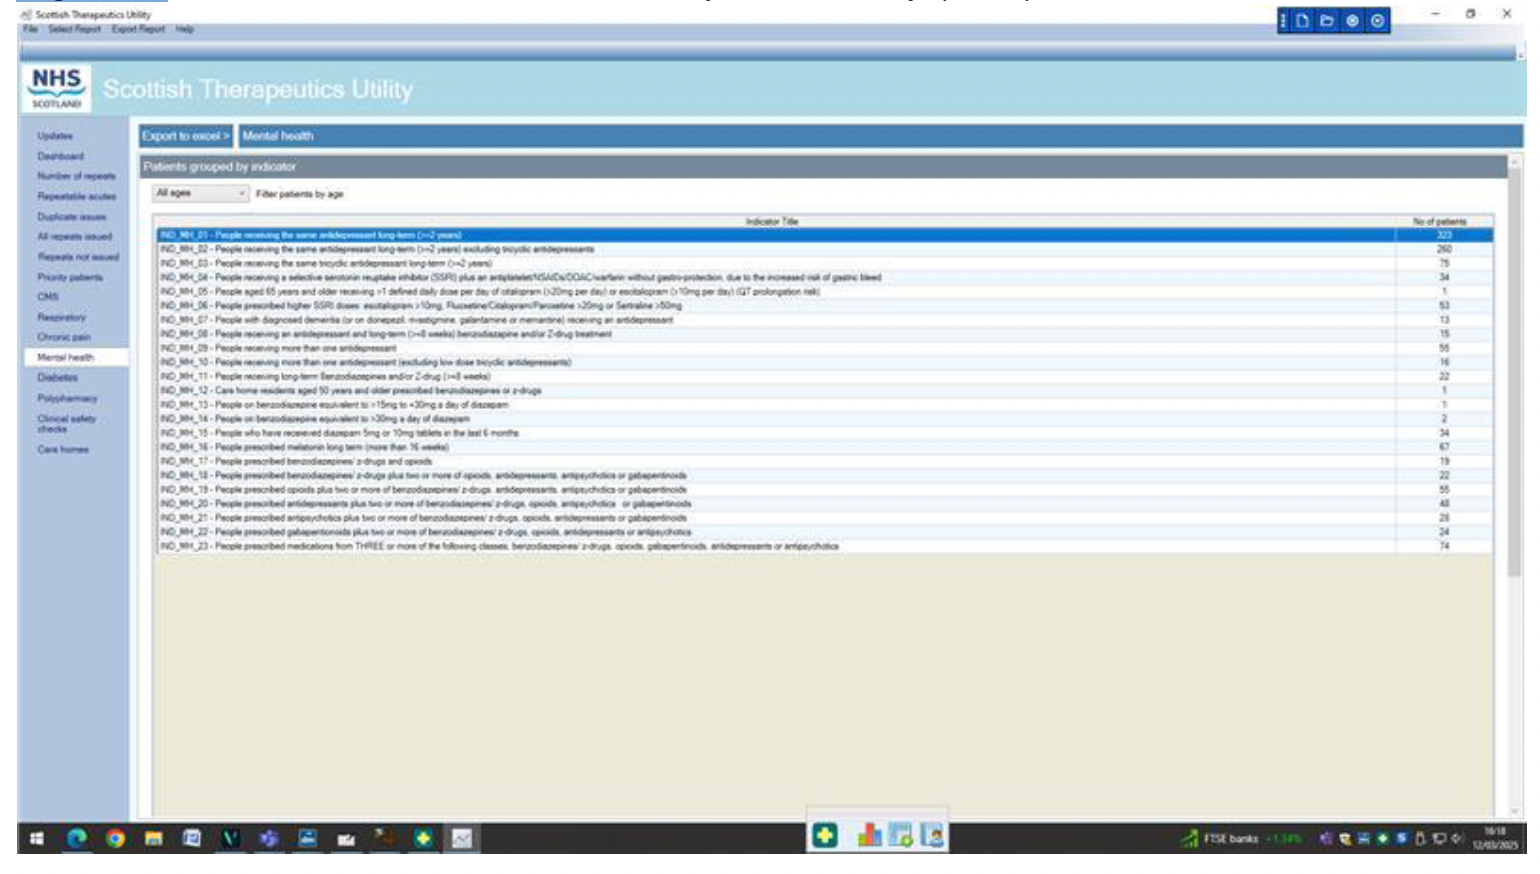
Table 20: Discovery
System/resource
What is it?
Discovery
Discovery is an information system that provides approved users from the Scottish Government, health boards, local authorities and Health & Social Care Partnerships with access to a range of comparative healthcare information to support performance and quality improvement across Health & Social Care in Scotland. There is a prescribing dashboard, including measures including: Polypharmacy, Primary and Secondary Care Expenditure and Secondary Care Use of Medicines (HMUD).
System/resource
Who can access/use?
Discovery
NHS Staff (including Board staff, GPs), Public Health Scotland (PHS) and Scottish Government. There are different security levels. Level 1 allows access to Board level data. Level 2 allows access to general practice level data.
System/resource
Why? What for?
Discovery
Discovery provides comparative and benchmarking information to underpin service planning and delivery.
Example
The example below is from the Polypharmacy dashboard:
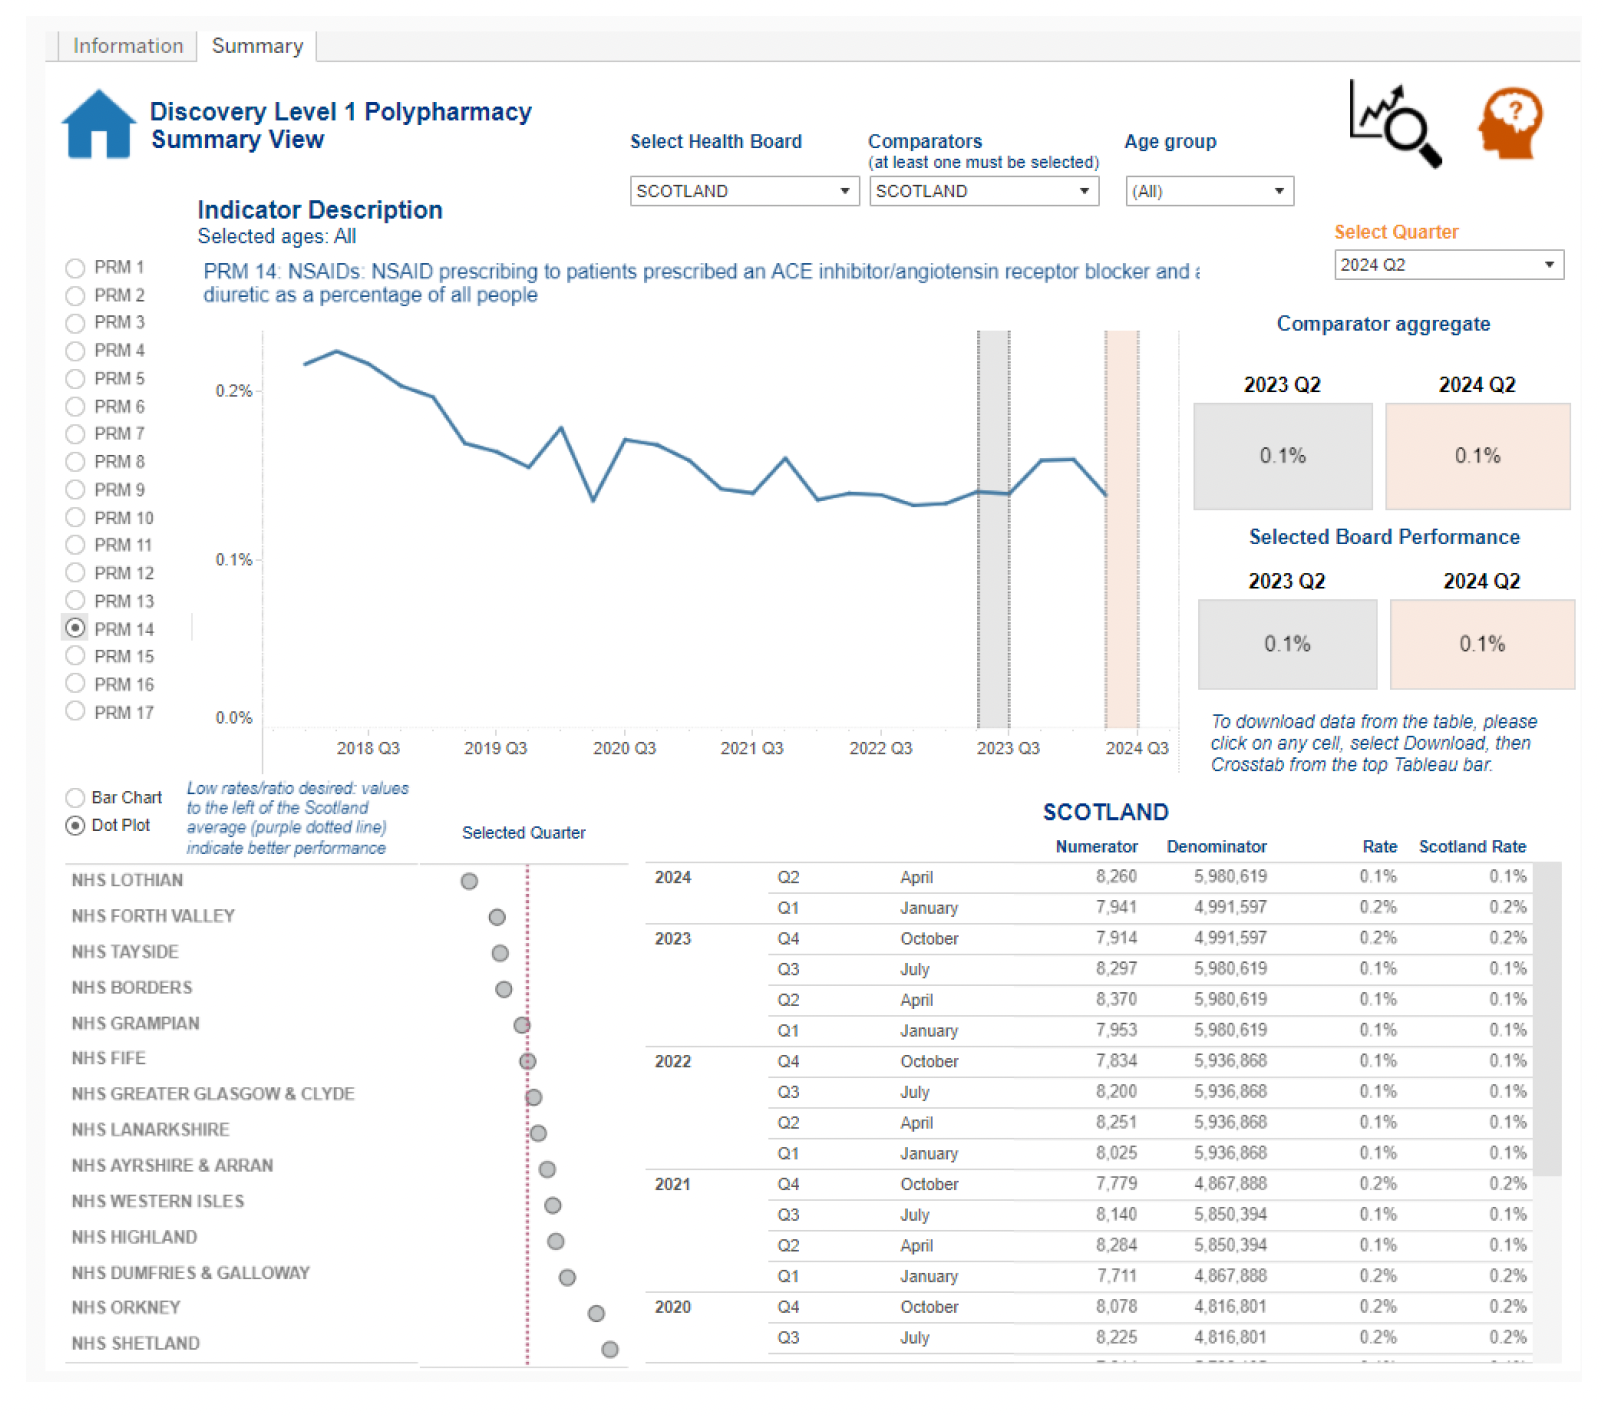
Contact
Email: EPandT@gov.scot